Proceedings of the 6th Workshop on Statistical Machine Translation, pages 22–64, Edinburgh, Scotland, UK, July 30–31, 2011. c2011 Association for Computational Linguistics
Findings of the 2011 Workshop on Statistical Machine Translation
Chris Callison-Burch
Center for Language and Speech Processing Johns Hopkins University
Philipp Koehn
School of Informatics University of Edinburgh
Christof Monz
Informatics Institute University of Amsterdam
Omar F. Zaidan
Center for Language and Speech Processing Johns Hopkins University
Abstract
This paper presents the results of the WMT11 shared tasks, which included a translation task, a system combination task, and a task for machine translation evaluation metrics. We conducted a large-scale manual evaluation of 148 machine translation systems and 41 sys-tem combination entries. We used the rank-ing of these systems to measure how strongly automatic metrics correlate with human judg-ments of translation quality for 21 evaluation metrics. This year featured a Haitian Creole to English task translating SMS messages sent to an emergency response service in the af-termath of the Haitian earthquake. We also conducted a pilot ‘tunable metrics’ task to test whether optimizing a fixed system to ent metrics would result in perceptibly differ-ent translation quality.
1 Introduction
This paper presents the results of the shared tasks of the Workshop on statistical Machine Translation
(WMT), which was held at EMNLP 2011. This
workshop builds on five previous WMT workshops (Koehn and Monz, 2006; Callison-Burch et al., 2007; Callison-Burch et al., 2008; Callison-Burch et al., 2009; Callison-Burch et al., 2010). The work-shops feature three shared tasks: a translation task between English and other languages, a task to com-bine the output of multiple machine translation sys-tems, and a task to predict human judgments of translation quality using automatic evaluation met-rics. The performance for each of these shared tasks is determined through a comprehensive human
eval-uation. There were a two additions to this year’s workshop that were not part of previous workshops:
• Haitian Creole featured task– In addition to translation between European language pairs, we featured a new translation task: translating Haitian Creole SMS messages that were sent to an emergency response hotline in the im-mediate aftermath of the 2010 Haitian earth-quake. The goal of this task is to encourage re-searchers to focus on challenges that may arise in future humanitarian crises. We invited Will Lewis, Rob Munro and Stephan Vogel to pub-lish a paper about their experience developing translation technology in response to the crisis (Lewis et al., 2011). They provided the data used in the Haitian Creole featured translation task. We hope that the introduction of this new dataset will provide a testbed for dealing with low resource languages and the informal lan-guage usage found in SMS messages.
• Tunable metric shared task– We conducted a pilot of a new shared task to use evaluation metrics to tune the parameters of a machine translation system. Although previous work-shops have shown evaluation metrics other than
BLEUare more strongly correlated with human
judgments when ranking outputs from multiple
systems, BLEUremains widely used by system
developers to optimize their system parameters. We challenged metric developers to tune the parameters of a fixed system, to see if their met-rics would lead to perceptibly better translation quality for the system’s resulting output.
The primary objectives of WMT are to evaluate the state of the art in machine translation, to dissem-inate common test sets and public training data with published performance numbers, and to refine eval-uation methodologies for machine translation. As with previous workshops, all of the data, transla-tions, and collected human judgments are publicly
available.1 We hope these datasets form a valuable
resource for research into statistical machine transla-tion, system combinatransla-tion, and automatic evaluation of translation quality.
2 Overview of the Shared Translation and System Combination Tasks
The recurring task of the workshop examines trans-lation between English and four other languages: German, Spanish, French, and Czech. We created a test set for each language pair by translating newspa-per articles. We additionally provided training data and two baseline systems.
2.1 Test data
The test data for this year’s task was created by hiring people to translate news articles that were drawn from a variety of sources from early Decem-ber 2010. A total of 110 articles were selected, in roughly equal amounts from a variety of Czech,
En-glish, French, German, and Spanish news sites:2
Czech: aktualne.cz (4), Novinky.cz (7),
iH-Ned.cz (4), iDNES.cz (4)
French: Canoe (5), Le Devoir (5), Le Monde (5), Les Echos (5), Liberation (5)
Spanish: ABC.es (6), Cinco Dias (6), El Period-ico (6), Milenio (6), Noroeste (7)
English: Economist (4), Los Angeles Times (6), New York Times (4), Washington Post (4) German: FAZ (3), Frankfurter Rundschau (2),
Fi-nancial Times Deutschland (3), Der Spie-gel (5), S¨uddeutsche Zeitung (3)
The translations were created by the professional
translation agency CEET.3 All of the translations
1http://statmt.org/wmt11/results.html 2
For more details see the XML test files. Thedocid tag gives the source and the date for each document in the test set, and theoriglangtag indicates the original source language.
3http://www.ceet.eu/
were done directly, and not via an intermediate lan-guage.
Although the translations were done profession-ally, in some cases errors still cropped up. For in-stance, in parts of the English-French translations, some of the English source remains in the French reference as if the translator forgot to delete it.
2.2 Training data
As in past years we provided parallel corpora to train translation models, monolingual corpora to train lan-guage models, and development sets to tune system parameters. Some statistics about the training mate-rials are given in Figure 1.
2.3 Baseline systems
To lower the barrier of entry for newcomers to the field, we provided two open source toolkits for phrase-based and parsing-based statistical machine translation (Koehn et al., 2007; Li et al., 2010).
2.4 Submitted systems
We received submissions from 56 groups across 37 institutions, as listed in Tables 1, 2 and 3. We also included two commercial off-the-shelf MT systems, two online statistical MT systems, and five online rule-based MT systems. (Not all systems supported all language pairs.) We note that these nine compa-nies did not submit entries themselves, and are there-fore anonymized in this paper. Rather, their entries were created by translating the test data via their web
interfaces.4 The data used to construct these systems
is not subject to the same constraints as the shared task participants. It is possible that part of the refer-ence translations that were taken from online news sites could have been included in the online systems’ models, for instance. We therefore categorize all commercial systems as unconstrained when evalu-ating the results.
2.5 System combination
In total, we had 148 primary system entries (includ-ing the 46 entries crawled from online sources), and 60 contrastive entries. These were made available to
4
Europarl Training Corpus
Spanish↔English French↔English German↔English Czech↔English
Sentences 1,786,594 1,825,077 1,739,154 462,351
Words 51,551,370 49,411,045 54,568,499 50,551,047 45,607,269 47,978,832 10,573,983 12,296,772
Distinct words 171,174 113,655 137,034 114,487 362,563 111,934 152,788 56,095
News Commentary Training Corpus
Spanish↔English French↔English German↔English Czech↔English
Sentences 132,571 115,562 136,227 122,754
Words 3,739,293 3,285,305 3,290,280 2,866,929 3,401,766 3,309,619 2,658,688 2,951,357
Distinct words 73,906 53,699 59,911 50,323 120,397 53,921 130,685 50,457
United Nations Training Corpus
Spanish↔English French↔English
Sentences 10,662,993 12,317,600
Words 348,587,865 304,724,768 393,499,429 344,026,111
Distinct words 578,599 564,489 621,721 729,233
109 Word Parallel Corpus
French↔English Sentences 22,520,400
Words 811,203,407 668,412,817
Distinct words 2,738,882 2,861,836
CzEng Training Corpus
Czech↔English Sentences 7,227,409
Words 72,993,427 84,856,749
Distinct words 1,088,642 522,770
Europarl Language Model Data
English Spanish French German Czech Sentence 2,032,006 1,942,761 2,002,266 1,985,560 479,636
Words 54,720,731 55,105,358 57,860,307 48,648,697 10,770,230
Distinct words 119,315 176,896 141,742 376,128 154,129
News Language Model Data
English Spanish French German Czech
Sentence 30,888,595 3,416,184 11,767,048 17,474,133 12,333,268
Words 777,425,517 107,088,554 302,161,808 289,171,939 216,692,489
Distinct words 2,020,549 595,681 1,250,259 3,091,700 2,068,056
News Test Set
English Spanish French German Czech
Sentences 3003
Words 75,762 79,710 85,999 73,729 65,427
Distinct words 10,088 11,989 11,584 14,345 16,922
Figure 1: Statistics for the training and test sets used in the translation task. The number of words and the number of distinct words (case-insensitive) is based on the provided tokenizer.
ID Participant
ALACANT University of Alicante (S´anchez-Cartagena et al., 2011)
CEU-UPV CEU University Cardenal Herrera
& Polytechnic University of Valencia (Zamora-Martinez and Castro-Bleda, 2011)
CMU-DENKOWSKI Carnegie Mellon University - Denkowski (Denkowski and Lavie, 2011b)
CMU-DYER Carnegie Mellon University - Dyer (Dyer et al., 2011)
CMU-HANNEMAN Carnegie Mellon University - Hanneman (Hanneman and Lavie, 2011)
COPENHAGEN Copenhagen Business School
CST Centre for Language Technology @ Copenhagen University (Rishøj and Søgaard, 2011)
CU-BOJAR Charles University - Bojar (Mareˇcek et al., 2011)
CU-MARECEK Charles University - Mareˇcek (Mareˇcek et al., 2011)
CU-POPEL Charles University - Popel (Popel et al., 2011)
CU-TAMCHYNA Charles University - Tamchyna (Bojar and Tamchyna, 2011)
CU-ZEMAN Charles University - Zeman (Zeman, 2011)
DFKI-FEDERMANN Deutsches Forschungszentrum f¨ur K¨unstliche Intelligenz - Federmann
(Federmann and Hunsicker, 2011)
DFKI-XU Deutsches Forschungszentrum f¨ur K¨unstliche Intelligenz - Xu (Xu et al., 2011b)
HYDERABAD IIIT-Hyderabad
ILLC-UVA Institute for Logic, Language and Computation @ University of Amsterdam
(Khalilov and Sima’an, 2011)
JHU Johns Hopkins University (Weese et al., 2011)
KIT Karlsruhe Institute of Technology (Herrmann et al., 2011)
KOC Koc University (Bicici and Yuret, 2011)
LATL-GENEVA Language Technology Laboratory @ University of Geneva (Wehrli et al., 2009)
LIA-LIG Laboratoire Informatique d’Avignon @ The University of Avignon
& Laboratoire d’Informatique de Grenoble @ University of Grenoble (Potet et al., 2011)
LIMSI LIMSI (Allauzen et al., 2011)
LINGUATEC Linguatec Language Technologies (Aleksic and Thurmair, 2011)
LIU Link¨oping University (Holmqvist et al., 2011)
LIUM University of Le Mans (Schwenk et al., 2011)
PROMT ProMT
RWTH-FREITAG RWTH Aachen - Freitag (Huck et al., 2011)
RWTH-HUCK RWTH Aachen - Huck (Huck et al., 2011)
RWTH-WUEBKER RWTH Aachen - W¨ubker (Huck et al., 2011)
SYSTRAN SYSTRAN
UEDIN University of Edinburgh (Koehn et al., 2007)
UFAL-UM Charles University and University of Malta (Corb´ı-Bellot et al., 2005)
UOW University of Wolverhampton (Aziz et al., 2011)
UPM Technical University of Madrid (L´opez-Lude˜na and San-Segundo, 2011)
UPPSALA Uppsala University (Koehn et al., 2007)
UPPSALA-FBK Uppsala University
& Fondazione Bruno Kessler (Hardmeier et al., 2011)
ONLINE-[A,B] two online statistical machine translation systems
RBMT-[1–5] five online rule-based machine translation systems
COMMERCIAL-[1,2] two commercial machine translation systems
ID Participant
BBN-COMBO Raytheon BBN Technologies (Rosti et al., 2011)
CMU-HEAFIELD-COMBO Carnegie Mellon University (Heafield and Lavie, 2011)
JHU-COMBO Johns Hopkins University (Xu et al., 2011a)
KOC-COMBO Koc University (Bicici and Yuret, 2011)
LIUM-COMBO University of Le Mans (Barrault, 2011)
QUAERO-COMBO Quaero Project∗(Freitag et al., 2011)
RWTH-LEUSCH-COMBO RWTH Aachen (Leusch et al., 2011)
UOW-COMBO University of Wolverhampton (Specia et al., 2010)
UPV-PRHLT-COMBO Polytechnic University of Valencia (Gonz´alez-Rubio and Casacuberta, 2011) UZH-COMBO University of Zurich (Sennrich, 2011)
Table 2: Participants in the shared system combination task. Not all teams participated in all language pairs.
∗The Quaero Project entry combined outputs they received directly from LIMSI, KIT, SYSTRAN, and RWTH.
participants in the system combination shared task. Continuing our practice from last year’s workshop, we separated the test set into a tuning set and a final held-out test set for system combinations. The tun-ing portion was distributed to system combination participants along with reference translations, to aid them set any system parameters.
In the European language pairs, the tuning set consisted of 1,003 segments taken from 37 docu-ments, whereas the test set consisted of 2,000 seg-ments taken from 73 docuseg-ments. In the Haitian Cre-ole task, the split was 674 segments for tuning and 600 for testing.
Table 2 lists the 10 participants in the system com-bination task.
3 Featured Translation Task
The featured translation task of WMT11 was to translate Haitian Creole SMS messages into En-glish. These text messages were sent by people in Haiti in the aftermath of the January 2010 earth-quake. In the wake of the earthquake, much of the country’s conventional emergency response services
failed. Since cell phone towers remained
stand-ing after the earthquake, text messages were a vi-able mode of communication. Munro (2010) de-scribes how a text-message-based emergency report-ing system was set up by a consortium of volunteer organizations named “Mission 4636” after a free SMS short code telephone number that they estab-lished. The SMS messages were routed to a system for reporting trapped people and other emergencies.
Search and rescue teams within Haiti, including the US Military, recognized the quantity and reliabil-ity of actionable information in these messages and used them to provide aid.
The majority of the SMS messages were writ-ten in Haitian Creole, which was not spoken by most of first responders deployed from overseas. A distributed, online translation effort was estab-lished, drawing volunteers from Haitian Creole- and French-speaking communities around the world. The volunteers not only translated messages, but also categorized them and pinpointed them on a
map.5 Collaborating online, they employed their
lo-cal knowledge of locations, regional slang, abbre-viations and spelling variants to process more than 40,000 messages in the first six weeks alone. First responders indicated that this volunteer effort helped to save hundreds of lives and helped direct the first food and aid to tens of thousands. Secretary of State Clinton described one success of the Mission 4636 program:“The technology community has set up in-teractive maps to help us identify needs and target resources. And on Monday, a seven-year-old girl and two women were pulled from the rubble of a collapsed supermarket by an American search-and-rescue team after they sent a text message calling for help.” Ushahidi@Tufts described another:“The World Food Program delivered food to an informal camp of 2500 people, having yet to receive food or water, in Diquini to a location that 4636 had
identi-5
A detailed map of Haiti was created by a crowdsourcing effort in the aftermath of the earthquake (Lacey-Hall, 2011).
ID Participant
BM-I2R Barcelona Media
& Institute for Infocomm Research (Costa-juss`a and Banchs, 2011)
CMU-DENKOWSKI Carnegie Mellon University - Denkowski (Denkowski and Lavie, 2011b)
CMU-HEWAVITHARANA Carnegie Mellon University - Hewavitharana (Hewavitharana et al., 2011)
HYDERABAD IIIT-Hyderabad
JHU Johns Hopkins University (Weese et al., 2011)
KOC Koc University (Bicici and Yuret, 2011)
LIU Link¨oping University (Stymne, 2011)
UMD-EIDELMAN University of Maryland - Eidelman (Eidelman et al., 2011)
UMD-HU University of Maryland - Hu (Hu et al., 2011)
UPPSALA Uppsala University (Hardmeier et al., 2011)
Table 3: Participants in the featured translation task (Haitian Creole SMS into English; individual system track). Not all teams participated in both the ‘Clean’ and ‘Raw’ tracks.
fied for them.”
In parallel with Rob Munro’s crowdsourcing translation efforts, the Microsoft Translator team de-veloped a Haitian Creole statistical machine transla-tion engine from scratch in a compressed timeframe
(Lewis, 2010). Despite the impressive number
of translations completed by volunteers, machine translation was viewed as a potentially useful tool for higher volume applications or to provide trans-lations of English medical documents into Haitian Creole. The Microsoft Translator team quickly as-sembled parallel data from a number of sources, including Mission 4636 and from the archives of Carnegie Mellon’s DIPLOMAT project (Frederking et al., 1997). Through a series of rapid prototyp-ing efforts, the team improved their system to deal with non-standard orthography, reduced pronouns, and SMS shorthand. They deployed a functional translation system to relief workers in the field in less than 5 days – impressive even when measured against previous rapid MT development efforts like DARPA’s surprise language exercise (Oard, 2003; Oard and Och, 2003).
We were inspired by the efforts of Rob Munro and Will Lewis on translating Haitian Creole in the af-termath of the disaster, so we worked with them to create a featured task at WMT11. We thank them for generously sharing the data they assembled in their own efforts. We invited Rob Munro, Will Lewis, and Stephan Vogel to speak at the workshop on the topic of developing translation technology for future
crises, and they recorded their thoughts in an invited publication (Lewis et al., 2011).
3.1 Haitian Creole Data
For the WMT11 featured translation task, we anonymized the SMS Haitian Creole messages along with the translations that the Mission 4636 volunteers created. Examples of these messages are given in Table 4. The goal of anonymizing the SMS data was so that it may be shared with researchers who are developing translation and mapping tech-nologies to support future emergency relief efforts and social development. We ask that any researcher working with these messages to be aware that they are actual communications sent by people in need in a time of crisis. Researchers who use this data are asked to be cognizant of the following:
• Some messages may be distressing in content.
• The people who sent the messages (and who
are discussed in them) were victims of a natural disaster and a humanitarian crisis. Please treat the messages with the appropriate respect for these individuals.
• The primary motivation for using this data
should be to understand how we can better re-spond to future crises.
mwen se [FIRSTNAME] mwen gen twaset ki mouri mwen mande nou ed pou nou edem map tan repons
I am [FIRSTNAME], I have three sisters who have died. I ask help for us, I await your response.
Ki kote yap bay manje Where are they giving out food?
Eske lekol kolej marie anne kraze?mesi Was the College Marie Anne school destroyed? Thank you. Nou pa ka anpeche moustik yo m`ode nou paske yo anpil. We can’t prevent the mosquitoes from biting because there
are so many.
tanpri k`em ap kase mwen pa ka pran nouvel manmanm. Please heart is breaking because I have no news of my mother.
4636:Opital Medesen san Fwonti`e delmas 19 la f`emen. Opital sen lwi gonzag nan delma 33 pran an chaj gratwit-man tout moun ki malad ou blese
4636: The Doctors without Borders Hospital in Delmas 19 is closed. The Saint Louis Gonzaga hospital in Delmas 33 is taking in sick and wounded people for free
Mwen r´es´evoua mesaj nou yo 5 sou 5 men mwen ta vle di yon bagay kil`e e koman nap kapab f`em jwin `ed sa yo pou moune b la kay mwen ki sinistw´e adr`es la s´e
I received your message 5/5 but I would like to ask one thing when and how will you be able to get the aid to me for the people around my house who are victims of the earth-quake? The address is
Sil vous plait map chehe [LASTNAME][FIRSTNAME].di yo relem nan [PHONENUMBER].mwen se [LAST-NAME] [FIRST[LAST-NAME]
I’m looking for [LASTNAME][FIRSTNAME]. Tell him to call me at [PHONENUMBER] I am [LASTNAME] [FIRSTNAME]
Bonswa mwen rele [FIRSTNAME] [LASTNAME] kay mwen krase mwen pagin anyin poum mange ak fanmi-m tampri di yon mo pou mwen fem jwen yon tante tou ak mange. .mrete n
Hello my name is [FIRSTNAME] [LASTNAME]my house fell down, I’ve had nothing to eat and I’m hungry. Please help me find food. I live
Mwen viktim kay mwen kraze `eskem ka ale sendomeng mwen gen pasp`o
I’m a victim. My home has been destroyed. Am I allowed to go to the Dominican Republic? I have a Passport. KISAM DWE FE LEGEN REPLIK,ESKE MOUN SAINT
MARC AP JWENN REPLIK.
What should I do when there is an aftershock? Will the people of Saint Marc have aftershocks?
MWEN SE YON JEN ETIDYAN AN ASYANS ENFO-MATIK KI PASE ANPIL MIZE NAN TRANBLEMAN DE TE 12 JANVYE A TOUT FANMIM FIN MOURI MWEN SANTIM SEL MWEN TE VLE ALE VIV
I’m a young student in computer science, who has suffered a lot during and after the earthquake of January 12th. All my family has died and I feel alone. I wanted to go live.
Mw rele [FIRSTNAME], mw f`e mason epi mw abite lapl`en. Yo dim minustah ap bay djob mason ki kote pou mw ta pase si mw ta vle jwenn nan djob sa yo.
My name is [FIRSTNAME], I’m a construction worker and I live in La Plaine. I heard that the MINUSTAH was giving jobs to construction workers. What do I have to go to find one of these jobs?
Souple mande lapolis pou fe on ti pase nan magloire am-broise prolonge zone muler ak cadet jeremie ginyin jen ga-son ki ap pase nan zone sa yo e ki agresi
please ask the police to go to magloire ambroise going to-wards the ”muler” area and cadet jeremie because there are very aggressive young men in these areas
KIBO MOUN KA JWENN MANJE POU YO MANJE ANDEYO KAPITAL PASKE DEPI 12 JANVYE YO VOYE MANJE POU PEP LA MEN NOU PA JANM JWENN ANYEN. NAP MOURI AK GRANGOU
Where can people get food to eat outside of the capital be-cause since January 12th, they’ve sent food for the people but we never received anything. We are dying of hunger
Mwen se [FIRSTNAME][LASTNAME] mwen nan aken mwen se yon j`en ki ansent mwen te genyen yon paran ki tap ede li mouri p`otoprens, mwen pral akouye nan k`omansman feviye
I am [FIRSTNAME][LASTNAME] I am in Aquin I am a pregnant young person I had a parent who was helping me, she died in Port-au-Prince, I’m going to give birth at the start of February
Table 4: Examples of some of the Haitian Creole SMS messages that were sent to the 4636 short code along with their translations into English. Translations were done by volunteers who wanted to help with the relief effort. Prior to being distributed, the messages were anonymized to remove names, phone numbers, email addresses, etc. The anonymization guidelines specified that addresses be retained to facilitate work on mapping technologies.
Training set Parallel Words
sentences per lang
In-domain SMS data 17,192 35k
Medical domain 1,619 10k
Newswire domain 13,517 30k
Glossary 35,728 85k
Wikipedia parallel sentence 8,476 90k
Wikipedia named entities 10,499 25k
The bible 30,715 850k
Haitisurf dictionary 3,763 4k
Krengle dictionary 1,687 3k
Krengle sentences 658 3k
Table 5: Training data for the Haitian Creole-English fea-tured translation task. The in-domain SMS data consists primarily of raw (noisy) SMS data. The in-domain data was provided by Mission 4636. The other data is out-of-domain. It comes courtesy of Carnegie Mellon Univer-sity, Microsoft Research, Haitisurf.com, and Krengle.net.
alongside the SMS data. The WMT organizers re-quested that if they discovered messages with incor-rect or incomplete anonymization, that they notify us and correct the anonymization using the version control repository.
To define the shared translation task, we divided the SMS messages into an in-domain training set, along with designated dev, devtest, and test sets. We coordinated with Microsoft and CMU to make avail-able additional out-of-domain parallel corpora. De-tails of the data are given in Table 5. In addition to this data, participants in the featured task were allowed to use any of the data provided in the stan-dard translation task, as well as linguistic tools such as taggers, parsers, or morphological analyzers.
3.2 Clean and Raw Test Data
We provided two sets of testing and development data. Participants used their systems to translate two test sets consisting of 1,274 unseen Haitian Creole SMS messages. One of the test sets contains the “raw” SMS messages as they were sent, and the other contains messages that were cleaned up by hu-man post-editors. The English side is the same in both cases, and the only difference is the Haitian Creole input sentences.
The post-editors were Haitian Creole language informants hired by Microsoft Research. They
pro-vided a number of corrections to the SMS messages, including expanding SMS shorthands, correcting spelling/grammar/capitalization, restoring diacritics that were left out of the original message, and cleaning up accented characters that were lost when the message was transmitted in the wrong encoding.
Original Haitian Creole messages:
Sil vou pl´e ´ede mwen avek moun ki vik-tim yo nan tranbleman de t´e a,ki kit´e poto-prins ki vini nan provins- mwen ede ak ti kob mwen te ginyin kouni´e a
4636: Manje vin pi che nan PaP apre tran-bleman te-a. mamit diri ap van’n 250gd kounye, sete 200gd avan. Mayi-a 125gd, avan sete 100gd
Edited Haitian Creole messages:
Silvouple ede mwen av`ek moun ki viktim yo nan tranblemannt`e a, ki kite P`otoprens ki vini nan pwovens, mwen ede ak ti k`ob mwen te genyen kounye a
4636: Manje vin pi ch`e nan PaP apre tran-blemannt`e a. Mamit diri ap vann 250gd kounye a, sete 200gd avan. Mayi-a 125gd, avan sete 100gd.
For the test and development sets the informants also edited the English translations. For instance, there were cases where the original crowdsourced translation summarized the content of the message instead of translating it, instances where parts of the source were omitted, and where explanatory notes were added. The editors improved the trans-lations so that they were more suitable for machine translation, making them more literal, correcting disfluencies on the English side, and retranslating them when they were summaries.
Crowdsourced English translation:
We are in the area of Petit Goave, we would like .... we need tents and medi-cation for flu/colds...
Post-edited translation:
it should not be the way I see the Minus-tah guys are handling the people. We need lots of tents and medication for flu/colds, and fever
The edited English is provided as the reference for both the “clean” and the “raw” sets, since we intend that distinction to refer to the form that the source language comes in, rather than the target language.
Tables 47 and 48 in the Appendix show a signifi-cant difference in the translation quality between the clean and the raw test sets. In most cases, systems’
output for the raw condition was 4 BLEU points
lower than for the clean condition. We believe that the difference in performance on the raw vs. cleaned test sets highlight the importance of handling noisy input data.
All of the in-domain training data is in the raw for-mat. The original SMS messages are unaltered, and the translations are just as the volunteered provided them. In some cases, the original SMS messages are written in French or English instead of Haitian Cre-ole, or contain a mixture of languages. It may be possible to further improve the quality of machine translation systems trained from this data by improv-ing the quality of the data itself.
3.3 Goals and Challenges
The goals of the Haitian Creole to English transla-tion task were:
• To focus researchers on the problems presented
by low resource languages
• To provide a real-world data set consisting of
SMS messages, which contain abbreviations, non-standard spelling, omitted diacritics, and other noisy character encodings
• To develop techniques for building translation
systems that will be useful in future crises
There are many challenges in translating noisy data in a low resource language, and there are a vari-ety of strategies that might be considered to attempt to tackle them. For instance:
• Automated cleaning of the raw (noisy) SMS
data in the training set.
• Leveraging a larger French-English model to
translate out of vocabulary Haitian words, by creating a mapping from Haitian words onto French.
• Incorporation of morphological and/or
syntac-tic models to better cope with the low resource language pair.
It is our hope that by introducing this data as a shared challenge at WMT11 that we will establish a useful community resource so that researchers may explore these challenges and publish about them in the future.
4 Human Evaluation
As with past workshops, we placed greater empha-sis on the human evaluation than on the automatic evaluation metric scores. It is our contention that automatic measures are an imperfect substitute for human assessment of translation quality. Therefore, we define the manual evaluation to be primary, and use the human judgments to validate automatic met-rics.
Manual evaluation is time consuming, and it re-quires a large effort to conduct on the scale of our workshop. We distributed the workload across a number of people, including shared-task partici-pants, interested volunteers, and a small number of paid annotators (recruited by the participating sites). More than 130 people participated in the manual evaluation, with 91 people putting in more than an hour’s worth of effort, and 29 putting in more than four hours. There was a collective total of 361 hours of labor.
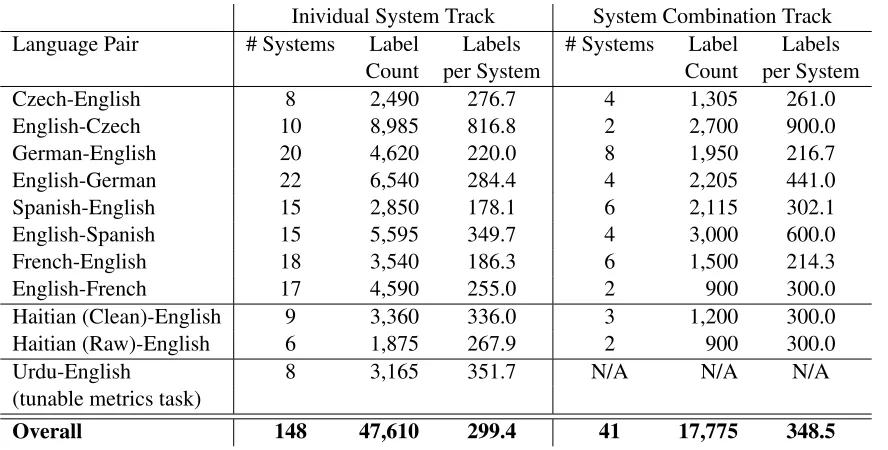
We asked annotators to evaluate system outputs by ranking translated sentences relative to each other. This was our official determinant of trans-lation quality. The total number of judgments col-lected for the different ranking tasks is given in Ta-ble 6.
We performed the manual evaluation of the indi-vidual systems separately from the manual evalua-tion of the system combinaevalua-tion entries, rather than comparing them directly against each other. Last year’s results made it clear that there is a large (ex-pected) gap in performance between the two groups. This year, we opted to reduce the number of pairwise
comparisons with the hope that we would be more likely to find statistically significant differences be-tween the systems in the same groups. To that same end, we also eliminated the editing/acceptability task that was featured in last year’s evaluation, in-stead we had annotators focus solely on the system ranking task.
4.1 Ranking translations of sentences
Ranking translations relative to each other is a rea-sonably intuitive task. We therefore kept the instruc-tions simple:
You are shown a source sentence followed by several candidate translations.
Your task is to rank the translations from best to worst (ties are allowed).
Each screen for this task involved judging trans-lations of three consecutive source segments. For each source segment, the annotator was shown the outputs of five submissions, and asked to rank them. With the exception of a few tasks in the system combination track, there were many more than 5 systems participating in any given task—up to 23 for the English-German individual systems track. Rather than attempting to get a complete ordering over the systems, we instead relied on random se-lection and a reasonably large sample size to make the comparisons fair.
We use the collected rank labels to assign each system a score that reflects how highly that system was usually ranked by the annotators. The score for
some systemAreflects how frequently it was judged
to be better than or equal to other systems.
Specif-ically, each block in whichAappears includes four
implicit pairwise comparisons (against the other
pre-sented systems). Ais rewarded once for each of the
four comparisons in whichAwins or ties. A’s score
is the number of such winning (or tying) pairwise comparisons, divided by the total number of
pair-wise comparisons involvingA.
The system scores are reported in Section 5. Ap-pendix A provides detailed tables that contain pair-wise head-to-head comparisons between pairs of systems.
4.2 Inter- and Intra-annotator agreement in the ranking task
We were interested in determining the inter- and intra-annotator agreement for the ranking task, since a reasonable degree of agreement must exist to sup-port our process as a valid evaluation setup. To en-sure we had enough data to meaen-sure agreement, we purposely designed the sampling of source segments and translations shown to annotators in a way that ensured some items would be repeated, both within the screens completed by an individual annotator, and across screens completed by different annota-tors.
We did so by ensuring that 10% of the generated screens are exact repetitions of previously gener-ated screen within the same batch of screens. Fur-thermore, even within the other 90%, we ensured that a source segment appearing in one screen ap-pears again in two more screens (though with differ-ent system outputs). Those two details, intdiffer-entional repetition of source sentences and intentional repeti-tion of system outputs, ensured we had enough data to compute meaningful inter- and intra-annotator agreement rates.
We measured pairwise agreement among
anno-tators using Cohen’s kappa coefficient (κ) (Cohen,
1960), which is defined as
κ= P(A)−P(E) 1−P(E)
whereP(A)is the proportion of times that the
anno-tators agree, andP(E)is the proportion of time that
they would agree by chance. Note thatκis basically
a normalized version ofP(A), one which takes into
account how meaningful it is for annotators to agree
with each other, by incorporatingP(E). Note also
thatκ has a value of at most1 (and could possibly
be negative), with higher rates of agreement
result-ing in higherκ.
The above definition ofκis actually used by
sev-eral definitions of agreement measures, which differ
in howP(A)andP(E)are computed.
We calculate P(A) by examining all pairs of
systems which had been judged by two or more judges, and calculating the proportion of time that
they agreed that A > B, A = B, orA < B. In
Inividual System Track System Combination Track
Language Pair # Systems Label Labels # Systems Label Labels
Count per System Count per System
Czech-English 8 2,490 276.7 4 1,305 261.0
English-Czech 10 8,985 816.8 2 2,700 900.0
German-English 20 4,620 220.0 8 1,950 216.7
English-German 22 6,540 284.4 4 2,205 441.0
Spanish-English 15 2,850 178.1 6 2,115 302.1
English-Spanish 15 5,595 349.7 4 3,000 600.0
French-English 18 3,540 186.3 6 1,500 214.3
English-French 17 4,590 255.0 2 900 300.0
Haitian (Clean)-English 9 3,360 336.0 3 1,200 300.0
Haitian (Raw)-English 6 1,875 267.9 2 900 300.0
Urdu-English 8 3,165 351.7 N/A N/A N/A
(tunable metrics task)
[image:11.612.88.532.53.278.2]Overall 148 47,610 299.4 41 17,775 348.5
Table 6: A summary of the WMT11 ranking task, showing the number of systems and number of labels collected in each of the individual and system combination tracks. The system count does not include the reference translation, which was included in the evaluation, and so a value under “Labels per System” can be obtained only after adding1
to the system count, before dividing the label count (e.g. in German-English,4,620/21 = 220.0).
which annotators agree, in the context of pairwise
comparisons.P(A)is computed similarly forintra
-annotator agreement (i.e. self-consistency), but over pairwise comparisons that were annotated more than
once by asingleannotator.
As forP(E), it should capture the probability that
two annotators would agree randomly. Therefore:
P(E) =P(A>B)2+P(A=B)2+P(A<B)2
Note that each of the three probabilities inP(E)’s
definition are squared to reflect the fact that we are
considering the chance that two annotators would
agree by chance. Each of these probabilities is com-puted empirically, by observing how often annota-tors actually rank two systems as being tied. We note here that this empirical computation is a depar-ture from previous years’ analyses, where we had assumed that the three categories are equally likely
(yieldingP(E) = 19 +19 +19 = 13). We believe that
this is a more principled approach, which faithfully
reflects the motivation of accounting forP(E)in the
first place.6
6
Even if we wanted to assume a “random clicker” model, setting P(E) = 1
3 is still not entirely correct. Given that
Table 7 gives κ values for inter-annotator and
intra-annotator agreement across the various evalu-ation tasks. These give an indicevalu-ation of how often different judges agree, and how often single judges are consistent for repeated judgments, respectively.
There are some general and expected trends that can be seen in this table. First of all, intra-annotator agreement is higher than inter-annotator agreement. Second, reference translations are noticeably better than other system outputs, which means that anno-tators have an artificially high level of agreement on pairwise comparisons that include a reference trans-lation. For this reason, we also report the agreement levels when such comparisons are excluded.
The exact interpretation of the kappa coefficient is difficult, but according to Landis and Koch (1977),
0−0.2is slight,0.2−0.4is fair,0.4−0.6is
moder-ate,0.6−0.8is substantial, and0.8−1.0is almost
perfect. Based on these interpretations, the agree-ment for sentence-level ranking is moderate to sub-stantial for most tasks.
annotators rank five outputs at once, P(A = B) = 1 5, not 1
3, since there are only five (out of 25) label pairs that satisfy A = B. Working this back intoP(E)’s definition, we have P(A > B) = P(A < B) = 25, and thereforeP(E) = 0.36
rather than0.333.
INTER-ANNOTATOR AGREEMENT(I.E. ACROSS ANNOTATORS)
ALL COMPARISONS NO REF COMPARISONS
P(A) P(E) κ P(A) P(E) κ
European languages, individual systems 0.601 0.362 0.375 0.561 0.355 0.320
European languages, system combinations 0.671 0.335 0.505 0.598 0.342 0.389
Haitian-English, individual systems 0.691 0.362 0.516 0.639 0.350 0.446
Haitian-English, system combinations 0.761 0.358 0.628 0.674 0.335 0.509
Tunable metrics task (Urdu-English) 0.692 0.337 0.535 0.641 0.363 0.437
WMT10 (European languages, all systems) 0.658 0.374 0.454 0.626 0.367 0.409
INTRA-ANNOTATOR AGREEMENT(I.E. SELF-CONSISTENCY)
ALL COMPARISONS NO REF COMPARISONS
P(A) P(E) κ P(A) P(E) κ
European languages, individual systems 0.722 0.362 0.564 0.685 0.355 0.512
European languages, system combinations 0.787 0.335 0.680 0.717 0.342 0.571
Haitian-English, individual systems 0.763 0.362 0.628 0.700 0.350 0.539
Haitian-English, system combinations 0.882 0.358 0.816 0.784 0.335 0.675
Tunable metrics task (Urdu-English) 0.857 0.337 0.784 0.856 0.363 0.774
WMT10 (European languages, all systems) 0.755 0.374 0.609 0.734 0.367 0.580
Table 7: Inter- and intra-annotator agreement rates, for the various manual evaluation tracks of WMT11. See Tables 49 and 50 below for a detailed breakdown by language pair.
However, one result that is of concern is that agreement rates are noticeably lower for European language pairs, in particular for the individual sys-tems track. When excluding reference comparisons, the inter- and intra-annotator agreement levels are
0.320and 0.512, respectively. Not only are those numbers lower than for the other tasks, but they are also lower than last year’s numbers, which were
0.409and0.580.
We investigated this result a bit deeper. Tables 49 and 50 in the Appendix break down the results fur-ther, by reporting agreement levels for each lan-guage pair. One observation is that the agreement level for some language pairs deviates in a non-trivial amount from the overall agreement rate.
Let us focus on inter-annotator agreement rates in the individual track (excluding reference compar-isons), in the top right portion of Table 49. The over-allκis0.320, but it ranges from0.264for
German-English, to0.477for Spanish-English.
What distinguishes those two language pairs from each other? If we examine the results in Table 8, we see that Spanish-English had two very weak sys-tems, which were likely easy for annotators to agree
on comparisons involving them. (This is the con-verse of annotators agreeing more often on com-parisons involving the reference.) English-French is similar in that regard, and it too has a relatively high agreement rate.
On the other hand, the participants in German-English formed a large pool of more closely-matched systems, where the gap separating the bot-tom system is not as pronounced. So it seems that the low agreement rates are indicative of a more competitive evaluation and more closely-matched systems.
5 Results of the Translation Tasks
We used the results of the manual evaluation to an-alyze the translation quality of the different systems that were submitted to the workshop. In our analy-sis, we aimed to address the following questions:
• Which systems produced the best translation
quality for each language pair?
• Which of the systems that used only the
Czech-English
1023–1166 comparisons/system System C? ≥others UEDIN•? Y 0.69 ONLINE-B• N 0.68 CU-BOJAR N 0.60
JHU N 0.57
UPPSALA Y 0.57 SYSTRAN N 0.51
CST Y 0.47
CU-ZEMAN Y 0.44
Spanish-English
583–833 comparisons/system System C? ≥others ONLINE-B• N 0.72 ONLINE-A• N 0.72
KOC? Y 0.67
SYSTRAN• N 0.66 ALACANT• N 0.66 RBMT-1 N 0.63 RBMT-3 N 0.61 RBMT-2 N 0.60 RBMT-4 N 0.60 RBMT-5 N 0.51
UEDIN Y 0.51
UPM Y 0.50
UFAL-UM Y 0.47 HYDERABAD Y 0.17 CU-ZEMAN Y 0.16
French-English
608–883 comparisons/system
System C? ≥others
ONLINE-A• N 0.66 LIMSI•? Y+G 0.66 ONLINE-B• N 0.66
LIA-LIG Y 0.64
KIT•? Y+G 0.64
LIUM Y+G 0.63
CMU-DENKOWSKI? Y 0.62
JHU Y+G 0.61
RWTH-HUCK Y+G 0.58
RBMT-1• N 0.58
CMU-HANNEMAN Y+G 0.58
RBMT-3 N 0.55
SYSTRAN N 0.54
RBMT-4 N 0.53
RBMT-2 N 0.52
UEDIN Y 0.50
RBMT-5 N 0.45
CU-ZEMAN Y 0.37
English-Czech
3126–3397 comparisons/system
System C? ≥others
ONLINE-B• N 0.65 CU-BOJAR N 0.64 CU-MARECEK• N 0.63 CU-TAMCHYNA N 0.62
UEDIN? Y 0.59
CU-POPEL? Y 0.58 COMMERCIAL2 N 0.51 COMMERCIAL1 N 0.51
JHU N 0.49
CU-ZEMAN Y 0.43
English-Spanish
1300–1480 comparisons/system System C? ≥others ONLINE-B• N 0.74 ONLINE-A• N 0.72 RBMT-3• N 0.71 PROMT• N 0.70 CEU-UPV? Y 0.65 UEDIN? Y 0.64 UPPSALA? Y 0.61 RBMT-4 N 0.61 RBMT-1 N 0.60
UOW Y 0.59
RBMT-2 N 0.57
KOC Y 0.56
RBMT-5 N 0.54 CU-ZEMAN Y 0.49
UPM Y 0.34
English-French
868–1121 comparisons/system
System C? ≥others
LIMSI•? Y+G 0.73 ONLINE-B• N 0.70 KIT•? Y+G 0.69 RWTH-HUCK Y+G 0.65
LIUM Y+G 0.64
RBMT-1 N 0.61
ONLINE-A N 0.60
UEDIN Y 0.58
RBMT-3 N 0.58
RBMT-5 N 0.55
UPPSALA Y 0.55
JHU Y 0.55
UPPSALA-FBK Y 0.54
RBMT-4 N 0.49
RBMT-2 N 0.46
LATL-GENEVA N 0.39 CU-ZEMAN Y 0.20
German-English
741–998 comparisons/system
System C? ≥others
ONLINE-B• N 0.72 CMU-DYER•? Y+G 0.66 ONLINE-A• N 0.66
RBMT-3 N 0.64
LINGUATEC N 0.63
RBMT-4 N 0.61
RBMT-1 N 0.60
DFKI-XU N 0.60
RWTH-WUEBKER? Y+G 0.59
KIT Y+G 0.57
LIU Y 0.57
LIMSI Y+G 0.56
RBMT-5 N 0.56
UEDIN Y 0.55
RBMT-2 N 0.54
CU-ZEMAN Y 0.47
UPPSALA Y 0.47
KOC Y 0.45
JHU Y+G 0.43
CST Y 0.37
English-German
1051–1230 comparisons/system
System C? ≥others
RBMT-3• N 0.73
ONLINE-B• N 0.73
RBMT-1• N 0.70
DFKI-FEDERMANN• N 0.68
DFKI-XU N 0.67
RBMT-4• N 0.66
RBMT-2• N 0.66
ONLINE-A• N 0.65
LIMSI? Y+G 0.65
KIT? Y 0.64
UEDIN Y 0.60
LIU Y 0.59
RBMT-5 N 0.58
RWTH-FREITAG Y 0.56 COPENHAGEN? Y 0.56
JHU Y 0.54
KOC Y 0.53
UOW Y 0.53
CU-TAMCHYNA Y 0.50
UPPSALA Y 0.49
ILLC-UVA Y 0.48
CU-ZEMAN Y 0.38
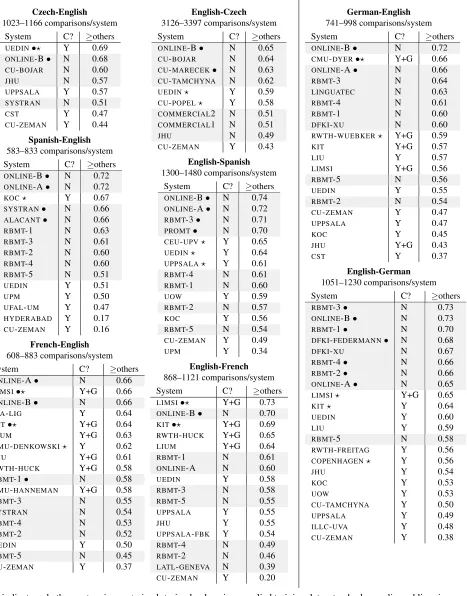
C? indicates whether system is constrained: trained only using supplied training data, standard monolingual linguis-tic tools, and, optionally, LDC’s English Gigaword. Eentries that used the Gigaword are marked with +G.
• indicates awin: no other system is statistically significantly better at p-level≤0.10 in pairwise comparison. ? indicates aconstrainedwin: no otherconstrainedsystem is statistically better.
Table 8: Official results for the WMT11 translation task. Systems are ordered by their≥others score, reflecting how often their translations won or tied pairwise comparisons. For detailed head-to-head comparisons, see Appendix A.
[image:13.612.92.559.60.656.2]Czech-English
1036–1042 comparisons/combo
System ≥others
CMU-HEAFIELD-COMBO• 0.64
BBN-COMBO• 0.62
JHU-COMBO 0.58
UPV-PRHLT-COMBO 0.47
English-Czech
1788–1792 comparisons/combo
System ≥others
CMU-HEAFIELD-COMBO• 0.48
UPV-PRHLT-COMBO 0.41
German-English
811–927 comparisons/combo
System ≥others
CMU-HEAFIELD-COMBO• 0.70
RWTH-LEUSCH-COMBO 0.65
BBN-COMBO 0.61
UZH-COMBO• 0.60
JHU-COMBO 0.56
UPV-PRHLT-COMBO 0.52
QUAERO-COMBO 0.46
KOC-COMBO 0.45
English-German
1746–1752 comparisons/combo
System ≥others
CMU-HEAFIELD-COMBO• 0.61
UZH-COMBO• 0.58
UPV-PRHLT-COMBO 0.56
KOC-COMBO 0.46
Spanish-English
1132–1249 comparisons/combo
System ≥others
RWTH-LEUSCH-COMBO• 0.71
CMU-HEAFIELD-COMBO• 0.67
BBN-COMBO• 0.64
UPV-PRHLT-COMBO 0.64
JHU-COMBO 0.62
KOC-COMBO 0.56
English-Spanish
2360–2378 comparisons/combo
System ≥others
CMU-HEAFIELD-COMBO• 0.69
UOW-COMBO 0.63
UPV-PRHLT-COMBO 0.59
KOC-COMBO 0.58
French-English
820–916 comparisons/combo
System ≥others
BBN-COMBO• 0.67
RWTH-LEUSCH-COMBO• 0.63
CMU-HEAFIELD-COMBO 0.62
JHU-COMBO• 0.59
LIUM-COMBO 0.53
UPV-PRHLT-COMBO 0.53
English-French
586–587 comparisons/combo
System ≥others
CMU-HEAFIELD-COMBO• 0.51
UPV-PRHLT-COMBO 0.43
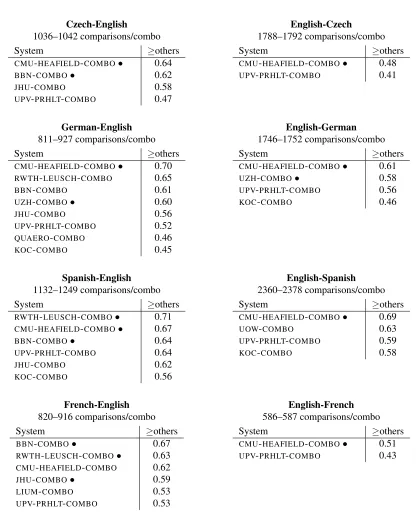
• indicates a win: no other system combination is statistically significantly better at p-level≤0.10 in pairwise comparison.
[image:14.612.97.515.73.588.2]Haitian Creole (Clean)-English
(individual systems) 1256–1435 comparisons/system
System ≥others
BM-I2R• 0.71
CMU-DENKOWSKI 0.66
CMU-HEWAVITHARANA 0.64
UMD-EIDELMAN 0.63
UPPSALA 0.57
LIU 0.55
UMD-HU 0.52
HYDERABAD 0.43
KOC 0.31
Haitian Creole (Raw)-English
(individual systems) 1065–1136 comparisons/system
System ≥others
BM-I2R• 0.65
CMU-HEWAVITHARANA 0.60
CMU-DENKOWSKI 0.59
LIU 0.55
UMD-EIDELMAN 0.52
JHU 0.41
Haitian Creole (Clean)-English
(system combinations) 896–898 comparisons/combo
System ≥others
CMU-HEAFIELD-COMBO• 0.52
UPV-PRHLT-COMBO 0.48
KOC-COMBO 0.38
Haitian Creole (Raw)-English
(system combinations) 600–600 comparisons/combo
System ≥others
CMU-HEAFIELD-COMBO 0.47
UPV-PRHLT-COMBO 0.43
[image:15.612.103.504.188.485.2]• indicates awin: no other system is statistically significantly better at p-level≤0.10 in pairwise comparison.
Table 10: Official results for the WMT11 featured translation task (Haitian Creole SMS into English). Systems are ordered by their≥others score, reflecting how often their translations won or tied pairwise comparisons. For detailed head-to-head comparisons, see Appendix A.
Tables 8–10 show the system ranking for each
of the translation tasks. For each language pair,
we define a system as ‘winning’ if no other system was found statistically significantly better (using the
Sign Test, atp≤0.10). In some cases, multiple
sys-tems are listed as winners, either due to a large num-ber of participants or a low numnum-ber of judgments per system pair, both of which are factors that make it difficult to achieve statistical significance.
We start by examining the results for the individ-ual system track for the European languages
(Ta-ble 8). In Spanish↔English and German↔English,
unconstrained systems are observed to perform
bet-ter than constrained systems. In other language
pairs, particularly French↔English, constrained
systems are found to be able to be on the same level or outperform unconstrained systems. It also seems that making use of the Gigaword corpora is likely to yield better systems, even when translating out of English, as in English-French and English-German. For English-German the rule-based MT systems per-formed well.
Of the participating teams, there is no individ-ual system clearly outperforming all other systems across the different language pairs. However, one
of the crawled systems, ONLINE-B, performs
con-sistently well, being one of the winners in all eight language pairs.
As for the system combination track (Table 9), theCMU-HEAFIELD-COMBOentry performed quite well, being a winner in seven out of eight language pairs. This performance is carried over to the Haitian Creole task, where it again comes out on top
(Ta-ble 10). In theindividualtrack of the Haitian Creole
task, BM-I2Ris the sole winner in both the ‘clean’
and ‘raw’ tracks.
6 Evaluation Task
In addition to allowing us to analyze the translation quality of different systems, the data gathered during the manual evaluation is useful for validating auto-matic evaluation metrics. Our evaluation shared task is similar to the MetricsMATR workshop (Metrics for MAchine TRanslation) that NIST runs (Przy-bocki et al., 2008; Callison-Burch et al., 2010). Ta-ble 11 lists the participants in this task, along with their metrics.
A total of 21 metrics and their variants were sub-mitted to the evaluation task by 9 research groups. We asked metrics developers to score the outputs of the machine translation systems and system com-binations at the system-level and at the segment-level. The system-level metrics scores are given in the Appendix in Tables 39–48. The main goal of the evaluation shared task is not to score the systems, but instead to validate the use of automatic metrics by measuring how strongly they correlate with hu-man judgments. We used the huhu-man judgments col-lected during the manual evaluation for the transla-tion task and the system combinatransla-tion task to calcu-late how well metrics correcalcu-late at system-level and at the segment-level.
This year the strongest metric was a new metric developed by Columbia and ETS called MTeRater-Plus. MTeRater-Plus is a machine-learning-based metric that use features from ETS’s e-rater, an auto-mated essay scoring engine designed to assess writ-ing proficiency (Attali and Burstein, 2006). The fea-tures include sentence-level and document-level in-formation. Some examples of the e-rater features include:
• Preposition features that calculate the
proba-bility of prepositions appearing in the given context of a sentence (Tetreault and Chodorow, 2008)
• Collocation features that indicate whether the
collocations in the document are typical of na-tive use (Futagi et al., 2008).
• A sentence fragment feature that counts the
number of ill-formed sentences in a document.
• A feature that counts the number of words with
inflection errors
• A feature that counts the the number of article
errors in the sentence citeHan2006.
MTeRater uses only the e-rater features, and mea-sures fluency without any need for reference transla-tions. MTeRater-Plus is a meta-metric that incorpo-rates adequacy by combining MTeRater with other MT evaluation metrics and heuristics that take the reference translations into account.
Metric IDs Participant
AMBER,AMBER-NL,AMBER-IT National Research Council Canada (Chen and Kuhn, 2011)
F15, F15G3 Koc¸ University (Bicici and Yuret, 2011)
METEOR-1.3-ADQ,METEOR-1.3-RANK Carnegie Mellon University (Denkowski and Lavie, 2011a)
MTERATER, MTERATER-PLUS Columbia / ETS (Parton et al., 2011)
MP4IBM1,MPF,WMPF DFKI (Popovi´c, 2011; Popovi´c et al., 2011)
PARSECONF DFKI (Avramidis et al., 2011)
ROSE,ROSE-POS The University of Sheffield (Song and Cohn, 2011)
TESLA-B,TESLA-F,TESLA-M National University of Singapore (Dahlmeier et al., 2011)
TINE University of Wolverhampton (Rios et al., 2011)
BLEU provided baseline (Papineni et al., 2002)
[image:17.612.71.299.296.581.2]TER provided baseline (Snover et al., 2006)
Table 11: Participants in the evaluation shared task. For comparison purposes, we include the BLEU and TER metrics as baselines.
E
N
-C
Z
-1
0
S
Y
S
T
E
M
S
E
N
-D
E
-2
2
S
Y
S
T
E
M
S
E
N
-E
S
-1
5
S
Y
S
T
E
M
S
E
N
-F
R
-1
7
S
Y
S
T
E
M
S
A
V
E
R
A
G
E
A
V
E
R
A
G
E
W
/
O
C
Z
System-level correlation for translation out of English
TESLA-M .90 .95 .96 .94
TESLA-B .81 .90 .91 .87
MPF .72 .63 .87 .89 .78 .80
WMPF .72 .61 .87 .89 .77 .79
MP4IBM1 -.76 -.91 -.71 -.61 .75 .74 ROSE .65 .41 .90 .86 .71 .73 BLEU .65 .44 .87 .86 .70 .72 AMBER-TI .56 .54 .88 .84 .70 .75 AMBER .56 .53 .87 .84 .70 .74 AMBER-NL .56 .45 .88 .83 .68 .72 F15G3 .50 .30 .89 .84 .63 .68
METEORrank .65 .30 .74 .85 .63 .63
F15 .52 .19 .86 .85 .60 .63 TER -.50 -.12 -.81 -.84 .57 .59
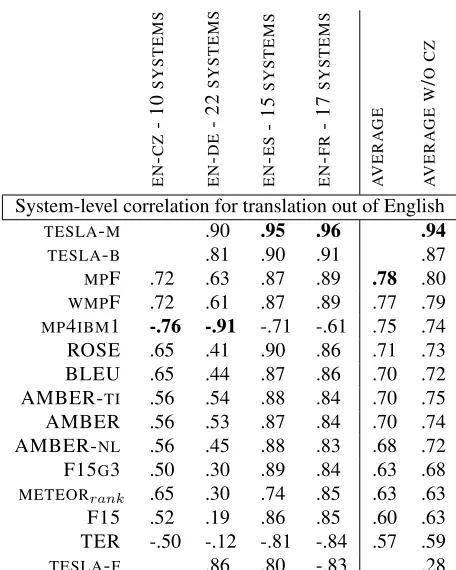
TESLA-F .86 .80 -.83 .28
Table 12: System-level Spearman’s rho correlation of the automatic evaluation metrics with the human judgments for translation out of English, ordered by average abso-lute value. We did not calculate correlations with the hu-man judgments for the system combinations for the out of English direction, because none of them had more than4
items.
6.1 System-Level Metric Analysis
We measured the correlation of the automatic met-rics with the human judgments of translation quality at the system-level using Spearman’s rank
correla-tion coefficientρ. We converted the raw scores
as-signed to each system into ranks. We asas-signed a hu-man ranking to the systems based on the percent of time that their translations were judged to be better than or equal to the translations of any other system in the manual evaluation. The reference was not in-cluded as an extra translation.
When there are no ties,ρcan be calculated using
the simplified equation:
ρ= 1− 6
P
d2i n(n2−1)
where di is the difference between the rank for
systemi andnis the number of systems. The
pos-sible values ofρrange between1(where all systems
are ranked in the same order) and−1(where the
sys-tems are ranked in the reverse order). Thus an auto-matic evaluation metric with a higher absolute value
forρis making predictions that are more similar to
the human judgments than an automatic evaluation
metric with a lower absoluteρ.
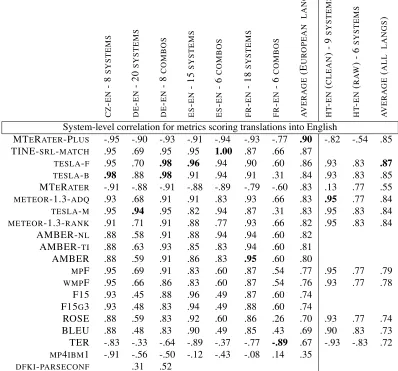
The system-level correlations are shown in Ta-ble 13 for translations into English, and TaTa-ble 12 out of English, sorted by average correlation across
the language pairs. The highest correlation for
each language pair and the highest overall average
are bolded. This year, nearly all of the metrics
C Z -E N -8 S Y S T E M S D E -E N -2 0 S Y S T E M S D E -E N -8 C O M B O S E S -E N -1 5 S Y S T E M S E S -E N -6 C O M B O S F R -E N -1 8 S Y S T E M S F R -E N -6 C O M B O S A V E R A G E (E U R O P E A N L A N G S ) H T -E N ( C L E A N ) -9 S Y S T E M S H T -E N ( R A W ) -6 S Y S T E M S A V E R A G E ( A L L L A N G S )
System-level correlation for metrics scoring translations into English
MTERATER-PLUS -.95 -.90 -.93 -.91 -.94 -.93 -.77 .90 -.82 -.54 .85 TINE-SRL-MATCH .95 .69 .95 .95 1.00 .87 .66 .87
TESLA-F .95 .70 .98 .96 .94 .90 .60 .86 .93 .83 .87 TESLA-B .98 .88 .98 .91 .94 .91 .31 .84 .93 .83 .85 MTERATER -.91 -.88 -.91 -.88 -.89 -.79 -.60 .83 .13 .77 .55
METEOR-1.3-ADQ .93 .68 .91 .91 .83 .93 .66 .83 .95 .77 .84
TESLA-M .95 .94 .95 .82 .94 .87 .31 .83 .95 .83 .84
METEOR-1.3-RANK .91 .71 .91 .88 .77 .93 .66 .82 .95 .83 .84
AMBER-NL .88 .58 .91 .88 .94 .94 .60 .82 AMBER-TI .88 .63 .93 .85 .83 .94 .60 .81 AMBER .88 .59 .91 .86 .83 .95 .60 .80
MPF .95 .69 .91 .83 .60 .87 .54 .77 .95 .77 .79
WMPF .95 .66 .86 .83 .60 .87 .54 .76 .93 .77 .78 F15 .93 .45 .88 .96 .49 .87 .60 .74
F15G3 .93 .48 .83 .94 .49 .88 .60 .74
ROSE .88 .59 .83 .92 .60 .86 .26 .70 .93 .77 .74 BLEU .88 .48 .83 .90 .49 .85 .43 .69 .90 .83 .73 TER -.83 -.33 -.64 -.89 -.37 -.77 -.89 .67 -.93 -.83 .72
MP4IBM1 -.91 -.56 -.50 -.12 -.43 -.08 .14 .35
[image:18.612.106.504.169.540.2]DFKI-PARSECONF .31 .52
F R -E N (6 3 3 7 P A IR S ) D E -E N (8 9 5 0 P A IR S ) E S -E N (5 9 7 4 P A IR S ) C Z -E N (3 6 9 5 P A IR S ) A V E R A G E
Segment-level correlation for translations into English MTERATER-PLUS .30 .36 .45 .36 .37
TESLA-F .28 .24 .39 .32 .31
TESLA-B .28 .26 .36 .29 .30
METEOR-1.3-RANK .23 .25 .38 .28 .29
METEOR-1.3-ADQ .24 .25 .37 .27 .28
MPF .25 .23 .34 .28 .28 AMBER-TI .24 .26 .33 .27 .28 AMBER .24 .25 .33 .27 .27
WMPF .24 .23 .34 .26 .27 AMBER-NL .24 .24 .30 .27 .26 MTERATER .19 .26 .33 .24 .26
TESLA-M .21 .23 .29 .23 .24 TINE-SRL-MATCH .20 .19 .30 .24 .23 F15G3 .17 .15 .29 .21 .21 F15 .16 .14 .27 .22 .20
MP4IBM1 .15 .16 .18 .12 .15
[image:19.612.73.302.56.361.2]DFKI-PARSECONF n/a .24 n/a n/a
Table 14: Segment-level Kendall’s tau correlation of the automatic evaluation metrics with the human judgments for translation into English, ordered by average correla-tion.
had stronger correlation with human judgments than
BLEU. The metrics that had the strongest correlation
this year included two metrics, MTeRater and TINE, as well as metrics that have demonstrated strong cor-relation in previous years like TESLA and Meteor.
6.2 Segment-Level Metric Analysis
We measured the metrics’ segment-level scores with the human rankings using Kendall’s tau rank corre-lation coefficient. The reference was not included as an extra translation.
We calculated Kendall’s tau as:
τ = num concordant pairs - num discordant pairs
total pairs
where a concordant pair is a pair of two translations of the same segment in which the ranks calculated from the same human ranking task and from the cor-responding metric scores agree; in a discordant pair, they disagree. In order to account for accuracy- vs.
E N -F R (6 9 3 4 P A IR S ) E N -D E (1 0 7 3 2 P A IR S ) E N -E S (8 8 3 7 P A IR S ) E N -C Z (1 1 6 5 1 P A IR S ) A V E R A G E
Segment-level correlation for translations out of English AMBER-TI .32 .22 .31 .21 .27
AMBER .31 .21 .31 .22 .26
MPF .31 .22 .30 .20 .26
WMPF .31 .22 .29 .19 .25 AMBER-NL .30 .19 .29 .20 .25
METEOR-1.3-RANK .31 .14 .26 .19 .23 F15G3 .26 .08 .22 .13 .17 F15 .26 .07 .22 .12 .17
MP4IBM1 .21 .13 .13 .06 .13
TESLA-B .29 .20 .28 n/a
TESLA-M .25 .18 .27 n/a
[image:19.612.313.550.58.305.2]TESLA-F .30 .19 .26 n/a
Table 15: Segment-level Kendall’s tau correlation of the automatic evaluation metrics with the human judgments for translation out of English, ordered by average corre-lation.
error-based metrics correctly, counts of concordant vs. discordant pairs were calculated specific to these
two metric types. The possible values of τ range
between1 (where all pairs are concordant) and−1
(where all pairs are discordant). Thus an automatic
evaluation metric with a higher value forτ is
mak-ing predictions that are more similar to the human judgments than an automatic evaluation metric with
a lowerτ.
We did not include cases where the human rank-ing was tied for two systems. As the metrics produce absolute scores, compared to five relative ranks in the human assessment, it would be potentially un-fair to the metric to count a slightly different met-ric score as discordant with a tie in the relative hu-man rankings. A tie in automatic metric rank for two translations was counted as discordant with two corresponding non-tied human judgments.
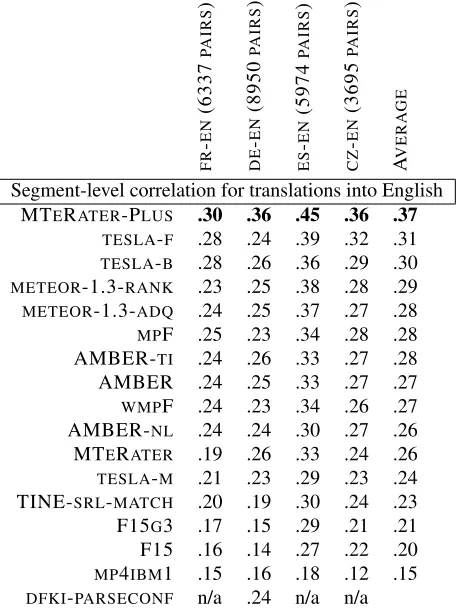
The correlations are shown in Table 14 for trans-lations into English, and Table 15 out of English, sorted by average correlation across the four guage pairs. The highest correlation for each lan-guage pair and the highest overall average are
ID Participant Metric Name
CMU-METEOR Carnegie Mellon University METEOR (Denkowski and Lavie, 2011a)
CU-SEMPOS-BLEU Charles University SemPOS/BLEU (Mach´aˇcek and Bojar, 2011)
NUS-TESLA-F National University of Singapore TESLA-F (Dahlmeier et al., 2011)
RWTH-CDER RWTH Aachen CDER (Leusch and Ney, 2009)
SHEFFIELD-ROSE The University of Sheffield ROSE (single reference) (Song and Cohn, 2011)
STANFORD-DCP Stanford DCP (based on Liu and Gildea (2005))
BLEU provided baseline BLEU
BLEU-SINGLE provided baseline BLEU (single reference)
Table 16: Participants in the tunable-metric shared task. For comparison purposes, we included two BLEU-optimized systems in the evaluation as baselines.
bolded. There is a clear winner for the metrics that score translations into English: the MTeRater-Plus metric (Parton et al., 2011) has the highest segment level correlation across the board. For metrics that score translation into other languages, there is not
such a clear-cut winner. TheAMBERmetric variants
do well, as doMPF andWMPF.
7 Tunable Metrics Task
This year we introduced a new shared task that fo-cuses on using evaluation metrics to tune the param-eters of a statistical machine translation system. The intent of this task was to get researchers who de-velop automatic evaluation metrics for MT to work on the problem of using their metric to optimize the parameters of MT systems. Previous workshops have demonstrated that a number of metrics perform
better than BLEU in terms of having stronger
cor-relation with human judgments about the rankings of multiple machine translation systems. However, most MT system developers still optimize the
pa-rameters of their systems to BLEU. Here we aim
to investigate the question of whether better metrics will result in better quality output when a system is optimized to them.
Because this was the first year that we ran the tunable metrics task, participation was limited to a few groups on an invitation-only basis. Table 16 lists the participants in this task. Metrics developers were invited to integrate their evaluation metric into a MERT optimization routine, which was then used to tune the parameters of a fixed statistical machine translation system. We evaluated whether the sys-tem tuned on their metrics produced higher-quality
output than the baseline system that was tuned to
BLEU, as is typically done. In order to evaluate
whether the quality was better, we conducted a man-ual evaluation, in the same fashion that we evalu-ate the different MT systems submitted to the shared translation task.
We provide the participants with a fixed MT sys-tem for Urdu-English, along with a small parallel set to be used for tuning. Specifically, we provide developers with the following components:
• Decoder- the Joshua decoder was used in this pilot.
• Decoder configuration file- a Joshua configu-ration file that ensures all systems use the same search parameters.
• Translation model- an Urdu-to-English trans-lation model, with syntax-based SCFG rules (Baker et al., 2010).
• Language model - a large 5-gram language model trained on the English Gigaword corpus
• Development set - a development set, with 4 English reference sets, to be used to optimize the system parameters.
• Test set- a test set consisting of 883 Urdu sen-tences, to be translated by the tuned system (no references provided).
Tunable Metrics Task
1324–1484 comparisons/system System ≥others >others
BLEU• 0.79 0.28
BLEU-SINGLE• 0.77 0.27
CMU-METEOR• 0.76 0.27
RWTH-CDER 0.76 0.26
CU-SEMPOS-BLEU• 0.74 0.29
STANFORD-DCP• 0.73 0.27
NUS-TESLA-F 0.68 0.28
SHEFFIELD-ROSE 0.05 0.00
• indicates awin: no other system combination is sta-tistically significantly better at p-level≤0.10 in pair-wise comparison.
Table 17: Official results for the WMT11 tunable-metric task. Systems are ordered by their ≥others score, re-flecting how often their translations won or tied pairwise comparisons. The>column reflects how often a system strictly won a pairwise comparison.
We provided the metrics developers with Omar Zaidan’s Z-MERT software (Zaidan, 2009), which implements Och (2003)’s minimum error rate train-ing procedure. Z-MERT is designed to be modular with respect to the objective function, and allows
BLEU to be easily replaced with other automatic
evaluation metrics. Metric developers incorporated their metrics into Z-MERT by subclassing the Eval-uationMetric.java abstract class. They ran Z-MERT on the dev set with the provided decoder/models, and created a weight vector for the system param-eters.
Each team produced a distinct final weight vec-tor, which was used to produce English translations of sentences in the test set. The different transla-tions produced by tuning the system to different met-rics were then evaluated using the manual evaluation
pipeline.7
7.1 Results of the Tunable Metrics Task
The results of the evaluation are in Table 18. The scores show that the entries were quite close to each
other, with the notable exception of theSHEFFIELD
-ROSE-tuned system, which produced overly-long
7
We also recased and detokenized each system’s output, to ensure the outputs are more readable and easier to evaluate.
R
E
F
B
L
E
U
B
L
E
U
-S
IN
G
L
E
C
M
U
-M
E
T
E
O
R
C
U
-S
E
M
P
O
S
-B
L
E
U
N
U
S
-T
E
S
L
A
-F
R
W
T
H
-C
D
E
R
S
H
E
FFI
E
L
D
-R
O
S
E
S
T
A
N
F
O
R
D
-D
C
P
REF – .15‡ .11‡ .13‡ .09‡ .09‡ .10‡ .00‡ .11‡ BLEU .78‡ – .15 .11 .20 .19† .13?.01‡ .14 BLEU-SINGLE .82‡ .20 – .11 .16 .21 .11 .00‡ .20
CMU-METEOR .84‡ .09 .15 – .21 .20 .19 .00‡ .19 CU-SEMPOS-BLEU .82‡ .23 .21 .21 – .12‡ .18 .00‡ .21 NUS-TESLA-F .80‡ .32† .31 .28 .28‡ – .31 .00‡ .28 RWTH-CDER .79‡ .22?.16 .16 .22 .23 – .00‡ .15 SHEFFIELD-ROSE .98‡ .93‡ .93‡ .96‡ .95‡ .95‡ .93‡ – .94‡
STANFORD-DCP .82‡ .17 .18 .26 .27 .28 .15 .00‡ – >others .83 .28 .27 .27 .29 .28 .26 .00 .27 >=others .90 .79 .77 .76 .74 .68 .76 .05 .73
Table 18: Head to head comparisons for the tunable met-rics task. The numbers indicate how often the system in the column was judged to be better than the system in the row. The difference between 100 and the sum of the corresponding cells is the percent of time that the two systems were judged to be equal.
and erroneous output (possibly due to an implemen-tation issue). This is also evident from the fact that
38% of pairwise comparisons indicated a tie
be-tween the two systems, with the tie rate increasing to a full 47% when excluding comparisons involving the reference. This is a very high tie rate – the cor-responding figure in, say, European language pairs (individual systems) is only 21%.
What makes the different entries appear even more closely-matched is that the ranking changes significantly when ordering systems by their
>others score rather than the ≥others score (i.e.
when rewarding only wins, and not rewarding ties).
NUS-TESLA-Fgoes from being a bottom entry to
be-ing a top entry, with CU-SEMPOS-BLEUalso
bene-fiting, changing from the middle to the top rank.
Either way, we see that a BLEU -tuned system
is performing just as well as systems tuned to the other metrics. This might be an indication that some work remains to be done before a move away from
BLEU-tuning is fully justified. On the other hand,
the close results might be an artifact of the language pair choice. Urdu-English translation is still a rel-atively difficult problem, and MT outputs are still of a relatively low quality. It might be the case that human annotators are simply not very good at