THE SCIENCE
BUDGET 2008/2009
FORFÁS SCIENCE BUDGET 2008/2009
Table of Contents
Introduction 3
Executive Summary 4
Chapter 1: Science and Technology Budget 9
1.1 Total Science Budget 9
1.2 Trends in State S&T expenditure 10
1.3 Trends in categories of State S&T expenditure 11 1.4 S&T intensity (spending relative to economic activity) 12
Chapter 2: Focus on State funding of research and development 13
2.1 Types of R&D indicators 13
2.2 Government budget spending on R&D 14
2.3 Detailed government department spending on R&D 15
2.4 Programmes classified by area of research 18
2.5 GBAORD as a percentage of GNP and international comparisons 19
Chapter 3: Performance of research and development in the public sector 22 3.1 Total expenditure on R&D performed in the government sector 22
3.2 Types of research 25
3.3 Fields of science 26
Chapter 4: Human resources dedicated to publicly-performed research and development 27
4.1 R&D personnel 27
4.2 Gender and qualifications of State sector research staff 28
4.3 R&D staff by fields of science 29
Appendix 1 - Methodology 31
Appendix 2 - Government departments and agencies included in the 2008 Science Budget 32 Appendix 3 - Definitions of R&D and S&T activities 33
Appendix 4 - Acronyms 34
Appendix 5 - International tables 35
Appendix 6 - Questionnaire 37
List of Charts
Figure 1: Total Science Budget (2009) 9
Figure 2: Total science and technology spending by the State sector, (1999-2009 current and
constant prices) 10
Figure 3: Annual percentage change in total S&T spending by the State sector, 1999-2009
(current and constant prices €bn.) 10
Figure 4: Total S&T spending by activity (2002-2009) €m. current prices 11 Figure 5: Share of S&T spending by category as a percentage of total (2009) 11 Figure 6: Annual growth rates of science and technology spending and nominal GNP (1999-2009 12 Figure 7: Total science and technology expenditure as a % of GNP (1999-2009) 12
Figure 8: R&D funding and performance system 13
Figure 9: GBAORD trend in current prices, €m. (1999-2009) 14 Figure 10: GBAORD trend (€m.) and GBAORD as a percentage of GNP (1999-2009) 19 Figure 11: International comparison of civil GBAORD as a percentage of GDP/GNP (2008) 21
Figure 12: Average annual growth rate of civil GBAORD for selected countries (2003-2008) 21
Figure 13: GOVERD as a percentage of GNP and GOVERD trend (1999-2009) 22 Figure 14: Major State research and development performers (2009) 23 Figure 15 Total research and development personnel by occupation in headcount terms
(2007-2009) 27
Figure 16: Total R&D personnel by occupation in FTEs (2009) 28 Figure 17: FTE Researchers by gender and qualification (2009) 28 Figure 18: Researchers classified by gender and field of science FTE (2009) 30
List of Tables
Table 1: Government departments and agencies funding R&D activities (2009) 15
Table 2: GBAORD classifications for Ireland (2009) 18
Table 3: Civil GABORD (1999 and 2009) as a percentage of economic activity (GDP/GNP) 20 Table 4: GOVERD as a percentage of GDP (2004 and 2009 or latest available data) 23
Table 5: GOVERD by type of research (2009) 25
Table 6: Field of science classified by type of research, (2009) 26 Table 7: Total male/female (FTE) and as % of total by field of science (2009) 29
Appendix Tables
FORFÁS SCIENCE BUDGET 2008/2009
Introduction
The Science Budget survey monitors the funding and performance of State Science & Technology (S&T) and Research & Development (R&D) under mandate through government legislation. The survey is carried out each year and aims to capture key performance metrics within the State sector. 39 government
departments and agencies who are engaged in some form of S&T activity are surveyed. This report presents findings from the 2009 Science Budget survey with final outturn data for 2008 and estimates for 2009. The metrics analysed in the report include;
overall S&T spending
Government Budget Appropriations and Outlays on Research and Development (GBAORD),
Government Expenditure on Research and Development (GOVERD) and
R&D human resource indicators for the government sector.
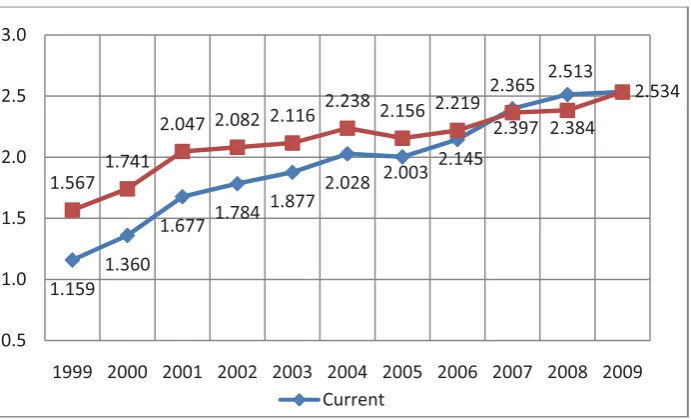
Estimated S&T expenditure figures for 2009 on science and technology by the Irish government sector show a spend of €2.534 billion, a rise of 0.8% in current prices from the outturn figure of €2.513 billion for 2008. The period 2000-2007 has seen strong performance growth in the rate of S&T expenditure by the State sector. However, since 2008 there has been a rapid slowdown in overall growth driven by cuts in
individual programmes. This can be seen in the GBAORD outturn figure for 2008 which shows a -8.06% drop in expenditure from the 2008 allocation of €1.03m. This slowdown is expected to continue in 2009 with a predicted further fall of -1.8% between the outturn figure for 2008 of €946 million and the 2009 allocation of €929 million. The largest spending category in the science budget is education and training with anticipated expenditure of €1.2 billion in 2009. The number of PhD and non PhD researchers in the State sector continued its upward trend in 2009, though there are signs that this rate of growth is slowing.
The findings from this survey complement the findings from the other R&D performance surveys conducted by Forfás. These include the, Business Expenditure R&D survey (BERD); the Higher Education R&D
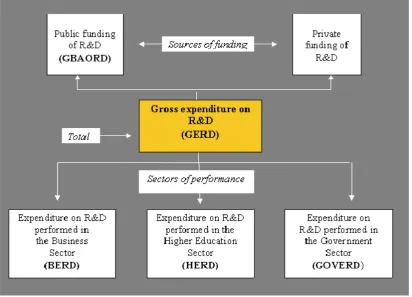
performed survey (HERD) and the hospital performed R&D survey. The total performance of R&D in the State is then added to create the Gross Expenditure on R&D (GERD) metric.
More detailed methodology is presented in Appendix 1. The survey is carried out using the definitions, rules and guidelines set out in the OECD Frascati Manual. This allows for a common dataset to be collected across all OECD and EU countries, which facilitates better international comparisons and benchmarking. Data on GBAORD, GOVERD and human resources is also prepared under European statistical legislation. All international comparison figures relate to the most recent data available for each country.
Forfás would like to thank the many respondents to this survey, who have taken the time to gather information and complete the data requests for this key area of government policy.
Executive Summary
Overall science and technology spending growth in the government sector is slowing following a period of rapid growth. Many individual programme areas are now seeing cuts in expenditure. 2009
anticipated expenditure on science and technology (S&T) by the Irish government sector is expected to rise by 0.8% in current prices to €2.534 billion from an outturn figure for 2008 of €2.513 billion. With the exception of a slight drop in 2005 S&T expenditure by the State sector has continued to grow over the last ten years from a low of €1.2 billion in 1999 to the current high of €2.5 billion.
Total science and technology spending by the State sector 1999-2009 (current and constant prices €bn.)
Total science and technology expenditure consists of five main categories; research and development; technical services; education and training, technology transfer and other S&T activities. In current prices it can be seen that the largest spending category in the science budget is education and
training. Research and development expenditure is anticipated to drop slightly by – 1.5% in 2009 from the outturn figure of €952 million recorded in 2008. Technical services expenditure is expected to reach €217 million in 2009 a slight increase on the 2008 outturn, while the technology transfer
category will be slightly down on the 2008 figure of €126 million to €125 million. Expenditure on other S&T activities is also expected to decrease in 2009.
1.159 1.360
1.677 1.784 1.877
2.028 2.003 2.145
2.397 2.513
2.534
1.567 1.741
2.047 2.082 2.116 2.238
2.156 2.219 2.365
2.384
0.5 1.0 1.5 2.0 2.5 3.0
1999 2000 2001 2002 2003 2004 2005 2006 2007 2008 2009
FORFÁS SCIENCE BUDGET 2008/2009
Total science and technology spending by activity, 2002-2009 (current prices €m.)
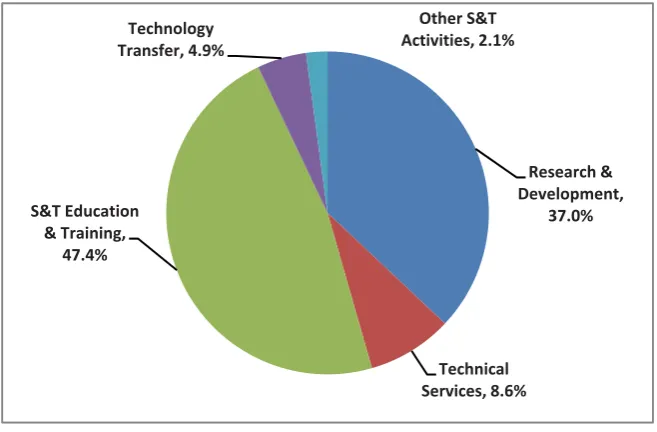
When viewed as a percentage of total spending on science and technology in the government sector, education and training should account for 47.4% of the total in 2009, with research and development taking a 37% share, technical services 8.6% and technology transfer and other S&T activities accounting for the remaining 7%. Despite its dominant share of the total S&D spend education and training’s share has actually decreased as a percentage of the total since 2006 when it recorded a 49% share. By contrast research and development has increased its share of the total since 2006.
Share of science and technology spending by category as a percentage of total spending (2009)
523 589 654 669 704 848 952 938 207 173 182 196 229 217 211 217 830 797 866 948 1059 1140 1161 1200 49 47 52 88 97 131 126 125 175 271 274 102 55 61 62 54
0 500 1000 1500 2000 2500 3000
2002 2003 2004 2005 2006 2007 2008 2009
R&D Tech Ser Ed+Training Tech Transfer Other
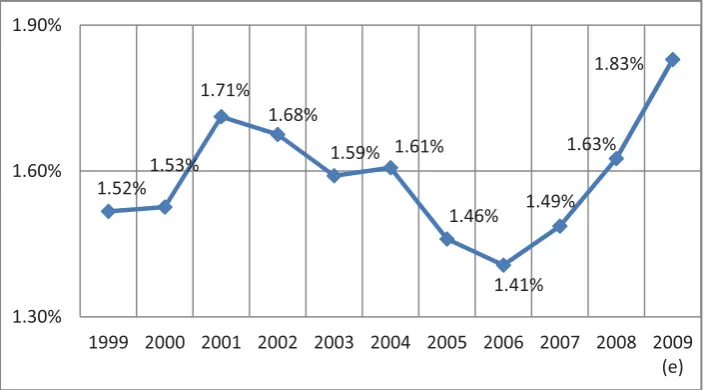
Total government expenditure on science and technology as a percentage of economic activity for the 10 years between 1999 and 2009 has shown considerable fluctuation with a low of 1.41% in 2006 and an anticipated high in 2009 of 1.83%, due to increased government spending on S&T and a corresponding decrease in the rate of economic activity in the country.
Total science and technology expenditure as a percentage of GNP, 1999-2009
Government Budget Appropriations or Outlays on R&D (GBAORD) measures public funding of R&D. The importance placed on increasing R&D in the State sector can be seen in the upward trend in GBAORD between 1999 and 2008. However, the slowdown in the economy is evident from the -8.06% decrease in the GBAORD figures between the 2008 allocation of €1.03 billion and the 2008 outturn of €946 million. The expected 2009 allocation will decrease by a further -1.8% on the 2008 outturn. When GBAORD is viewed as a percentage of GNP it shows a slight rise from 0.61% in 2008 to 0.67% in 2009 which however can be accounted for by the slowdown in GNP in the country.
GBAORD trend (€m.) and GBAORD as a percentage of GNP (1999-2009)
1.52%
1.53% 1.71%
1.68%
1.59% 1.61%
1.46%
1.41% 1.49%
1.63% 1.83%
1.30% 1.60% 1.90%
1999 2000 2001 2002 2003 2004 2005 2006 2007 2008 2009 (e)
0.30% 0.33% 0.37% 0.47%
0.44%0.50%
0.55% 0.52% 0.58%0.61% 0.67%
232 290
360
504 518 635
756 790
934 946
929
100 200 300 400 500 600 700 800 900 1000 1100
FORFÁS SCIENCE BUDGET 2008/2009
The growth rate of civil GBAORD in Ireland between 2004 and 2009, when benchmarked against that of other selected countries, places it sixth out of 17 countries. Civil GBAORD excludes R&D expenditure on defence. It is noticeable that Ireland’s performance is down on its performance for the period 2003-2008 when the country had one of the strongest growth rates across the OECD.
Average annual growth rate of civil GBAORD for selected countries, (2004–2009)
Expenditure on R&D performed in the State sector (GOVERD) is expected to decrease in 2009 to €122 million from the outturn figure of €140 million for 2008. The 2008 outturn is also considerably down on the 2008 forecast figure of €158 million. As a percentage of economic activity GOVERD will continue to remain constant at 0.09% in 2009 as was the case in 2007 and 2008.
GOVERD trend and GOVERD as a percentage of GNP (1999-2009)
3.8% 0.3% 2.1% 2.5% 2.9% 3.9% 3.9% 4.5% 6.7% 9.3% 9.9% 10.0% 10.5% 11.7% 13.9% 21.8% 21.9%
10.0% 5.0% 0.0% 5.0% 10.0% 15.0% 20.0% 25.0% France Japan Italy UnitedStates Netherlands Sweden Germany Finland Greece Denmark Australia Ireland Korea Portugal Iceland Luxembourg Spain 0.08%
0.11% 0.11% 0.12%0.11% 0.11% 0.09%
0.08% 0.09% 0.09% 0.09% 64 96 104 125 127 138 127 120 141 140 122 0.0 20.0 40.0 60.0 80.0 100.0 120.0 140.0 160.0 0.00% 0.10% 0.20% 0.30%
1999 2000 2001 2002 2003 2004 2005 2006 2007 2008 2009
The number of PhD and non PhD researchers in the State sector (448 and 205 respectively) is expected to increase by approx. 4% in 2009 from the outturn figures of 431 and 197 respectively in 2008. The numbers of technicians and other support staff engaged in R&D in the State sector are also expected to show a slight increase in 2009 but both remain below their 2007 highs of 337 and 459 respectively.
Total research and development personnel by occupation (headcount terms, 2007-2009)
406
182
337
459 431
197
298
424 448
205
309
428
0 100 200 300 400 500 600
Researcherswith PhDs
Researcherswithout PhDs
Technicians OtherSupportStaff
Chapter 1: Science and Technology Budget
This chapter examines the total expenditure allocated across the State sector for Science & Technology activities in 2009. The science budget survey divides spending into five main categories:
Research & development
Technical services,
Education and training,
Technology transfer
Other S&T activities
Appendix 3 provides more detail on the definitions used in the questionnaires which are sent to
respondents. Spending data was collected from government offices, agencies and departments engaged in S&T activities, in respect of the final expenditure they incurred in 2008 and their expected spend for 2009.
1.1 Total Science Budget
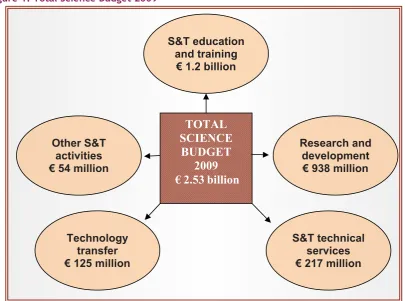
[image:10.595.68.474.472.773.2]The total S&T estimated expenditure for 2009 is expected to reach €2.53 billion. Compared to the final S&T spending for 2008, expenditure is forecast to increase by 1.4% in 2009. It should be noted though that in 2008 the final S&T spending outturn was 5.4% below that expected in the initial expenditure allocations given by respondents to the previous survey. In 2009 the largest category of estimated spending across S&T areas continued to be S&T Education and Training - €1.2 billion. The next largest categories were Research and Development - €938 million, Technical Services - €217 million, Technology Transfer - €125 million, and finally Other S&T activities totalling €54 million.
Figure 1: Total Science Budget 2009
Technology transfer € 125 million Other S&T
activities € 54 million
S&T technical services € 217 million S&T education
and training € 1.2 billion
Research and development € 938 million
TOTAL
SCIENCE
1.2 Trends in State science and technology expenditure
[image:11.595.60.406.304.514.2]Figure 2 below shows a recent history of spending on S&T activities by the State. Data is displayed in current prices and also in constant 2009 prices, which deflates current S&T spending by consumer price inflation. S&T spending in current terms increased from just over €2 billion in 2005 to €2.51 billion in 2008. However, in this period the rapid rise in prices resulted in a smaller increase in real terms being recorded. In 2009 current spending on S&T areas posted only a small gain to €2.53 billion and many individual programmes saw funding cuts. However, a rapid decline in prices in this period, reflecting the strong shock to the overall economy, resulted in a stronger rise in S&T spending in real and constant terms. Figure 3 shows the annual changes in S&T spending in the State sector in current and constant prices over the last ten year period.
[image:11.595.53.397.563.774.2]Figure 2: Total science and technology spending by the State sector, (1999-2009 current and constant prices €bn.)
Figure 3: Annual % change in total S&T spending by the State sector (1999-2009 current and constant prices)
1.159 1.360
1.677 1.784 1.877
2.028 2.003 2.145
2.397 2.513
2.534
1.567 1.741
2.047 2.082 2.116
2.238 2.156 2.219 2.365 2.384
0.5 1.0 1.5 2.0 2.5 3.0
1999 2000 2001 2002 2003 2004 2005 2006 2007 2008 2009 Current
1.3 Trends in categories of State science and technology expenditure
[image:12.595.55.381.245.439.2]Looking at the different components of State S&T spending, reveals a flattening across most activities with the exception of S&T Education and Training which increased and R&D spending which fell. Between 2008 and 2009 State funded R&D spending is expected to decline to €938 million from the €952 million outturn in 2008. Expenditure on S&T education and training is expected to climb by 3.4% to €1.2 billion in 2009 and to continue to be the largest component of the total S&T budget. Spending on technical services is expected to be €217 million in 2009, with expenditure of €125 million and €54 million on technology transfer and other S&T activities respectively.
Figure 4: Total science and technology spending by activity, (2002-2009) - €m. current prices
Figure 5: Share of science and technology spending by category as a percentage of total (2009)
Detailed data on State spending by S&T category at institution and programme level between 2008 and 2009 is presented in Appendix 7.
523 589 654 669 704 848 952 938 207 173 182 196 229 217 211 217 830 797 866 948 1059 1140 1161 1200 49 47 52 88 97 131 126 125 175 271 274 102 55 61 62 54
0 500 1000 1500 2000 2500 3000
2002 2003 2004 2005 2006 2007 2008 2009
R&D Tech Ser Ed+Training Tech Transfer Other
[image:12.595.56.385.502.718.2]1.4 Science and technology intensity (spending relative to economic activity)
[image:13.595.55.400.245.451.2]As can be seen in Figure 6 below, since 2007 there has been a deceleration in State S&T annual spending growth from 11.8% annual growth to just 1.8% in 2009. This slowdown occurred in tandem with a more rapid slowdown in economic growth in that period, with an expected 10% decline in economic activity as measured by nominal Gross National Product (GNP) between 2008 and 2009. GNP is a more relevant measure for calculating economic activity in Ireland as it excludes the large profit repatriations from multi-national firms and other net foreign income flows that are included in the Gross Domestic Product (GDP) metric.
Figure 6: Annual growth rates of science and technology spending and nominal GNP, (1999-2009)
[image:13.595.54.408.581.776.2]Total expenditure on State S&T measured as a percentage of the Gross National Product (GNP) is shown in Figure 7. As S&T spending growth falls behind growth in nominal GNP then S&T spending intensity falls (2004-2006 period). In contrast when S&T expenditure growth quickens past the measured change in GNP, then S&T spending intensity increases (2007-2009). S&T spending intensity rose to 1.63% in 2008 and is estimated to climb further in 2009 to 1.83% of GNP mostly as a result of the rapid slowdown in economic activity.
Figure 7: Total science and technology expenditure as a percentage of GNP, (1999-2009)
15.0% 10.0% 5.0% 0.0% 5.0% 10.0% 15.0% 20.0% 25.0%
1999 2000 2001 2002 2003 2004 2005 2006 2007 2008 2009 (e)
annual%changeS&T annual%changenominalGNP
1.52% 1.53%
1.71%
1.68%
1.59% 1.61%
1.46%
1.41% 1.49%
1.63% 1.83%
Chapter 2: Focus on State funding of research and development
Chapter 2 focuses on one of the most important aspects of the total government Science Budget spending programme – Research & Development (R&D). The government has acknowledged its commitment to the development of a knowledge and smart economy, through the creation of the Strategy for Science Technology and Innovation. This chapter also benchmarks the Irish performance against its international competitors.
2.1 Types of research and development indicators
R&D, as defined by the OECD “comprises creative work undertaken on a systematic basis in order to
increase the stock of knowledge, including knowledge of man, culture and society, and the use of this stock of knowledge to devise new applications”.1 The Science Budget focuses particularly on R&D and yields the following international data measures:
GBAORD – Government Budget Appropriations or Outlays on R&D – Spending (this chapter)
[image:14.595.58.471.419.716.2]GOVERD – Measure of R&D performed in the Government sector (Chapter 3)
Figure 8: R&D funding and performance system
2.2 Government budget spending on research and development
State spending supports for R&D activities come from direct exchequer funding or to a lesser extent from EU sourced funding. Other non-public funding sources for state R&D activities can come from other sources including Irish and foreign business, non-profitable organisations, philanthropists and other donations from individuals. The internationally recognised indicator for benchmarking State sourced funding performance of R&D is GBAORD. GBAORD includes;
funding for R&D programmes in the higher education sector, administered by the Department of Education and Science, the Higher Education Authority (HEA), Science Foundation Ireland (SFI), Enterprise Ireland (EI) and others
funding for business sector R&D, administered via State agencies including IDA Ireland, EI and others
[image:15.595.55.417.360.579.2] funding for government sector performed R&D, for example, Teagasc, The Marine Institute, non-teaching hospitals and others.
Figure 9: GBAORD trend in current prices, €m. (1999-2009)
Figure 9 above shows the government allocation to R&D activities performed across all sectors of the economy from 1999-2009. As can be seen, rapid gains were made in State R&D spending over the last decade, although in 2008 and 2009 there was a rapid deceleration in R&D funding from the State. Annual GBAORD expenditure growth slowed from 18.3% between 2006 and 2007 to 1.2% gains between 2007 and 2008.
The GBAORD outturn figure for 2008 shows a -8.06% drop in expenditure from the 2008 allocation of €1.03m. The 2009 allocation will see this slowdown continue with a further decrease in GBAORD of -1.8% from the 2008 outturn figure. Although there has been a drop in State funding sources from the EU over
231.6 290.0
359.6
504.3 518.1 635.0
755.9 789.8
934.2 945.8 929.0
0 100 200 300 400 500 600 700 800 900 1000
1999 2000 2001 2002 2003 2004 2005 2006 2007 2008 2009 (e)
2.3 Detailed government department spending on research and development
[image:16.595.110.486.282.721.2]Table 1 provides a breakdown of estimated public R&D funding by the main administrating government departments and offices. The largest agency, funding R&D projects in 2009, is expected to be the Higher Education Authority, which have allocated an estimated €345.7 million to R&D activities (or 37.2% of the total State spending on R&D). This spending includes expenditure on R&D programmes including, direct funding via the Programme for Research in Third-Level Institutions (PRTLI), and also indirect funding via the HEA block grant to supported institutions. The next largest funder of R&D activities will be Science Foundation Ireland, allocating an estimated €165 million to R&D in 2009 via research grants and other research supporting programmes.
Table 1: Government departments and agencies funding R&D activities (2009 estimates)
Funding Department/Agency 2009 €m. % of
total
Higher Education Authority 345.7 37.2%
Science Foundation Ireland 165.4 17.8%
Enterprise Ireland 70.3 7.6%
Teagasc 60.1 6.5%
IDA Ireland 60.0 6.5%
Health Research Board 44.5 4.8%
Dept. of Agriculture, Fisheries and Food 26.6 2.9%
Sustainable Energy Ireland 25.9 2.8%
Irish Research Council for Science Engineering and
Technology 25.1 2.7%
Marine Institute 15.4 1.7%
Irish Research Council for Humanities and Social
Science 14.4 1.6%
Environmental Protection Agency 13.6 1.5%
Dept. of Communications, Energy & Natural Resources 10.5 1.1%
Others 51.5 5.5%
Total 929.0 100%
€346 million-The Higher Education Authority’s research programme is designed to enhance the research capabilities, capacity and infrastructure of Ireland’s higher education institutions. These investments have been divided into a portfolio of programmes across disciplines spanning humanities and social sciences, the biosciences and technology and innovation sectors.
€165 million - Science Foundation Ireland was established in 2000 to support globally competitive scientific research. SFI funds a variety of academic researchers and research teams which aim to promote research excellence in biotechnology, information communication technology (ICT), sustainable energy and energy efficient technologies. The allocation of finance is decided by SFI on the basis of scientific merit.
€70 million – Enterprise Ireland (EI) is the national organisation responsible for bringing together innovation, business development and internationalisation for Irish industry. They aim to facilitate collaborative links between enterprise and the research community that will lead to the practical application of research in business. As such, EI offers a variety of supports and funding to companies that wish to engage in R&D.
€60 million- Teagasc is the Irish institute responsible for research in agricultural production, the
environment and the rural economy. The annual research portfolio comprises some 300 research projects, carried out by 500 scientific and technical staff in research centres throughout Ireland. Current research projects range from “animal bioscience research” to research aimed at enhancing the quality of life in rural Ireland.
€60 million - IDA Ireland has national responsibility for securing new investment from overseas in manufacturing and international services, and for encouraging the existing foreign enterprises to expand their business. An R&D capability assistance grant is available to support the establishment of new R&D functions. Research Technological Development and Innovation (RTDI) grant assistance, is directed at established companies who are planning to undertake their first R&D project, and those companies who intend to expand existing ones.
€45 million - The Health Research Board. The research funding aspect of the HRB provides support for projects, programmes and fellowships in health research through an open competition process, along with an element of peer review. Funding covers all areas of health research from biomedical, translational, clinical and practised based research through to population health and research concerning the health services.
use of energy by operating grant aid programmes, providing policy support, and delivering information support aimed at increasing public awareness.
€25 million - The Irish Research Council for Science, Engineering and Technology, (IRCSET) funds R&D in science, engineering and technology in third level institutes. It seeks to position Ireland as an
international centre of excellence and achievement in research. It does this through a series of programmes of assistance, postgraduate research awards and the PhD fellowship scheme.
€15 million – The Marine Institute is responsible for undertaking, co-ordinating and assisting marine research and development. Through its parent department (Department of Agriculture, Fisheries and Food), the Marine Institute distributes research funding aimed at developing research capabilities in a number of areas of marine research. Examples of such research areas include shipping and maritime transport, sea food processing, aquaculture, fisheries resources, seaweed and off shore oil and gas.
€14 million – The Irish Research Council for Humanities and Social Science (IRCHSS) funds cutting-edge research in the humanities, social sciences, business and law with the objective of creating new knowledge and expertise beneficial to Ireland's economic, social and cultural development. The Research Council operates a suite of interlinked Research Schemes. The IRCHSS Government of Ireland Post-Graduate
Scholarships and Government of Ireland Post-Doctoral Fellowships fund research at pre- and post-doctoral
levels. The Research Council operates three schemes which offer research opportunities for members of the academic staff of recognised third-level institutions to undertake stated projects (Government of Ireland Senior Research Scholarships; Government of Ireland Research Fellowships; Government of Ireland
Senior Research Fellowships). A scheme operated by the Research Council known as Government of Ireland
Research Projects Grants funds world class innovative research undertaken on an extended or group
project basis.
€14 million - Environmental Protection Agency supports R&D activities in a range of environmental areas. This work is carried out by researchers in third level institutions, state agencies, government departments, local and regional authorities, the private sector and individuals. The EPA research programme for the period 2007-2013 is entitled Science, Technology, Research and Innovation for the Environment (STRIVE). The purpose of the programme is to protect and improve the natural environment by addressing key environmental management issues through the provision of world-class scientific knowledge generated through a vibrant, competitive programme of research developed supported and co-ordinated by EPA.
2.4 Programmes classified by area of research
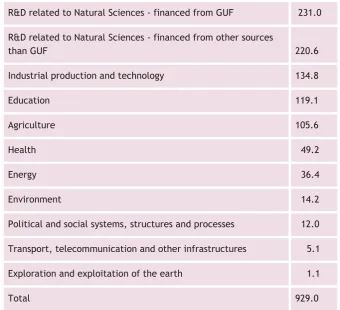
The total expected GBAORD for 2009 can be classified into a number of funded economic areas (see Table 2 below). Over 50% of total GBAORD funding for 2009 has been allocated for performance in higher
[image:19.595.125.466.273.583.2]education. This €929 million includes funding from various agencies such as SFI, HEA PRTLI (Programme for Research on Third Level Institutes), EI and other research funding bodies operating in the higher education sector. This figure also includes an estimate of the proportion of the 2009 HEA block grant devoted to research. This research proportion of the HEA block grant is calculated using a time use methodology.
Table 2: GBAORD classifications for Ireland 2009
R&D related to Natural Sciences - financed from GUF 231.0
R&D related to Natural Sciences - financed from other sources than GUF
220.6
Industrial production and technology 134.8
Education 119.1
Agriculture 105.6
Health 49.2
Energy 36.4
Environment 14.2
Political and social systems, structures and processes 12.0
Transport, telecommunication and other infrastructures 5.1
Exploration and exploitation of the earth 1.1
Total 929.0
2.5 GBAORD as a percentage of GNP and international comparisons
In order to compare state funding of R&D across international competitors, the OECD recommend using the GBAORD indicator with data derived using the guidelines stated in the Frascati Manual. GBAORD includes funding for R&D from direct exchequer sources and also via EU funding. It also includes funding for R&D in the humanities and social sciences. Figure 10 shows that between 1999 and 2008 there was a rapid increase in state R&D spending from €232 million to €946 million in 2008. However, the 2009 GBAORD
figure is down by -8.06% on the 2008 allocation of €1.03 billion. This slowdown can also be seen in the -1.8% drop between the 2008 outturn figure of €946 million compared to the expected 2009 figure of €929
[image:20.595.57.399.249.460.2]million.
Figure 10: GBAORD trend (€m.) and GBAORD as a percentage of GNP (1999-2009)
The GBAORD intensity ratio [State R&D funding for R&D activities as a % of economic activity – Gross National Product (GNP)] has risen steadily over the last decade. The period 1999 to 2002 saw the GBAORD intensity ratio climb from a low of 0.30% to 0.47% of GNP driven by rapid increases in R&D, funding a strong economic growth scenario. Following a pause in state R&D funding growth in 2003, the period 2004 to 2007 (with the exception of 2006) saw the GBAORD intensity rate rise as strong R&D spending gains outpaced nominal economic growth. Within this period, GBAORD as a % of GNP rose to 0.58% in 2007 from 0.44% of GNP in 2003.
In 2008 GBAORD intensity climbed strongly to 0.61% of GNP although some of this rise was driven by the 4.1% contraction in economic activity in that year, alongside the slowing increase of 7.2% in GBAORD spending. Initial estimates for 2009 show total State departments, offices and agencies’ spend on R&D activities will decrease by -1.77%. GBAORD intensity is expected to climb strongly to 0.67% of GNP in 2009 given the further likely 10.4% decline in GNP throughout the year.
Alongside this overall funding, we can also examine the civil GBAORD figures. Civil GBAORD is a better metric used for international comparisons as it does not include the defence portion of the R&D budget. Countries such as the US, France and the UK will spend a large proportion of their GBAORD budget on defence R&D. When data is adjusted for these R&D programmes to only include Civil GBAORD programmes the following data for 1999 and 2009 can be observed.
0.30%0.33%0.37% 0.47%
0.44%0.50%0.55%0.52%
0.58%0.61%0.67% 232 290
360
504 518 635
756 790
934 946
929
0 100 200 300 400 500 600 700 800 900 1000 1100
0.0% 0.5% 1.0% 1.5% 2.0%
Table 3: Civil GBAORD as a percentage of economic activity (GDP/GNP)
Country 1999 2008/2009
Iceland 0.97% 1.06%
Finland 1.03% 0.96%
Spain 0.41% 0.94%
Korea 0.48% 0.86%
Denmark 0.79% 0.84%
Portugal 0.55% 0.78%
Germany 0.74% 0.75%
Sweden 0.66% 0.71%
Austria 0.64% 0.68%
Netherlands 0.76% 0.68%
Ireland 0.30% 0.67%
Japan 0.60% 0.66%
Norway 0.69% 0.64%
Italy 0.53% 0.62%
New Zealand 0.50% 0.56%
France 0.73% 0.54%
Australia 0.51% 0.53%
UK 0.42% 0.51%
United States 0.39% 0.43%
Greece 0.27% 0.29%
* Latest data for most countries is 2008 with the exception of Iceland, Finland, Korea, Australia and Ireland (2009), Greece and Spain (2007) and UK (2006). Given the slowdown in economic activity in 2009 ratios for some countries could rise further.
Figure 11: International comparison of civil GBAORD as a percentage of GDP/GNP (2008*)
* or latest available data
Iceland with civil GBAORD spending of 1.06% of GDP is one of the strongest performing OECD countries, followed by Finland at 0.96% of GDP. The OECD average civil GBAORD intensity is estimated to be around 0.55% of GDP in 2009 (missing data for some countries result in estimates being used).
Figure 12: Average annual growth rate of civil GBAORD for selected countries, (2003–2008)
0.00% 0.20% 0.40% 0.60% 0.80% 1.00%
Greece UK France Italy Japan Netherlands Sweden Portugal Korea Finland
3.8% 0.3%
2.1% 2.5%
2.9% 3.9% 3.9% 4.5%
6.7% 9.3%
9.9% 10.0%
10.5% 11.7%
13.9%
21.8% 21.9%
10.0% 5.0% 0.0% 5.0% 10.0% 15.0% 20.0% 25.0%
[image:22.595.56.435.491.747.2]Chapter 3: Performance of research and development in the public sector
Research and development performed by relevant government departments and their agencies is measured using the GOVERD metric. The funding for Government Expenditure on R&D (GOVERD) comes from public, private and other sources but does not include R&D performed in the higher education sector. This information is gathered in a separate survey conducted by Forfás; the Higher Education Research and Development (HERD) survey. When GOVERD is combined with the HERD and BERD (Business Expenditure on R&D) data the R&D performance of the country as a whole can be calculated. As can be seen later in this chapter the main performers of GOVERD continue to be Teagasc and the Marine Institute.
3.1 Total expenditure on research and development performed in the government sector
The expectation for expenditure on research and development performed in the government sector for 2009 is that it will drop from the 2008 performance of €140 million to €122 million a 13% drop which will leave it just above the 2006 expenditure figure of €120 million. In turn the 2008 outcome is also slightly down on the all time high recorded in 2007 of €141 million. The 10 year trend in Figure 13 below shows an increase in GOVERD from 1999 to a high in 2004 of €138 million. This was followed by a drop in the following two years to €120 in 2006 which in turn was followed by a considerable rise in 2007 to the all time high of €141m. In real terms expenditure on R&D performed in the State sector fell by 5% between 2007 and 2008 and is expected to fall further by 9% between 2008 and 2009.
[image:23.595.53.438.499.747.2]GOVERD as a percentage of GNP over the ten year period from 1999 to 2009 is also illustrated in Figure 13. Despite a drop in 2006 to 0.08% GOVERD as a percentage of GNP remained steady in 2007 and 2008 at 0.09% and it is expected that this level will be maintained in 2009.
Figure 13: GOVERD as a percentage of GNP and GOVERD trend, (1999-2009)
0.08%
0.11% 0.11% 0.12% 0.11% 0.11% 0.09%
0.08% 0.09% 0.09% 0.09% 64
96 104
125 127
138 127
120 141
140
122
0.0 20.0 40.0 60.0 80.0 100.0 120.0 140.0 160.0
0.00% 0.10% 0.20% 0.30%
Figure 14: Major State research and development performers, % of total (2009)
Figure 14 illustrates the major contributors to in-house R&D in the State sector in 2009. As can be seen Teagasc, the Irish agriculture and food development authority, will continue to be the largest performer of R&D in 2009, with expenditure of €62.6 million or over 50% of total GOVERD. However, the 2009
expenditure will show a decrease of 14% on the 2008 outturn figure of €73 million due to resource
adjustments. Teagasc supports science-based innovation in the agri-food and broader bio-economy sectors. Other major contributors include the Department of Agriculture, Fisheries and Food with expenditure of €9.2 million, the Economic and Social Research Institute, €7.8 million and the Department of
Communications, Energy and Natural Resources with €7.7 million. The contribution to GOVERD from the Marine Institute, the national agency responsible for marine research, technology development and innovation (RTDI) has decreased due mainly to a re-classification of some programmes.
More detailed information on research spending in the government sector by institution and nature of programme is available in Appendix 7.
Teagasc, 51.5%
DAFF, 7.6% ESRI, 6.5% DCENR, 6.3% Marine , 5.4%
DSFA, 5.4% BIM, 3.8%
CRFB, 3.7%
Table 4: GOVERD as a percentage of GDP, selected countries (2004 and 2009 or latest available data)
Country 2004 2009*
Korea 0.34 0.40
Slovenia 0.28 0.36
Germany 0.34 0.35
France 0.37 0.34
Finland 0.33 0.30
China 0.28 0.29
Czech Republic 0.26 0.29
United States 0.31 0.29
Japan 0.30 0.27
Norway 0.25 0.25
Total OECD 0.27 0.25
EU-27 0.24 0.24
Luxembourg 0.18 0.22
Spain 0.17 0.22
Denmark 0.17 0.18
United Kingdom 0.18 0.17
Portugal 0.12 0.11
Ireland/GNP 0.11 0.09
Turkey 0.04 0.08
* or latest date data is available.
3.2 Types of Research
The type of research being performed in the various government departments and agencies is also
measured in the Science Budget survey. The OECD Frascati Manual defines the three categories of research as follows:
Basic Research – experimental or theoretical work undertaken primarily to acquire new knowledge, without any particular application or use in view
Applied Research – original investigation undertaken in order to acquire new knowledge, primarily directed towards a specific practical aim or objective
[image:26.595.187.412.379.506.2] Experimental Development - systematic work, drawing on existing knowledge gained from research and practical experience that is directed at producing new materials, products and devices, to installing new processes, systems and services, or to improving substantially those already produced or installed.
Table 5: GOVERD by type of research (2009)
Type of Research 2009 €m. % of total
Applied 97.3 80%
Experimental 12.6 10%
Basic 11.7 10%
Total 121.6 100%
3.3 Fields of science
[image:27.595.49.507.229.400.2]The fields of science classifications are defined by the OECD Frascati Manual in agreement with European nations. As a result of changes in the classification of fields of science in 2006 some amendments in the distribution among programmes resulted in a break in the time-series compared to years prior to 2006 which used the old definitions.
Table 6: Field of science classified by type of research, (2009) €m.
Field of Science Basic Applied Experimental Total
Agricultural Sciences 7.6 63.8 9.0 80.5
Natural Sciences 3.6 10.2 1.4 15.1
Social Sciences 0.5 12.4 0.7 13.6
Engineering and Technology 0.0 7.0 1.5 8.5
Medical and Health Sciences 0.0 3.8 0.0 3.8
Totals 11.7 97.2 12.6 121.5
Applied research in agricultural sciences continues to be the field of science in which most expenditure takes place. In 2009, €63.8 million was spent on applied science in this area with €9 million and €7.6 million respectively spent on experimental and basic research. The natural and social sciences are the next fields of science with the greatest spend in 2009 with total expenditure of €15.1 million and €13.6 million respectively. As seen in Figure 14 the two major performers of R&D in the government sector are Teagasc and the Dept. of Agriculture, Fisheries and Food both of whom would be engaged in the field of agricultural sciences as would agencies such as the Marine Institute, Bord Iascaigh Mhara and the Central and Regional Fisheries Board. Research in the natural sciences field would include research by the Dublin Institute for Advances Studies; the Department of Communications, Energy and Natural Resources; the Department of the Environment, Heritage and Local Government etc.
Chapter 4: Human resources dedicated to publicly-performed research and
development
Personnel engaged in R&D activities performed in institutions within the government sector are examined in this chapter. The data was collected from survey returns from 39 government department and agencies and relates only to personnel working in research and development in the government sector. It does not include R&D personnel in the higher education or business sectors. The survey seeks to ascertain the amount of time spent by staff on R&D activities or Full-Time Equivalent (FTE) in addition to gathering information on the overall totals, gender, qualifications and occupations of R&D staff. The research personnel are divided into PhD and non-PhD researchers, technicians and other support staff. A researcher spending 70% of their time on research activities equals one researcher in headcount terms, and 0.7
researchers in full-time equivalent terms. Gathering information on the time spent by government sector researchers and research support staff, specifically on R&D work, allows for more robust benchmarking with comparable data from other countries.
4.1 Research and development personnel
[image:28.595.55.437.495.730.2]It is anticipated that there will be a 3% increase in 2009 in the overall number of research personnel employed in the government sector over the 2008 outcome of 1,350 (Figure 15). The number of PhD researchers, researchers without a PhD and technicians are all expected to rise by approximately 4% in 2009 over 2008, recording totals of 488, 205 and 309 respectively. Research support staff will also see a slight increase in 2009 over the 2008 outturn figure which in turn shows a 8% decline on the 2007 high of 459 staff. In full time equivalent terms there were 550 FTE researchers in 2009, supported by 692 FTE technicians and other support staff.
Figure 15: Total research and development personnel by occupation (headcount terms, 2007-2009)
406
182
337
459 431
197
298
424 448
205
309
428
0 100 200 300 400 500 600
Researcherswith PhDs
Researcherswithout PhDs
Technicians OtherSupportStaff
As illustrated in Figure 16 below 34% of FTE researchers hold a PhD qualification while 33% of FTE researchers hold degrees below PhD level. 22% of government research personnel were employed at technician level, with the remaining 11% of the FTE total working in other support roles for government researchers.
Figure 16: Total R&D personnel by occupation in FTEs, (2009)
4.2 Gender and qualifications of State sector research staff
[image:29.595.52.364.544.747.2]Figure 17 shows a breakdown of government researcher grades (excludes technicians and support staff), as a percentage of the total, by gender and type of qualification, for 2009, in full-time equivalent terms. Male PhD researchers continue to dominate the numbers employed at research level in the government sector representing 45% of the total. Female PhDs and male researchers below PhD level each account for 20% of the total with the remaining 15% occupied by female researchers without a PhD. The percentage of total occupied by female researchers is expected to increase to 43% in 2009 from 40% in 2008.
Figure 17: FTE Researchers by gender and qualification, (2009)
33%
11%
22% 34%
FTEResearcherswithPhDs FTEResearcherswithoutPhDs
FTETechnicians FTEOtherStaff
Male(PhDs) 45%
Male(Non PhDs)20% Female
(PhDs)20% Female (NonPhDs)
4.3 Research and development staff by fields of science
[image:30.595.54.520.263.662.2]Of the total 550 FTE PhD and non-PhD researchers employed in the government sector, 315 were male and 235 were female. When analysed by the OECD standard fields of science the following statistics emerge for 2009; 44.5% of male researchers and 38.2% of female researchers are engaged in research and development work in the agricultural biotechnology field. The physical sciences account for 14.3% of male researchers’ work while 20.9% of female researchers work in health sciences.
Table 7: Total male/female (FTE) and as percentage of total by field of science, (2009)
Fields of Science
Male Researchers
(FTE)
Male researchers
as % of total
Female Researchers
(FTE)
Female researchers
as % of total
Physical sciences 45 14.3% 12 5.1%
Earth and related environmental sciences 23 7.2% 12 5.2%
Biological sciences 0 0.0% 4 1.7%
Civil engineering 2 0.5% 0 0.0%
Electrical, electronic and information
engineering 10 3.3% 5 1.9%
Health sciences 12 3.9% 49 20.9%
Agriculture, forestry and fisheries 39 12.4% 29 12.4%
Animal and dairy science 9 2.9% 0 0.0%
Veterinary science2 0 0.0% 1 0.4%
Agricultural biotechnology 140 44.5% 90 38.2%
Economics and business 33 10.3% 31 13.2%
Sociology 2 0.6% 2 0.8%
Total 315 100% 235 100%
Figure 18 below shows a gender breakdown within the different fields of science. Female researchers make up 80% of total medical and health researchers, while male researchers account for 73% of researchers in engineering and technology fields. Male researchers also dominate all other fields of science accounting for 70% in natural sciences; 61% of research in the agricultural science and 51% in social science. Outside of the medical and health fields, the highest participation by female researchers is in social sciences with females accounting for 49% of the total.
Figure 18: Researchers classified by gender and field of science FTE, (2009)
Male Researchers
Female Researchers
67.5
12.2
12.4
188.0
34.5
NaturalSciences EngineeringandTechnology MedicalandHealthSciences AgriculturalSciences SocialSciences
28.3
4.6
49.2
120.3
33.1
Appendix 1
Methodology
The information given in this document relates to information supplied by 39 institutions in receipt of monies from the exchequer for the performance or support of scientific, technological and related activities. In general, institutions and information relating to them are listed separately. In a few cases an institution is listed with its parent department or organisation but identified separately. Where
practicable the programmes of the various institutions have been separated and categorised in accordance with international practice into relevant scientific activities i.e.:
Research and development (R&D);
Science and technology (S&T) technical services;
S&T training, education and information;
S&T technology transfer; and
Other S&T activities.
Expenditure data for specific programmes refer to the 2008 outturn costs of programmes and to the expected costs in 2009. The outturn costs are mainly funded by matching grant-in-aid or voted monies. Where programmes are funded in other ways these monies are noted separately. In these instances, the expenditure (cost) data shown includes both exchequer and other income contributions.
Expenditures are based on unaudited figures, except in a few cases where they are identical with a vote by the Oireachtas. For convenience, general overheads, where shown, are distributed in proportion to
programme expenditures. Programmes are attributed to the institution most directly involved - that is to those actually operating them, but not necessarily funding them. An example of the latter is the
Department of Enterprise, Trade and Employment which funds, but does not operate or manage
programmes. Only their own administrative costs are attributed to the funding institutions in such cases.
Appendix 2
[image:33.595.49.484.213.754.2]Government departments and agencies included in the 2009 Science Budget
The Science Budget records expenditure on science and technology in the government sector. This sector includes government departments, associated government agencies and government office. Table 1 below lists the 39 government departments, agencies and offices included in the 2008/2009 Science Budget.Table 1: Government departments/agencies and offices funding S&T activities, 2009
Government Departments Associated Agencies
Dept. of Agriculture, Fisheries and Food
Bord Iascaigh Mhara COFORD Marine Institute Teagasc
Dept. of Communications, Energy and Natural Resources
Central and Regional Fisheries Boards Sustainable Energy Ireland
Dept. of Community, Rural and Gaeltacht Affairs Údarás na Gaeltachta
Dept. of Education and Science
Dublin Institute for Advanced Studies Higher Education Authority Irish Research Council for Humanities and Social Sciences Irish Research Council for Science,
Engineering and Technology
Dept. of Enterprise, Trade and Employment
Enterprise Ireland FÁS Forfás IDA Ireland InterTradeIreland Science Foundation Ireland Shannon Development
Dept. of the Environment, Heritage and Local Government
Environmental Protection Agency Met Éireann Radiological Protection Institute of Ireland
Dept. of Finance Economic and Social Research Institute
Dept. of Health and Children Food Safety Authority Health Research Board
Dept. of Social and Family Affairs
Appendix 3
Definitions of R&D and S&T activities
For the purpose of this survey science and technology activities comprise the five categories below:
1. Research and development:
Research: Original, experimental or theoretical investigations undertaken to acquire new knowledge, with or without a particular application or use in view.
Development: Systematic work drawing on existing knowledge gained from research and/or practical experience, that are directed to producing new products, processes, systems, services, varieties and breeds and to improving substantially already existing ones. Data collection conducted solely or primarily as part of the research and development (R&D) process included under “research” or “development” as appropriate.
2. Technical services:
Specialised support services of a scientific or technical nature generally provided by centralised laboratories or facilities and can be of a routine or non-routine nature. Essentially they comprise the technical back-up, analytical, diagnostic and data collection/processing services.
3. Training, education and information:
Training and education: Education and training of third level or equivalent students in science and technology disciplines
Information: Provision of information via formalised scientific and technical information and documentation (STID) services includes all expenditure (manpower and materials) involved in acquiring, controlling or transmitting information to users with the involvement of staff whose primary function is in formalised STID services e.g. provision of S&T information, advice, liaison, specialist advice, information analysis, libraries, publications and documentation services,
translations, technical seminars and conferences. Provision of information via non-formalised STID services includes expenditure on providing know how and expertise by members of staff who, while not specifically engaged in formalised STID services, provide specialist advice, liaison, consultancy or other general information services.
4. Technology transfer:
Activities which are directed solely or primarily towards the transfer and adoption of new
technology, generally in enterprises. The horizontal transfer of technology, primarily from abroad, but also from colleges to enterprises is included here.
5. Other S&T activities:
Activities which cannot be conveniently grouped under the above headings can be included here e.g. grants to international organisations, policy planning units etc.
Other Definitions:
1. Public funds = Exchequer + EU funds
2. GBAORD = Government Budget Appropriations or Outlays on R&D
Appendix 4
Acronyms
AAGR Average Annual Growth Rate
BERD Business Expenditure on R&D
COFORD National Council for Forest Research and Development
CSF Community Support Framework
CSO Central Statistics Office
DIAS Dublin Institute for Advanced Studies
EPA Environmental Protection Agency
ESRI Economic and Social Research Institute
FÁS Foras Áiseanna Saothair – National Training and Employment Authority
FSAI Food Safety Authority Ireland
FTE Full Time Equivalent
GBAORD Government Budget Appropriations and Outlays on R&D
GERD Gross Expenditure on R&D
GOVERD Government Expenditure on R&D
HEA Higher Education Authority
HERD Higher Education Expenditure on R&D
HC Head Count
HRB Health Research Board
IRCHSS Irish Research Council for the Humanities and Social Sciences
IRCSET Irish Research Council for Science, Engineering and Technology
NESC National Economic and Social Council
NRA National Roads Authority
OPW Office of Public Works
OSI Ordnance Survey Ireland
OST Office of Science and Technology - Department of Enterprise, Trade and Employment
PGM&DB Postgraduate Medical and Dental Board
RPII Radiological Protection Institute of Ireland
Appendix 5
International tables
Table 2: International comparison of GOVERD as a percentage of GDP, 2004 and 2009*
Source: OECD, Main Science and Technology Indicators, May 2009.
* Or latest available data
Country 2004 Rank 2009 Rank
Chinese Taipei 0.57 1 0.48 1
Korea 0.34 3 0.40 2
Slovenia 0.28 9 0.36 3
Germany 0.34 3 0.35 4
France 0.37 2 0.34 5
Russian Federation 0.29 8 0.33 6
Singapore 0.24 17 0.32 7
Finland 0.33 5 0.30 8
Czech Republic 0.26 12 0.29 9
United States 0.31 6 0.29 9
China 0.28 9 0.29 9
Japan 0.30 7 0.27 12
Norway 0.25 16 0.25 13
Total OECD 0.27 11 0.25 13
EU-15 0.24 17 0.25 13
EU-27 0.24 17 0.24 16
EU-25 0.24 17 0.24 16
Israel 0.26 12 0.24 16
Hungary 0.26 12 0.23 19
Italy 0.20 22 0.23 19
Luxembourg 0.18 23 0.22 21
Netherlands 0.26 12 0.22 21
Spain 0.17 26 0.22 21
Poland 0.22 21 0.20 24
Argentina 0.17 26 0.20 24
Denmark 0.17 26 0.18 26
Romania 0.13 31 0.18 26
Canada 0.18 23 0.17 28
Sweden 0.11 34 0.17 28
United Kingdom 0.18 23 0.17 28
Belgium 0.14 30 0.16 31
Slovak Republic 0.16 29 0.16 31
Austria 0.12 32 0.13 33
Greece 0.11 34 0.12 34
Portugal 0.12 32 0.11 35
Ireland/GNP 0.11 34 0.09 36
Table 3: Government sector: Female researchers as a percentage of total researchers (headcount) 2008 (or latest year available)
Source: OECD, Main Science and Technology Indicators, May 2009.
*Or latest available data
Country 2008* Rank
Portugal 44.4% 1
Slovak Republic 42.3% 2
Poland 39.9% 3
Spain 36.7% 4
Turkey 36.7% 4
Greece 36.4% 6
Hungary 33.5% 7
Norway 33.4% 8
Italy 33.3% 9
Ireland 32.1% 10
Finland 31.5% 11
Denmark 29.7% 12
Czech Republic 28.3% 13
France 27.7% 14
Austria 25.3% 15
Germany 21.4% 16
Korea 14.9% 17
37
Appendix 6 – Questionnaire
Expenditure ALLOCATED to Sc
ience & Technology and Resear
ch & Development in 2009
Agen cy Name: : Cu rr ent E x pe nd. Capi ta l Ex pend . Cu rr ent E x pe nd. Capi ta l Ex pend . Cu rr ent E x pe nd. Capi ta l Exp end Cur ren t Exp end . C a pital Exp e nd . Cu r r e n t E x p e nd. Capi ta l Exp end . To ta l Prog ramme Exp e n dit ure (€ '0 00) Cu r r e n t expe nd. Capi ta l exp end . Cu r r e n t expe nd. Capi ta l ex pend . Cu r r e n t expe nd. Capi tal ex pend . Cu r r e n t expe nd. Capi tal ex pen d. Cu r r e n t exp end. Capi tal ex p e nd . 1 00 2 00 3 00 4 00 000 00 00 0 00 Cu r r e n t expe nd. Capi ta l exp end . Cu r r e n t expe nd. Capi ta l ex pend . Cu r r e n t expe nd. Capi tal ex pend . Cu r r e n t expe nd. Capi tal ex pen d. Cu r r e n t exp end. Capi tal ex p e nd . 1 00 00 2 00 00 3 00 00 4 00 00 000 00 0 0 0 00 To ta l (€'00 0) 00 S e c ti
on 2: Res
ea r ch a n d De v e lo pme
nt - De
tai le d Ex pendi tur e ( € '0 0 0 ) Ir ish go v e rn men t f u nded exp en dit u r e on R & D ON LY (p erfo rme d els ew h ere ) N o n -Ir ish go v e r n m e nt f u n d ed expend it u r e o n R& D O N LY (p erfo rme d els ew h ere ) De ta il s EU pu bl ic fun di ng (€'00 0) To ta l Ca pit al E x pendi tu r e (€'00 0) 0 0 Ir is h i n d u s try (€'000 ) Foreig n i ndu stry (€'00 0) Total Cur r e nt Ex pendi tur e (€'00 0) Tec hn ol ogy T r an s fe r (€'000 ) O the r S&T A c tiv it ie s (€'000 ) Priv ate in div id u a ls (€'00 0) Curre nt e x pend itu r e (€'000 ) Ca p ital expend itu r e (€ '000 ) T o ta l (€'000 ) Gro s s E x pe n d it ur e (Cur r e nt + C a p it a l) (€'000) Def initio n Def initio n R&D p r og ra mme a n d perf ormi ng or ga ni s a tio n Curre nt e x pend itu r e (€'000 ) Ca p ital expend itu r e (€ '000 ) D efi nit io n Def initi on 00 Ir ish go v e rn men t f u nded exp en dit u r e on R & D ON LY (pe r for med i n -hous e) R& D p r o g r a mme nam e S e c ti
on 1: Res
ea
r
ch & De
v
e
lopme
n
t and S
c
ie
nc
e & Te
chnol ogy - Tota l I n -H ouse E x p e ndi tur e ( inc l. g o ver nment and non-gov e r nme nt fundi ng) (€ '0 0 0 ) Tota l I n -H ouse E x p e ndi tur e Def initi on Priv ate in div id u a ls (€'00 0) EU pu bl ic fun di ng (€'00 0) Foreig n i ndu stry (€'00 0) Ir is h i n d u s try (€'000 ) To ta l (€'00 0) N o n -Ir ish go v e r n m e nt f u n d ed expend it u r e o n R& D O N LY (p e r for med i n -hous e) 0 Re se arc h & Devel opment (i n sert de tai ls i n s ect ion 2 bel ow ) (€'0 00) Tec hni ca l S e rv ice s (€'00 0) Tr a ini n g , E duca ti on & Inf or ma ti on (€'00 0) 0 0 000 0
0 0 0