0
PRODUCTIVITY IN THE IRISH
RESIDENTIAL CONSTRUCTION
INDUSTRY
CIARÁN AYLWARD AND RONNIE O’TOOLE
1AbstRAct
Irish residential construction is currently undergoing a transformation in productivity terms. This was achieved through increased skills in the industry, increased mechanisation, the use of more modern site management techniques and increases in the average scheme size. This has occurred mostly in urban centres, with rural areas still typified by traditional, low-productivity methods. We estimate that while it took workers a year to complete ten homes in 99, by 00 it took only workers to build the same number of homes of a similar size.
7.1 Introduction
The purpose of this chapter is to provide an assessment of the productivity performance of the Irish residential construction sector and its drivers since 99. We estimate that the productivity levels of the Irish residential construction sector grew by 7 per cent from 99 to 00. Section 7. of this chapter presents an outline of the key characteristics of the sector and its importance to the Irish economy. Section 7. describes the methodology used, which is based on a measure of physical outputs and inputs (number of houses produced divided by number of employees) rather than value added. This estimate is adjusted for factors such as changes in house quality etc. Section 7. decomposes the estimate of productivity into the role played by increased technical efficiency/mechanisation and changes in scheme size. Section 7.5 sets out the implications of this improvement in productivity on the wider economy, while Section 7. concludes with areas for further research.
7.2 The Irish Construction Sector
Some key characteristics of the Irish residential construction sector are summarised below.
• The construction sector in Ireland is a key driver of economic growth and employment. In 005, the sector accounted for ten per cent of the value added in the Irish economy and per cent of the Irish labour force. Further, of the total growth in employment in the economy of 50,000 from 998 to 00, over one-quarter is accounted for by the construction industry;
• The residential construction sector accounts for almost per cent of the value of output from the construction sector. Given that residential construction is relatively labour
intensive compared to other areas of construction, its share of employment is even higher. The other key segments of the sector are commercial and infrastructure construction; • In 005, there were over 80,000 new house completions in Ireland, which per capita, is
around four times the European average;
• The construction sector is characterised by a large number of small companies. Of the 00,000 people employed in the sector in 00, less than 0 per cent worked for companies with more than 0 employees. This compares to a corresponding figure for manufacturing industries of 88 per cent;
• The construction sector works through a complex system of contractors and sub-contractors, which allows for a great deal of flexibility and specialisation. However, it also requires strong project management skills to coordinate the various contractors and sub-contractors that may be working on an individual project; and
7.3 Outline of methodology
This chapter calculates productivity as the number of residential units completed in a particular year divided by the number of hours worked in the construction sector, with an adjustment for changes in average new home size and quality. As such, productivity would increase if output were maintained in the face of lower employment or a shorter working week, or if more or larger homes were built with the same amount of labour.
Output in the residential construction sector is calculated as the sum of two components, namely increases in number of new homes completed, and increases in average home size. It is based on the assumption that productivity growth from 99 to 00 in residential construction was the same as in non-residential construction. It is calculated in five steps:
• Step 1: Calculate Home Completions, 1993 – 2003;
This is calculated as the sum of houses and apartments. Data on the number of house and apartment completions is provided by the Department of Environment, Heritage and Local Government (DOEHLG). The DOEHLG data is based on the number of new dwellings connected by the Electricity Supply Board (ESB).
• Step 2: Adjust Home Completions for Changes in Average Size of New Homes;
The increase in average new home size is not directly observable, so it is taken from the CSO planning permissions data. This figure is then adjusted to allow for the fact that increasing aggregate floor space by increasing average home size requires only half of the labour needed to achieve the same increase through an increase in house numbers.
• Step 3: Adjust for Changes in Quality;
Interviews with industry experts suggest that there have been improvements in the quality of new homes over the period in question. These arise from improvements in the skill level of the industry, regulatory changes in terms of improved disabled access and significant improvements in the quality of social housing. It is not possible from existing data to measure the impact of these changes. For the purposes of this report, we assume that improvements in quality equivalent to a four per cent increase in output per house were achieved in the period 99 to 00.
• Step 4: Adjust for Repair and Maintenance Employment;
• Step 5: Change in Productivity in Construction
The adjusted total new home completions are then combined with changes in non-residential construction, with the weightings being based on the estimate employment shares of residential (75 per cent as of 00) and non-residential (5 per cent) in total construction employment. This provides an index of output in the construction sector. This is then divided by total construction employment to arrive at a productivity estimate. No adjustment is made for possible changes in the ratio of black market employment as a percentage of total employment in construction. Industry feedback suggests that black market employment was a higher share of construction employment in 99 compared to 00, suggesting that the productivity estimate produced in this report is an underestimate of actual productivity improvements in the industry.
7.4 Analysis of Productivity Changes,
1993 – 2003
This chapter calculates productivity as the number of residential units completed in a particular year divided by employment in the construction sector, with an adjustment for changes in average new home size and quality. As such, productivity would increase if output were maintained in the face of lower employment or a shorter working week, or if more or larger homes were built with the same amount of labour.
Based on the measure chosen, we estimate that productivity in the Irish residential construction sector grew by 7 per cent from 99 to 00. An initial estimate was calculated based on the number of dwellings completed per hour worked in the construction industry in Ireland ( per cent). This figure was then adjusted for factors such as quality, repair and maintenance and change in average dwellings size, leading to a final central estimate of 7 per cent.
This estimate suggests that while it took on average workers one year to complete ten homes in 99, today it only takes workers to build the same number of homes of a similar size and quality as in 99.
The output of residential construction sector has increased substantially since 99, most importantly due to increases in numbers employed, but also because of improvements in productivity. The sector is now producing more than three times as many houses than in 99, with these units being on average almost 0 per cent larger than those completed in 99.
Despite the significant growth in productivity in Irish residential construction, the sector may still lag behind European best practice. A recent study in 00 for the European Commission compiled an index based on a composite of a number of physical and value added measures of productivity in the wider construction sector. The results suggest that the overall efficiency
of the Irish construction sector falls below that achieved in many European countries. This is based on a compilation of various indices of labour and input usage, which span a period from 000 – 005.
a sufficient size. This estimate of percentage point productivity improvement should be interpreted as the improvement in productivity that would have been realised even if average scheme size in Ireland had remained unchanged. However, building houses in larger schemes has always been more productive than building isolated units - what has changed is that this productivity gap has widened. As such, the increase in average scheme size would have increased productivity regardless of whether efficiency had changed or not, and it is on this basis that the five percentage point increase is calculated.
This increase in residential construction productivity has been reflected in a greater number of dwelling completions, an increase in the average home size and improvements in building quality. Figure 7. illustrates the sources of productivity improvement. Section 7.. analyses the sources of improvements in technical efficiency, Section 7.. discusses the impact of an increase in the scale of building, while Section 7.. analyses changes in the type of home output.
Figure 7.1: Decomposition of Productivity Changes, 99 – 00
Source: Authors Calculations.
7.4.1 Improvements in Technical Efficiency
Our estimates suggest that improvements in technical efficiency account for much of the productivity gains in the sector from 99 to 00. Interviews with industry participants suggest that this performance has been driven by three key factors: improvements in construction labour skills, the increased use of mechanisation, and changes in management and organisational structure.
Çä nä ä £ää ££ä £Óä £Îä £{ä
>ÃiÊ9i>ÀÊ£ÎÊÊÊ
*À`ÕVÌÛÌÞÊrÊ£ää¯ -V iiÊ-âiÊ>` iivÌÊvÊÀi>ÌiÀ ÕÃ}ÊiÃÌÞ
iivÌÊvÊÀi>ÌiÀ /iV V>ÊvvViVÞ
,iÃ`Õ>®
ÃÌ>Ìi`ÊÓääÎ *À`ÕVÌÛÌÞ
Ài>ÌiÀÊ ÕLiÀ vÊ iÊ V«iÌÃ
«ÀÛiiÌÃÊ Ê iʵÕ>ÌÞ >À}iÀÊ>ÛiÀ>}iÊ iÜÊ iÊÃâi
[image:5.482.55.468.272.470.2]5
Labour Skills
Growing skills intensity in the residential construction sector has been an important source of productivity growth, through the formal development of core and specialist building skills using apprenticeships schemes. The number of National Craft Certificates awarded per annum to apprentices whose trades are oriented towards residential construction increased from 58 to ,77 between 999 and 00. This represents an average annual increase of almost 57 per cent per annum compared to construction employment growth of eight per cent per annum during the same period. FÁS and the CIF also provide a number of non-apprentice courses in disciplines such as crane operation and site management.
Figure 7.2: Apprentices Awarded National Craft Certificate, 999 and 00
Source: FÁS, unpublished data.
Other factors have contributed towards increasing the skills base of the industry, such as the increase in the number of school leavers entering construction with Leaving Certificate qualifications and the influx of skilled immigrants. Further, buoyant demand is enabling construction companies to pay what it takes to attract skilled labour from other sectors of the economy to the construction sector.
One impediment to promoting training through apprenticeships is that the length of time required for an apprentice to be awarded a National Craft Certificate is the same regardless of the level of skill involved. Furthermore, the move to greater specialisation in the sector as a whole has not been reflected in the structure of apprenticeships, and as such skills are more general than is required. For example, while a National Craft Certificate is available for relatively generic skills such as carpenters/joiners, there is currently none available for apprentices wishing to specialise in roofing or crane operation.
£ÊÊÊÊÊÊÊÊÊÊÓää{ ä
Îää Èää ää £Óää £xää £nää
[image:6.482.59.426.231.465.2]
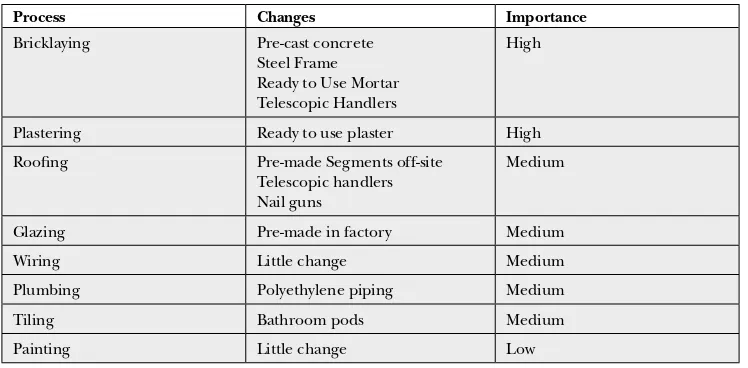
Mechanisation and Quality of Work Materials
The construction industry in Ireland has seen an increased use of labour-saving machinery (mechanisation) over the last decade, as well as an increased use of work materials which improve efficiency. Both of these contribute towards reducing input costs and increasing labour productivity.
[image:7.482.56.430.289.473.2]Some of the major changes include the gradual shift away from traditional bricklaying in favour of pre-cast concrete and steel or timber framed structures. This reduces the need for bricklayers, is more time efficient, and reduces the time needed to plaster, plumb and wire a residential unit. Other simple but effective changes in mechanisation include increased use of nail guns and telescopic handlers. Innovative working materials are also increasingly being used, such as the adoption of polyethylene piping as a substitute for traditional copper piping. Figure 7. reviews the key developments in mechanisation and material inputs that have occurred within the eight main building processes between 99 and 00, and assesses their impact on productivity.
Figure 7.3: Developments in Mechanisation and Quality of Work Materials
Process Changes Importance
Bricklaying Pre-cast concrete Steel Frame Ready to Use Mortar Telescopic Handlers
High
Plastering Ready to use plaster High
Roofing Pre-made Segments off-site
Telescopic handlers Nail guns
Medium
Glazing Pre-made in factory Medium
Wiring Little change Medium
Plumbing Polyethylene piping Medium
Tiling Bathroom pods Medium
Painting Little change Low
Source: Industry Interviews.
7
Better Management and Organisational Structure
In an effort to reduce cost, construction companies have been adopting site management techniques that aim to cut down on the time lost between the completion of sequential tasks. This requires a very tight sequencing and control of construction tasks. For example, it requires that a task such as bricklaying be completed on time so that subsequent tasks such as wiring can be planned for with a high degree of precision. Further, it requires that building materials arrive in sufficient time so as not to delay work, but not so early that they are lying around on a building site, where there is a greater chance of loss through theft, damage or degradation.
In an effort to improve the predictability of when each stage of a project will be completed, some firms have decided to reduce their use of on-site labour. This has been done in part by designing buildings so that labour intensive tasks such as bricklaying are minimised. Furthermore, many firms are increasingly opting for prefabrication. For example, in many of the larger apartment complexes currently under construction prefabricated pod bathrooms are being used, greatly reducing the need for a large number of different tradesmen (e.g. plumbers, tilers and plasterers) on site. Often, these options can cost more than traditional labour-intensive methods, but are favoured because of the greater predictability they offer. The efficiency savings enabled by greater predictability outweighs the additional cost involved.
Another important change in the way construction tasks are organised is a greater specialisation of tasks, particularly in urban areas, which has improved productivity. In Ireland, this has been achieved through the practice of sub-contracting to specialised smaller firms. However, evidence from Europe suggests that larger firms with greater in-house specialisation are generally more productive than those with extensive sub-contracting.5 The increased use of
lean construction and sub-contracting depends on better management skills. Feedback from industry interviews suggests that project management skills in Ireland are weak.
7.4.2 Increases in the Scale and Type of Building Schemes
8
Figure 7.4: Productivity of House Construction Based on Scheme Size
Source: Adapted from McKinsey Global Institute (997).
The scale of a housing scheme is of critical importance to the productivity of an individual construction project. Research by the McKinsey Global Institute indicate that a once off house requires almost per cent more hours worked than does a house of equivalent size on a large housing estate. Further, estimates by McKinsey Global Institute (see Figure 7.) suggest that
productivity is maximised in developing housing projects with at least 50 units.
While there is a paucity of Irish statistics in this area, planning permission statistics would suggest that the number of units per new housing scheme in Ireland has increased by around per cent from 99 to 00. In addition, data on planning permissions suggests that the average number of apartments in a new complex has almost doubled from ten units to 8 units per block over the same period.
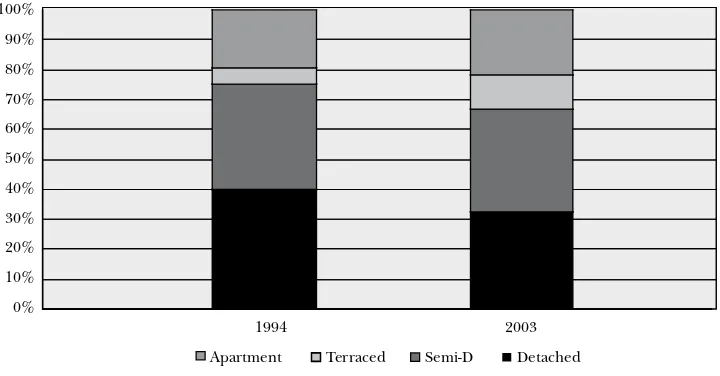
There has been a move towards greater construction density in Ireland, reflected in a higher proportion of apartments and terraced housing of per cent of total residential units completed in 00, up from per cent in 99. Both market and regulatory forces have encouraged the shift to greater housing densities. First, higher land prices have led to reduced average plot sizes. Second, the introduction of the planning guidelines on residential density in 999, by providing guidance on the benefits of higher residential density in appropriate locations, has prompted many local authorities to allow higher density levels when giving planning.
"ViÊvvÊÕÃ} >À}iÊ-V>iÊiÛi«iÌ
£ää £äx ££ä ££x £Óä £Óx £Îä £Îx
£ÊÊÊÊÊÊÊÊÊÊÊÊÊÊÊÊÊÊ£äÊÊÊÊÊÊÊÊÊÊÊÊÊÊÊÊÊÊÓäÊÊÊÊÊÊÊÊÊÊÊÊÊÊÊÊÊÊÎäÊÊÊÊÊÊÊÊÊÊÊÊÊÊÊÊÊ{äÊÊÊÊÊÊÊÊÊÊÊÊÊÊÊÊÊxäÊÊÊÊÊÊÊÊÊÊÊÊÊÊÊÊÊÈä ÊÊÊÊÊÊÊÊÇä
ÀÌV>Ê>ÃÃÊvÊ ÕÃ}ÊiÛi«iÌ
`iÝÊ >Ãi`ÊÊ*À
`ÕVÌÛÌÞÊvÊ
"Viv
9
Figure 7.5: Composition of New Housing in Ireland by Type, 99 - 00
Source: DOEHLG, Housing Statistics, downloaded from www.environ.ie.
Despite increases in the scale of building schemes, the Irish housing market is still notable for the number of once off detached houses, particularly in rural areas, a reflection of our dispersed population structure and agrarian background. Supported by an accommodative planning system, almost 0 per cent of new housing in Ireland is once off.7 This approach is
impacting on productivity growth.
Further, dispersed housing settlements may have negative productivity implications on a host of other sectors including transport, utilities (electricity, postage, telephony, water, waste, etc.) and other services (e.g. health, education, etc.). There are, of course, a range of social, economic and environmental factors which are relevant to the debate on the regulation of rural land use, and productivity is just one of the factors to be considered.
7.4.3 Changes in Home Output
Increases in productivity levels of the Irish residential construction sector are reflected in three developments: more homes are being built per hour worked, the average home size in 00 is significantly larger than in 99, and the average home quality has increased over the period in question.
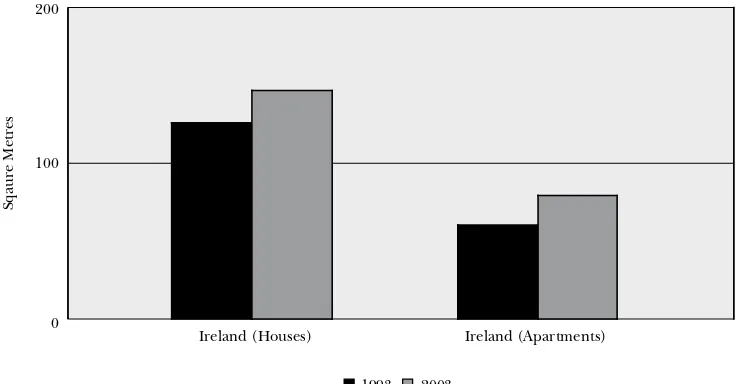
We estimate that the number of homes completed per worker increased by 7 per cent from 99 to 00. The average floor size of both houses and apartments has also increased by around 0 square metres from 99 to 00 (see Figure 7.). For houses this represents an increase of around 0 per cent in terms of floor space. For apartments, the change is even more dramatic, with an average increase in floor space of per cent. It requires less additional labour to increase the amount of aggregate residential floor size by building bigger houses than to build more houses, because large houses tend to have fewer fittings per square metre than small houses (e.g. sockets, lighting, toilets, staircases etc.), so increasing floor space is not very labour intensive.
£ää¯ ä¯ nä¯ Çä¯ Èä¯ xä¯ {ä¯ Îä¯ Óä¯ £ä¯ ä¯
£{Ê Ê ÊÊÊÊÊÊÊÊÊÊÊÊÊÊÊÊÊÊÊÊÊÊÊÊÊÊÊÊÊÊÊÊÓääÎ
0
[image:11.482.58.428.160.352.2]It is unclear if house sizes will continue to increase in Ireland. On the one hand, Irish home buyers are better off today than in 99, and are willing to devote a lot of that additional income to purchase larger homes. On the other, smaller family sizes and increasing land prices are forcing buyers and planners to economise on land, particularly in central urban locations.
Figure 7.6: Average Size of New Homes
Source: Derived from CSO Planning Permissions, Q 005 and Q 999.
We assume based on industry interviews that house quality has improved by four per cent over the period 99 – 00.8 This is, by necessity, an estimate, as changes in house quality
are generally not measured. By way of illustration, if there had been no change in housing quality over the period under review, the total productivity increase would have been per cent. Evidence from industry interviews suggests that the quality of once-off housing and local authority housing has improved over the period in question, though the quality of finish of some larger scale building projects, such as apartment blocks, has deteriorated. Examples of changes in quality include: disabled access, downstairs toilet facilities, ensuite bathroom facilities, durability, quality of finish, fittings, etc.
7.5 The Implications of Higher Productivity
How has higher productivity in the residential construction sector enhanced the competitiveness of the Irish economy? There are three inter-related mechanisms through which this could happen, namely, moderating house prices, increasing housing output, and releasing scarce labour resources that could be employed elsewhere in the economy.
£ÎÊ ÓääÎ
Ài>`ÊÕÃiÃ®Ê Ê Ê Ê Ê Ê Ê Ê Ê Ê Ê Ê Ê Ê Ê Ê Ê Ê Ê Ê Ê Ài>`Ê«>ÀÌiÌî Óää
£ää
ä
-µ>ÕÀ
iÊiÌÀ
7.5.1 Reducing House Prices
For most goods and services, greater productivity results in a lower cost to the final consumer. However, the period 99 to 00 has been one of extremely strong growth in house prices in Ireland. Figure 7.7 below assesses the role that growing labour productivity has contributed toward reducing housing costs. Two conclusions emerge:
The improvements in labour productivity of 7 per cent (. per cent per annum) that have been identified over the period 99 to 00 have been more than offset by the growth in residential construction labour costs. A rapid increase in demand for housing has resulted in a large increase in land prices and profits in the construction industry, while government revenue from the housing sector has also risen commensurately.
Therefore, the productivity growth achieved has not resulted in reduced house prices in recent years. Nonetheless, if houses had been constructed in 00 based on the lower 99 productivity levels, they could have cost an average €8,500 more per unit to build in real terms. Of course, it is unlikely that all or any of this saving has been passed on to house purchasers, and may have had the effect of further raising profits and land prices instead.
Figure 7.7: Decomposition of Changes in House Prices, 99 – 00
Source: Authors Calculations.
7.5.2 Increased Housing Output
We estimate that the increase in productivity in the residential construction sector over 99 levels had increased the output of the sector by around ,500 units per annum by 00, based on 00 employment levels. Cumulatively the productivity growth during the ten-year period has allowed the construction of over 80,000 additional new homes.
£ÎÊ ÕÃiÊ«ÀViÊr
ÈÇ]äää
*ÕÃ{Ó]äääÊ`ÕiÊÌ } iÀÊ>LÕÀÊVÃÌà ÕÃ
Ón]xääÊ`ÕiÊÌ }Ài>ÌiÀÊ«À`ÕVÌÛÌÞ *ÕÃ
£{Ç]äääÊ`ÕiÊÌ } iÀÊ«ÀvÌÃÉÊ>`
«ÀViÃÉ}ÛÌÊÌ>Ý ÀiÛiÕi
ÓääÎÊ ÕÃiÊ«ÀViÊr
ÓÓÇ]äää
Óxä]äää
Óää]äää
£xä]äää
£ää]äää
xä]äää
[image:12.482.55.427.314.506.2]
7.5.3 Releasing Scarce Labour Resources
An alternative way of examining the benefits of productivity is to calculate how much additional labour would have been required to produce the number constructed in 00, at 99 productivity levels.9 Based on the estimates, over 0,000 additional workers would
be needed to produce the 00 level of output at 99 productivity levels. This would have the effect of driving up wages, and using up scarce labour that is required elsewhere in the economy. In particular, the residential sector draws labour from other areas of construction such as commercial buildings and infrastructure construction.
7.6 Conclusion
The purpose of this chapter is to provide an assessment of the productivity performance of the Irish residential construction sector and its drivers since 99. We estimate that the productivity levels of the Irish residential construction sector grew by 7 per cent from 99 to 00, mainly through improvements in technical efficiency, but also because of increases in the average size of building schemes. This could have affected the economy by moderating house price increases, increasing housing output, and releasing scarce labour resources that could be employed elsewhere in the economy.
Although the residential construction sector is one of the biggest employers in the economy, the statistical data needed to accurately assess its productivity performance is not available. An improved understanding of the industry through the availability of better data can help guide policies aimed at promoting further productivity growth. The estimate of productivity growth contained in this report is based on a number of simplifying assumptions which were necessitated by this lack of data. A much more detailed breakdown of labour utilisation by skill level and sub-sector within the construction sector is required. Further, very detailed data is currently collected from mortgage providers which could allow the development of a comprehensive new-housing quality survey, which could include indices tracking changes in house quality. However this data is currently not published. An additional issue to be addressed is the influence on average residential construction productivity of the share of apartments in total output, given the different construction methods used.
Notes
DKM (005), “Economic Consultants, Review of the Construction Industry 00 and Outlook 005–007”, Estimate for 005.
Productivity for some industries can be calculated in a number of ways, for example using a measure of physical outputs and inputs as in this report, or using value added in the industry divided by an appropriate deflator. Both methods should come up with the same answer, given the availability of all necessary data.
BWA Associates (00). The study is not based on data from a single year, but rather is based on a composite of data and surveys from 000 to 005.
5 BWA Associates (00).
McKinsey Global Institute (997).
7 Department of the Environment and Local Government (00: 9-).
8 This based on estimated labour input requirements for the observed quality improvements, in other words that a house in 00 would require four per cent more labour than a corresponding house in 99, assuming an identical level of productivity.
9 It should be noted that this is an alternative way of examining the benefits as discussed in the paragraph above, and is not additional to them.
References
BWA Associates (00), Benchmarking of Construction Efficiency in the EU Member States – Scoping Study. Report commissioned by the Enterprise and Industry Directorate-General of the European Commission.
Department of the Environment and Local Government (00), Irish Spatial Perspectives: Rural and Urban Roles, Dublin.
DKM Economic Consultants (00), “Review of the Construction Industry 00 and Outlook 005–007.”
FÁS (00), Study of Project Management Skills in the Irish Construction Industry. Report Commissioned for the FÁS Construction Industry Group.