Radiation-pressure-induced mode splitting in a
spherical microcavity with an elastic shell
Matthias Gerlach, and Yury P. Rakovich
Semiconductor Photonics Group, School of Physics, Trinity College Dublin, Dublin 2, Ireland gerlachm@tcd.ie
John F. Donegan
Semiconductor Photonics Group, School of Physic and Principal Investigator CRANN Research Centre, Trinity College Dublin, Dublin 2, Ireland
Abstract: In this work, we present a novel method to reveal azimuthal
whispering gallery modes (WGMs) in a spherical microcavity coated with a nano-meter thick polyelectrolyte shell and one monolayer of CdTe semiconductor quantum dots. The new approach in this experiment is based on the deformation of the spherical shape in a non-contact way using the radiation pressure from a laser beam, which causes the lifting of the degeneracy of the WGMs. The resonance peak linewidth and splitting parameters can be efficiently controlled by the strength of the radiation pressure and the elastic properties of the surface shell.
©2007 Optical Society of America
OCIS codes: (230.5750) Resonators; (290.4020) Mie theory; (260.3800) Luminescence;
(170.4520) Optical confinement and manipulation.
References and links
1. A. Ashkin, “ History of optical trapping and manipulation of small-neutral particle, atoms, and molecules,” IEEE J. Quantum Electron. 6, 841-856 (2000).
2. J. E. Molloy, and M. J. Padgett, “Lights, action: optical tweezers,” Contemp. Phys. 43, 241-258 (2002). 3. R. C. Gauthier, R. N. Tait, H. Mende, and C. Pawlowicz, “Optical selection, manipulation, trapping and
activation of a microgear structure for applications in micro-optical-electromechanical systems,” Appl. Opt.
40, 930-937 (2001).
4. M. Sulfridge, Taher Saif, N. Miller, and K. O’Hara, “Optical actuation of a bistable MEMS,” J. Microelectromech. Syst. 11, 574–583 (2002).
5. C. Höhberger Metzger, and K. Karrai, “Cavity cooling of a microlever,” Nature 432, 1002-1005 (2004).
6. D. Dragoman, and M. Dragoman, “Optical actuation of micromechanical tunneling structures with
applications in spectrum analysis and optical computing,” Appl. Opt. 38, 6773– 6778 (1999).
7. I. Teraoka, and S. Arnold, “Enhancing the sensitivity of a whispering-gallery mode microsphere sensor by a high-refractive-index surface layer,” J. Opt. Soc. Am. B 23, 1434-1441 (2006).
8. I. Teraoka, and S. Arnold, “Theory of resonance shifts in TE and TM whispering gallery modes by nonradial perturbations for sensing applications,” J. Opt. Soc. Am. B 23, 1381-1389 (2006).
9. S. Arnold, M. Khoshsima, I. Teraoka, S. Holler, and F. Vollmer, “Shift of whispering-gallery modes in microspheres by protein adsorption,” Opt. Lett. 28, 272-274 (2003).
10. I. Teraoka, S. Arnold, and F. Vollmer, “Perturbation approach to resonance shifts of whispering-gallery modes in a dielectric microsphere as a probe of a surrounding medium,” J. Opt. Soc. Am. B 20, 1937-1946 (2003).
11. H.-M. Tzeng, M. B. Long, R. K. Chang, and P. W. Barber, “Laser-induced shape distortions of flowing droplets deduced from morphology-dependent resonances in fluorescence spectra,” Opt. Lett. 10, 209-211 (1985).
12. V. S. Ilchenko, P. S. Volikov, V. L. Velichansky, F. Treussart, V. Lefèvre-Seguin, J. -M. Raimond, and S. Haroche. “Strain-tunable high-Q optical microsphere resonator,” Opt. Commun. 145, 86-90 (1998). 13. V. V. Lulevich, D. Andrienko, and O. I. Vinogradova, “Elasticity of polyelectrolyte multilayer
microcapsules,” J. Chem. Phys. 120, 3822-3826 (2004).
15. Y.P. Rakovich, L. Yang, E. M. McCabe, J. F. Donegan, T. Perova, A. Moore, N. Gaponik, and A. Rogach, “Whispering Gallery Mode Emission from a Composite System of CdTe Nanocrystals and a Spherical Microcavity,” Semicond. Sci. Technol. 18, 914-918 (2003).
16. Y. P. Rakovich, J. F. Donegan, M. Gerlach, A. L. Bradley,T. M. Connolly, J. J. Boland, N. Gaponik,and A. L.Rogach, “Fine structure of coupled optical modes in photonic molecules,” Phys. Rev. A 70, 051801-1-051801-4 (2004).
17. A. S. Susha, F. Caruso, A. L. Rogach, G. B. Sukhorukov, A. Kornowski, H. Möhwald, M. Giersig, A.
Eychmüller, and H. Weller, “Formation of luminescent spherical core-shell particles by the consecutive adsorption of polyelectrolyte and CdTe(S) nanocrystals on latex colloids,” Coll. Surf. A 163, 39-44 (2000). 18. V. K. Komarala, Y. P. Rakovich, A. L. Bradley, S. J. Byrne, S. A. Corr, and Y. K. Gun’ko, “Emission
properties of colloidal quantum dots on polyelectrolyte multilayers,” Nanotechnology 17, 4117-4122 (2006).
19. N. Gaponik, D. V. Talapin, A. L. Rogach, K. Hoppe, E. V. Shevchenko, A. Kornowski, A. Eychmueller,
and H. Weller, “Thiol-capping of CdTe nanocrystals: an alternative to organometallic synthetic routes,” J. Phys. Chem. B 106, 7177-7185 (2002).
20. R. K. Chang, and A. J. Campillo, Optical Processes in Microcavities (World Scientific Pub Co Inc, 1996). 21. A. J. Trevitt, and P. J. Wearne, “Observation of nondegenerate cavity modes for a distorted polystyrene
microsphere,” Opt. Lett. 31, 2211-2213 (2006).
22. H. M. Lai, P. T. Leung, K. Young, P. W. Barber, and S. C. Hill, “Time-independent perturbation for leaking electromagnetic modes in open systems with application to resonances in microdroplets,” Phys. Rev. A 41, 5187-5198 (1990).
23. K. F. Ren, G. Grehan, and G. Gouesbet, “Prediction of reverse radiation pressure by generalized Lorenz-Mie theory,” Appl. Opt. 35, 2702-2710 (1996).
1. Introduction
microsphere in an optical tweezing setup was achieved with a tightly focused cw laser beam when the MF/PE/CdTe microsphere-emitter was placed on a glass substrate. Due to a strong difference in elastic properties of MF and the PE multilayer film [13], the radiation-pressure-induced deformation of the PE shell is the crucial factor controlling the WGM structure in the micro-PL spectra of the microcavity. The PE shell deformability was increased through contact of the shell with a salt-containing solution, which changes the mechanical properties of the PE multilayer. We have chosen spheres with a diameter of 3 μm for our experiments. These spheres posses a large free spectral range between resonant WGM peaks that allows accurate identification of the polarisation and mode number of WGMs. The mode linewidth or quality factor Q are relatively unaltered by effects such as absorption by the CdTe QD monolayer [16]. We investigated the possibility of controlling the splitting of the WGM resonances in the microsphere/QDs system by radiation pressure. The experimental approach presented here should lay the groundwork for application of WGMs in spherical microcavities with an elastic shell for photonic applications.
2. Experimental
serves the purpose of an optical tweezers setup, both confining the sphere by applying radiation pressure and as an excitation source for the optically pumped semiconductor QDs.
3. Results and discussion
The discrete wavelengths corresponding to the WGMs within a microsphere can be identified by the angular mode number l, which describes the angular variation of the internal mode intensity [20]. The radial variation in the internal field is described by the mode order n, which indicates the number of radial maxima in the distribution of the mode intensity. For each mode number and order there exists both a transverse electric TE mode having no radial electric field component, and a transverse magnetic TM mode with no radial magnetic field component. WGMs are also wavelength degenerate with respect to the azimuthal (m) modes due to the spherical symmetry of the microcavity. This means that orbits with various inclinations, described by various m-modes have the same pathlengths and consequently the same resonance wavelength. The total number of these m-modes, originating from a certain mode , is governed by the distribution of electro-magnetic fields confined in the microsphere
and in the approach of the normal mode concept is 2 + 1. The so-called fundamental mode
[image:4.612.236.376.299.363.2]m = is situated in the equatorial plane, the smallest azimuthal mode m = 0 is located perpendicular to the fundamental mode in the polar region as indicated in Fig. 1.
Fig. 1. Spatial orientation of the optical resonances with respect to the azimuthal mode number
m.
One of the ways to reveal different m-modes is to deform the microsphere, for example, using a compression device [12] or as recently published by laser heating a polystyrene sphere in an ion trap [21]. Shape distortion breaks the azimuthal symmetry and results in a lifting of the degeneracy. In a deformed sphere, photonic orbits with various inclinations have different pathlengths and therefore, the spectral positions of m-modes are no longer the same. In other words, a single WGM peak in the spectrum of a perfect sphere is now split into a series of azimuthal resonances. The m-modes with “+” and “-” signs, designating clockwise and counter-clockwise rotations, still have the same resonance wavelength. As a result no degeneracy is removed between m and –m in the deformed microsphere and the new degeneracy of WGMs is now + 1 with m progressing from 0 to . Perturbation theory provides an analytical expression for the frequency shifts and mode splitting of each of the WGMs for an oblate spheroid with a small amplitude of distortion e = (rp - re)/a << 1, where
the polar and equatorial radii are rp and re, respectively [22].
(1)
λm(m, e) is the resonance wavelength of the azimuthal mode, which is dependent on the
distortion and the m-mode number. λl,n is the resonance wavelength for a perfect sphere of
radius a. Increasing the deformation of the sphere leads to a stronger splitting and a higher free spectral range between the azimuthal modes, which increase quadratically with the mode number m. A physically cross-linked network of PE molecules forms an elastic LbL shell on the surface of MF microspheres.The strong difference in elastic properties of the MF core and
( )
⎭ ⎬ ⎫ ⎩
⎨ ⎧
⎥ ⎦ ⎤ ⎢
⎣ ⎡
+ − + =
) 1 (
3 1 6 1 ,
2
,
l l
m e e
m ln
m λ
the PE multilayer film suggests the possibility of revealing m-modes by deformation of the elastic surface shell. However, a controllable mechanical deformation of 3-μm microspheres combined with micro-PL spectroscopy is difficult to realize. The alternative is to use the radiation force acting on a microcavity on a substrate, illuminated by a tightly focused laser beam. In this optical trapping experimental scheme, radiation pressure is applied to the sphere. A downward radiation force is pressing the sphere onto the glass substrate. Instead of producing a deformation resulting in an oblate spheroid shape, we only apply radiation pressure which is strong enough to deform the soft PE multilayer on the sphere surface. The solid MF core is not distorted, as the radiation pressure is not sufficient to deform the whole sphere. Only the soft PE multilayer is compressed under radiation pressure between the solid substrate and the MF core. Total internal reflection within the microcavity system occurs at the boundary between the surrounding medium (air) and the soft PE multilayer. Therefore, a deformation of the PE shell is affecting the resonance frequency of the modes. The primary condition for optical trapping is a high intensity gradient of a laser beam, in our case a Gaussian beam, obtained by an objective with high numerical aperture. The schematic setup is shown in Fig. 2.
Fig. 2. The scheme for radiation force on a spherical microcavity. The inset shows the distortion of the spherical shape caused by the sphere pushed on the substrate.
propagating toward the positive z direction and impinging on a spherical microparticle located along the axis of the beam is given by
(2)
where P is the power of the laser beam, ω0 the spot size of the focused beam and Cpr the
radiation pressure cross-section which is given by [23]
(3)
In this equation, the beam shape coefficient gn for an on-axis Gaussian beamis
(4)
where s is defined by s = 1/kω0, k is the wavenumber and z0 is the coordinate of the
beam-waist centre. The Mie-coefficients an and bn are the scattering coefficients which were
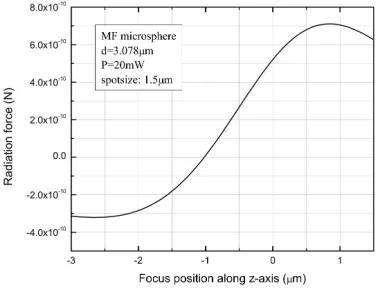
calculated with expressions based on the Lorenz-Mie theory [20]. Figure 3 shows the calculated radiation force Fpr for a variable focus position along the z-axis in the centre of the
sphere with a diameter of 3.078 μm. A negative value of Fpr means a reverse radiation force
exerted on the microsphere, pulling the sphere in the opposite direction to the beam propagation. This occurs when the resulting gradient force exceeds the scattering force. A positive Fpr pushes the sphere downwards onto the solid substrate. The value z = 0 on the
[image:6.612.216.406.456.600.2]x-axis in Fig. 2 corresponds to the centre of the sphere. Positive z values are focus positions below the centre towards the substrate and negative values of z corresponds to a focus point above the sphere centre. A freely moving microsphere would be trapped at the point where the radiation force is zero, which is at z = -1 μm in our calculations.
Fig. 3. Calculation of radiation pressure applied to a microsphere in the sphere centre along the z-axis of Fig. 2.
When a laser beam is focused at this point, the scattering force and the gradient force compensate each other. When the focus is moved further up, the resulting radiation force is pulling the sphere upwards and when the focus is moved further down, the sphere is pushed
(
)
(
(
)(
)
)
⎥ ⎦ ⎤ ⎢ ⎣ ⎡ + + − − ⎟⎟⎠ ⎞ ⎜⎜⎝ ⎛ + = − 0 0 2 0 1 0 0 / 2 1 2 1 exp exp 2 1 ωω i sz
n n s z k i z s i gn , 2 2 0 pr rad C c P F ω π =
[
]
[
( 2 2 )]
onto the substrate with the maximum radiation pressure at around 0.6 μm (z = 0.9 μm) above the substrate. The calculations clearly demonstrate the possibility of controlling the radiation pressure by tuning the focus position, implying a non-contact method of controllable tuning modification of WGMs in a spherical microcavity with a compressible surface shell. The PL spectra of single microspheres with 12 nm and 30 nm thick PE shells, respectively and one monolayer of CdTe QDs were taken at different focus positions and excitation power. In order to modify the stiffness of the PE shell, the sample with the 15 nm shell was kept for 5 days in a highly concentrated NaCl (7 Mol/l) solution, before these spheres were coated with the QD layer. This treatment reduced the solidity of the PE layer resulting in a softer surface layer.
Fig. 4. PL spectra of microspheres while trapped in a cw laser beam under radiation pressure.
(a) and (b) Same microsphere sample (4 bi-layers), excitation power P = 15 mW taken at
different focus positions. (c) and (d) Another microsphere sample (5 bi-layers) modified with a salt solution and taken at considerably lower excitation power P = 5 mW, also at different focus positions.
Figure 4 shows the spectra of four measurements. The focused laser beam applies a radiation force on a single microsphere as illustrated in Fig. 2. The laser also excites the QDs on the sphere surface. The spectra of a single sphere shown in Fig. 4(a) and 4(b) were taken with the micro-PL setup with a different focal position. The sphere is coated with 4 bi-layers of PE but not softened in a salt solution. In the first case (see Fig. 4(a)), the PL spectrum was recorded with a focus position of z = -2.5 μm, which is 1 μm above the microsphere. According to theoretical predictions (Fig. 3), the laser beam causes an upward radiation pressure exerted on the sphere. The spectrum shows the WGM structure which is typical for a sphere with a diameter of 3 μm. According to the Lorentz-Mie theory, the position and polarization of the WGM can be uniquely determined by calculation of the scattering cross section or solving equations for the denominators of the scattering coefficients [20]. Thus, the stronger peaks in Fig. 4 were identified as TE modes, whereas the smaller peaks observed in the micro-PL spectra are TM modes. The TE and TM resonances where identified by angular mode number
1.6×10⁻¹² N). When focused inside the sphere on the substrate (z = -1.5 μm) as shown in Fig. 4(b), a second peak which is slightly red-shifted with respect to the original mode is now clearly observed. The splitting of the WGM peak towards longer wavelength is in very good agreement with the theory, predicting that the deformation causes the lifting of the mode degeneracy and shifting the azimuthal modes to longer wavelengths. The spectra shown in Fig. 4(c) and 4(d) are taken with a different sphere. This sample consists of 5 bi-layers of PE on the sphere, which are softened in a 7 molar NaCl solution before coating with CdTe nanocrystals. Compared with the sphere used in the measurements of Fig. 4(a) and 4(b), this sphere has one additional bi-layer of PE and the whole PE shell is softer due to the NaCl treatment. The softening of the deformable PE shell in this measurement is clearly noticeable in the excitation power of the laser beam. Only a third of the excitation power of the first measurement was required to deform the sphere, which is considerably less radiation pressure as the pressure scales linearly with the power.
650 655 660 665 670
2000 4000 6000
laser beam pow er: P = 2.5 m W TE1
20
PL
I
nt
ens
it
y
W avelength (nm ) TE1
20 a)
b)
650 655 660 665 670
2000 2500 3000 3500
focus z = -1.7 μm
[image:8.612.185.429.239.414.2]focus z = -1.7 μm laser beam pow er: P = 15 m W
Fig. 5 Excitation of a single sphere at constant focus position z = -1.7 μm at (a) P = 15 mW and
(b) P = 2.5 mW.
642 643 644 645 646 647 648 649 650 800 1000 1200 1400 1600 1800 2000 2200 2400 PL I nt ens it y
W avlength (nm )
M easurem ent
TE1 21
C alculation for m =0 to 21 C alculation for
[image:9.612.126.460.89.218.2]m =0 to 16
Fig. 6. Left hand graph: Measured TE mode and mathematically modelled peak shape of the spectrum in Fig. 4(b). Right hand graph: Measured TE mode and mathematically modelled peak from measurement in Fig. 4(d).
A mathematical model based on Eq. 5 can verify that the observed peak structure is indeed caused by lifting the azimuthal mode degeneracy. By means of this model, individual WGMs can be approximated by Lorentzian-shaped azimuthal peaks. The superposition of these modes is plotted in Fig. 6. The first term in Eq. 5 is related to the original resonance λ0 of the
undistorted sphere. The second term is the sum of all azimuthal peaks. In a perfectly spheroid deformation, the original peak would vanish and split into the azimuthal resonances (see Eq. 1). As our sample sphere experience a non-uniform distortion within the soft shell of the microcavity, we expanded the model for the azimuthal splitting. The region of the PE shell around the contact point between the sphere and the substrate is deformed due the radiation pressure (see inset Fig. 2). The solid MF sphere is not affected by the radiation pressure. As a result, the distortion affects only the azimuthal resonances that are located near the polar region where the elastic deformation of the PE multilayer occurs. These are the azimuthal modes with low mode number m (see Fig. 1). The modes with high mode number m, which travel around the circumference near the equator of the sphere, would be strongly red-shifted in a perfect oblate spheroid. Our samples experience no shape deformation near the equator and therefore, the modes located there are not red-shifted but instead they still have the original resonance frequency of a non-deformed sphere. To consider this fact, we included the Lorentzian peak of the original mode into the model, which is the first term in Eq. 5. The second term is the sum of all azimuthal Lorentzian peaks in a deformed oblate spheroid. We assume that there is still a strong resonance at the original resonance frequency as a result of the non-uniform deformation overlapped by the split azimuthal modes
(5)
The first term in the equation is the original resonance of the undistorted sphere, the second term is the sum of all azimuthal peaks. I and I0 are the intensities of the Lorentzian peaks. The
linewidth of the resonances which is determined to be Δλ = 0.3 nm (Q ≈ 2200) and the original resonance wavelength λ0 are taken from the measured spectrum to model the WGM
lineshape. The shape of the modelled peak is fitted to the measured peak by changing the ellipticity e of the microsphere/PE multilayer structure. The results presented in Fig. 6 demonstrate very good qualitative agreement between the calculated and measured lineshape of the WGM peak, although the model does not take varying intensities and Q-factors for the different azimuthal modes into account. The derived value of ellipticity of the resonance in
Fig. 6 in the graph on the left hand side is determined to be e = 8.5⋅10-3. At longer wavelengths, the measurement shows a drop in intensity while the modelled result shows a plateau. As shown in Fig. 1, the modes with high azimuthal mode number m are located around the undistorted equatorial region. The resonant mode shape shows the amount of the distortion from the lineshape of the peak towards longer wavelength. Our shape fit with a decreased number of azimuthal modes (m = 0 to 16) reveal that the plateau is caused by the high m modes. The effect of radiation pressure on the WGM lineshape was found to be even more pronounced for the MF microsphere with 5 bi-layers of PE (Fig. 4(c) and 4(d)). The laser output power in this measurement was 5 mW. The graph in Fig. 4(d) clearly shows the splitting of the TE modes into two peaks with almost equal intensities. The spheres for this experiment were treated with NaCl solution for increased softening of the PE layer. As a result, the splitting was achieved at lower excitation power with only 1/3 of the power used in the case of the 4 bi-layer spheres (Fig. 4(a) and 4(b)), which were not treated with the NaCl solution. The softening allows us to excite the samples with lower laser intensity to avoid thermal damage and photodegradation of the CdTe QDs. Applying the same simulation procedure for a peak of the spectrum in Fig. 4(d) as shown in the graph on the right hand side of Fig. 6, the ellipticity was determined to be e = 5.0 ⋅ 10-3.
4. Conclusion
We present a novel method to control the optical resonances in a spherical microcavity. The azimuthal mode degeneracy was lifted through distortion of the spherical shape of the microcavity coated with a soft PE shell and CdTe QDs. Applying radiation pressure results in localised shell shape distortion and splitting of the resonance peaks. The peak shape was modelled on analytical expressions for a distorted sphere demonstrating very good agreement with the measurements.
Acknowledgments