The impact of customer experience on brand loyalty in
the hotel domain
Author: Xi Yu
University of Twente
P.O. Box 217, 7500AE Enschede
The Netherlands
ABSTRACT,
Purpose - In the hotel domain, brand loyalty is a crucial construct in business success. In order to
access high brand loyalty from the customers, it is necessary to understand whether the customer
experience with the company plays an important role.
There are multiple pieces of literatures
examined the correlation between customer experience and brand management field, however, there
have only been a small number of studies that have explored branding in a hotel context
, even fewer
specified to discuss the relationship between customer experience and brand loyalty. This thesis is
conducted to fill in this gap.
Methodology - An online survey is designed and the data is analyzed with partial least squares
(PLS) modeling. The three-stage approach is taken advantage of in ADANCO.
Results - The customer experience with the company has a significant positive impact on brand
loyalty in the hotel domain. Among the three constituents of the customer experience, the
servicescape and the employee service have a positive impact on the customer experience with the
company, while the core service is the least for the customers to considerate.
Value - This thesis provides a deeper insight into the hotel managers and fill in the gap to test the
impact of customer experience on brand loyalty in the hotel domain.
Graduation Committee members:
1st supervisor: Prof. dr. ir. J
örg
Henseler
2nd supervisor: Dr. Mauricy Alves da Motta Filho
Keywords
Customer experience, Brand loyalty, Hotel domain, Core service, Servicescape, Employee service .
This is an open access article under the terms of the Creative Commons Attribution License, which permits use, distribution and reproduction in any
1.
INTRODUCTION AND RESEARCH
QUESTION
1.1 Introduction
The hotel industry is a representative example of a service industry in which brands play an essential part in business success (Berry, 2000). It has been recognized that a well-known hotel brand can increase shareholder value and develop competitive advantages (Morgan, 1997). To create brand loyalty and resonance, customers’ experiences with the product must at least meet, if not actually surpass, their expectations (Keller, 2003).Hotel guests select hotels on the basis of brands, which are seen as an implied promise of the service they can expect (Xu & Chan, 2010). There are multiple pieces of literatures that examined the correlation between customer experience and the brand management field, however, there have only been a small number of studies that have explored branding in a hotel context (Kayaman & Arasli, 2007). Therefore, in order to provide a deeper insight to the hotel managers, this thesis is purposed to fill in the gap to test the impact of customer experiences on brand loyalty in the hotel domain and to give a brief overview of the customer experience and brand loyalty literatures.
As attention to customer experience in the hotel industry is rising, it is necessary for hotel managers to understand the impact of customer experience on brand loyalty. With the growing attention of this relationship in the hotel domain, there are many literatures that paid attention to the effect of customer experience on brand-related concepts. However, since a large portion of the existing papers focused on brand equity factor, there are a small number of them that specifically explained the relationship between customer experience and brand loyalty, even fewer papers provided examining the link in hotel domain. Customer experience with the company has a direct effect on brand meaning, the brand meaning has a direct effect to the brand equity (Berry, 2000), the model is attached in Appendix B. Brand meaning refers to the customer’s dominant perceptions of the brand based on Berry, which is broad. Compare to Aaker’s model in Appendix A (Aaker, 1991), brand equity is decomposed into more specific sets and claimed that brand loyalty is deemed to be the core of brand equity. This thesis is purposed to extract these two models and fill in the gap to focus on the correlation between customer experience and brand loyalty in the hotel industry context.
1.2 Research question
The research question is stand on most of the “SMART” criteria, which represented specific, measurable, achievable, relevant. But the time-related is not applicable in this thesis because the goal of this thesis is to test the correlations. The research question is: “To what extent does customer experience impact on brand loyalty in the hotel domain?”
2. LITERATURE REVIEW AND
THEORETICAL FRAMEWORK
2.1 Literature review
2.1.1 Customer experience
Customer experience is the multidimensional takeaway impression or outcome formed by people’s encounters with products, services and business (Lewis & Chambers, 2000). It can be described as the internal and subjective response customers have to any direct or indirect contact with a company (Meyer & Schwager, 2007). As the commodities are no longer only representing physical tangible products, but also include intangible experiences nowadays, the concept of customer experience is more complicated than before. Companies which embark on creating customer experiences focus not only on the product or service but on the entire customer experience (Yuan & Wu, 2008).
There are multiple models and theories which provide an interpretation of this concept. Berry’s service-branding model pointed out that customer experience with a company has a direct impact on brand meaning, then the brand meaning effects on brand equity. Berry’s model emphasis on customer experience in building service brands can be explained by the fact that the customer’s perception of a service brand, while initially shaped by the marketing department through external communication, ultimately rests on employee-customer interaction and the consistency of service delivery that is managed internally within the service firm (McDonald & Harris, 2001). Customer experience consists of core service, servicescape and employee service (Grace & Ocass, 2004). Another argument about this concept is that the atmospheric stimuli composed of the physical environment and human interaction dimensions are generally at the core of customer experiences (Ritchie & Hudson, 2009). Although the constituents are expressed differently in various literatures, it is widely accepted that customer experience is crucial to brands.
2.1.2 Brand loyalty
Perhaps the most elaborate conceptual definition of brand loyalty is that brand loyalty is the biased, behavioural response, expressed over time, by some decision-making unit, with respect to one or more alternative brands out of a set of such brands, and is a function of psychological (decision-making, evaluative) processes (Jacoby & Chestnut, 1978). While in the hotel domain context, brand loyalty is defined as a biased response, expressed over time, to one or more hotel brands within a set of such brands (Dick & Basu,1994).
The brand equity is viewed as a combination of five dimensions: brand awareness, brand association, perceived quality, brand loyalty and other proprietary assets (Aaker, 1991). It has been suggested that brand loyalty is a determining factor of customer-based brand equity, as well as a strategic asset for companies (Gil, Andres & Salinas, 2007). There exists research about the relationship between brand equity and firms’ performance in luxury hotels and chain restaurants (Kim & Kim, 2005). The result was given that brand loyalty, brand awareness, and perceived quality have a significant positive effect on firms’ performance, moreover, the brand loyalty had a significant positive effect on the performance of only luxury hotel firms.
2.2 Theoretical framework and hypotheses
Unlike the tangible physical products which can be assessed directly by the visible factors of the brand, service providing is more complicated as it involves a combination of processes, people and facilities (Grace & Ocass, 2004). Hotel industry as a typical service offering industry is influenced by these factors. As there are too many potential influencers on customer experience with the company in the hotel industry context, it is not possible to take every component into account. Therefore, core services, employee service and servicescapes as significant contributors to service experience are focal in this context (Grace & Ocass, 2004).
The core service and employee service are different. Core service is defined as the process by which the service is delivered, whereas the employee service refers to the behaviours or performances of the employees in the delivery of the service (Johns, 1999). Servicescape is interpreted as not only providing valuable tangible brand clues prior to purchase, but it is also an important dimension of service experience due to its impact on customers during consumption (Grace & Ocass, 2004). Furthermore, a conceptual model was proposed for the structure of customer experience, which categorized the customer experiences that are derived through a unique combination of responses to physical environment dimensions and human interaction dimensions (Wallset al., 2011). This model not only supported the assumption from Grace and Ocass but also included personal trip-related factors inside. Thence, the following hypotheses are formulated:
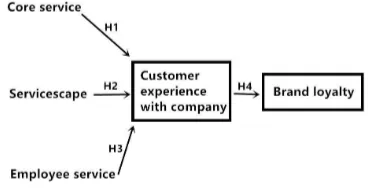
H1: The core service which is provided by the hotel has a positive impact on the satisfaction of customer experience with the company.
H2: The servicescape which is provided by the hotel has a positive impact on the satisfaction of customer experience with the company.
H3: The employee service which is provided by the hotel has a positive impact on the satisfaction of customer experience with the company.
As stated by Berry’s service-branding model, there is a relationship between customer experience with company and brand equity, while Aaker’s model explained the relationship between brand loyalty and brand equity. The satisfaction of
customer experience is a crucial influencer in this relationship as well (Nam et al., 2011). Hence, the following hypotheses:
H4: The satisfaction of customer experience with the company has a positive impact on brand loyalty.
[image:3.596.321.505.160.254.2]The conceptual model is adjusted and displayed in Figure 1:
Figure 1. Conceptual model
3. METHODOLOGY
3.1 Design
The adoption of this data-collection method was due to the need to measure the focal constructs of the model, as well as the extensive use of survey methodology in previous studies examining customer branding (Grace & Ocass, 2005). The survey has the advantage of being capable of collecting data from a large number of respondents, regardless of geographical barriers. Furthermore, it is easier to analyze the data with statistical software, etc. To measure customer experience with hotel brands, it is suitable to apply survey methodology and conduct a questionnaire since the number of respondents are expected to be large. In that case, a survey consisted of 22 questions, which involved questions about core services, servicescape, employee services and brand loyalty, and is applied in this thesis which can be found in Appendix C. Moreover, the hypotheses are formulated into a one-sided test, thus the one-sided p-value needs to be checked.
3.2 Measures
The variables which are measured in this thesis are core services, servicescape, employee service, customer experience with company and brand loyalty in the hotel domain. The 7-point Likert-scale from strongly disagree to strongly agree is applied in the survey.
The customer experience with the company is examined by the core service, servicescape and employee service provided by the hotel which is on the base of the literature from Grace and Ocass as illustrated in the theoretical framework.
The brand loyalty is deliberated by three questions: “I will recommend this brand to someone who seeks my advice”, “Next time I will stay in this brand” and “ I will switch to other brands if experience a problem with this brand” (Nam et al., 2011).
3.3 Respondents
hotel. People with an age of 18 usually have a relatively physical and psychological maturity, with subjective judgement. In the past 3 weeks, 229 respondents filled in the survey, while 3 of them did not have an experience of staying in a hotel before, so the valid database would be 226 respondents. The data is collected online by means of multiple ways that are elaborated in 3.4 procedure part, the respondents are from different nationalities and cultural backgrounds since the data is collected randomly.
[image:4.596.310.545.71.225.2]Nearly 77.9% of the respondents stay in a hotel for 1~5 times per year, 12.8% of the respondents stay in a hotel for 6~10 times per year, 4.4% of them stay in a hotel for 11~15 times per year, and the rest of 4.9% of them stay in a hotel for more than 15 times per year. Figure 2 gives a bar chart of the frequency distribution.
Figure 2. Frequency
For gender, 35.2% of the respondents are male, while 62.1% of them are female. The rest of 2.6% of respondents prefer not to say their gender. The specific data can be found in Figure 3.
Figure 3. Gender
[image:4.596.55.287.266.419.2]Among all the respondents in Figure 4, there are around 64.6% of them that are 18-25 years old, which occupied more than half of the total respondents. Almost 25.7% of them are 26-35 years old, 3.1% of them are 36-45 years old, 3.1% of them are 46-55, 1.8% of them are 56-65 and 1.8% of them do not want to tell their ages.
Figure 4. Age
3.4 Procedure
The data was collected through the internet, by taking advantage of multiple ways which provide randomly-selected data source in order to reduce the bias and get sufficient data: facebook dissertation survey exchange, WhatsApp groups, Wechat groups, survey forums such as “SurveyCircle”, “SurveySwap” and so on. The questionnaire is formulated with Google Forms.
The conceptual model is operated by ADANCO, a three-stage approach (van Rielet al., 2017) is applied while testing and the data can be examined by Partial least squares (PLS) regression because this model tries to find the multidimensional direction in the X space that explains the maximum multidimensional variance direction in the Y space which is most appropriate in this case.
The first stage is to estimate the model with the second-order construct not included with “Mode A consistent” in ADANCO, the second stage is to include the second-order construct in the model with “Mode B” in ADANCO, the third stage is to resemble the second stage to obtain consistent estimates for the structural model including the relationships between the first-order common factors and the second-order composite (van Riel et al., 2017). Thus, the impacts of core service, servicescape and employee service on brand loyalty are examined in the first stage. After that, the customer experience with the company is added in the second stage. Finally, the correlations of the model are corrected for attenuation and make it consistent.
4. DATA COLLECTION AND ANALYSIS
4.1 Reliability of the data
First of all, by means of Cronbach’s alpha, it is possible to check whether the indicators of constructs are reliable (Mazzocchi, 2008). As Figure 5 displayed, the outcome of the data is not fully reliable as there is one indicator with a negative value, that causes the value of Cronbach’s alpha of brand loyalty to become 0.3650 in Figure 6, which is lower than 0.7 (Hair et al., 2006).
[image:4.596.55.289.464.615.2]loyalty in this question, but in other questions, a larger score implies better brand loyalty. Therefore, this set of data needs to be deleted.
Figure 5. The conceptual model with a negative indicator
Figure 6. Construct reliability
4.2 The three-stage approach
The three-stage approach is a new PLS-based approach to consistently estimate and test hierarchical constructs that are composed of reflective first-order constructs ( van Rielet al., 2017). The following data analysis is relying on this approach.
4.2.1 Stage 1
Step 1: estimating the model without second-order
[image:5.596.93.237.487.657.2]
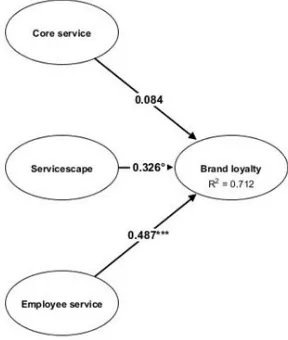
composite
Figure 7 explained the impacts of core service, servicescape and employee service on brand loyalty. The employee service has the strongest influence on the brand loyalty with a correlation of 0.487, following by the servicescape with a correlation of 0.326, and the core service has the lowest influence with a correlation of 0.084.
Figure 7. Conceptual model without second-order composite
Step 2: assessing model fit
PLS path modeling can be both explanatory and predictive research (van Rielet al., 2017). Based on the aim of this thesis, the research is explanatory research, thus the model assessment should be focused. Since the data is collected globally by different means as elaborated in respondents section, PLS provides consistent estimates for factor and composite models,
it is possible to meaningfully compare the model-implied correlation matrix with the empirical correlation matrix, which opens up the possibility for the assessment of global model fit (van Rielet al., 2017).
On the one hand, a study suggested that a model with an SRMR value less than 0.05 can be regarded as an acceptable model fit (Byrne, 2008), while another proved that even entirely correctly specified model can yield SRMR value of 0.06 and higher (Henseleret al., 2014). Overall, the model with an SRMR value of less than 0.08 is argued as reasonable by different researchers (Hu & Bentler, 1999; Henseler et al., 2016). The SRMR value, in this case, is 0.0623, which indicates the discrepancy between the model-implied and the empirical correlation matrix is acceptable. The bootstrap-based 95% (HI95) SRMR value is 0.053 and the bootstrap-based 99% (HI99) SRMR value is 0.062. Because all the SRMR values are less than the standard value of 0.08, it is likely that the model is true.
On the other hand, the geodesic discrepancy value is 0.461, HI95 of the geodesic discrepancy is 0.395, HI99 of the geodesic discrepancy is 0.806. As these values are lower than the allowed value of 5 percent (Bollen & Stine, 1992; Henseler et al., 2016), it is likely that the sample data stems from a population that functions according to the hypothesized model. The goodness of model fit (estimated model) output can be found in Appendix D.
Step 3: extracting composite scores
The scores of the first-order constructs calculated by ADANCO are extracted into Excel. These scores will be used in Stage 2 as variables. In addition, in Figure 8, the table of direct effects inference includes multiple information: the original coefficient, the standard bootstrap results and the percentile bootstrap quantiles.
Figure 8. Direct effects inference
Step 4: recording reliability indices and producing
the consistent inter-construct correlation matrix
The Dijkstra-Henseler’s rho (ρA) is used to estimate the reliability of construct scores pertaining to a reflective measurement model, if the value is higher than 0.7, the internal consistency can be considered as reliable (Dijkstra and Henseler, 2015b). In Figure 9, the Dijkstra-Henseler’s rho (ρA) of brand loyalty is 0.887, core service is 0.917, servicescape is 0.8356 and employee service is 0.913. All of the values exceed the threshold, 0.7, so they can be regarded as reliable.
Figure 9. Dijkstra-Henseler’s rho (ρA)
The Inter-Construct correlations table is demonstrated in Figure 10 for the sake of manually determining the reliability of the second-order construct in Step 7.
4.2.2 Stage 2
Step 5: estimating the model without first-order
constructs
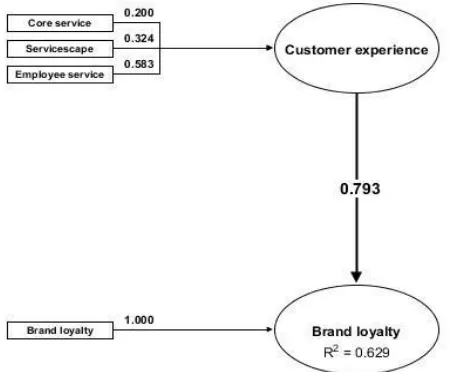
In this step, the correlation between the customer experience and the brand loyalty is tested and the test result is 0.773 in Appendix E. The weight for core service, servicescape and employee service are respectively 0.200, 0.325 and 0.583.
Step 6: assessing model fit
The SRMR value, in this case, is 0, which is much lower than the adoptable criteria of 0.08. the bootstrap-based 95% (HI95) SRMR value is 0 and the bootstrap-based 99% (HI99) SRMR value is 0. These values provide a sufficient indication that the model is likely to be true.
The geodesic discrepancy value is 0, HI95 of the geodesic discrepancy is 0, HI99 of the geodesic discrepancy is 0, they are all lower than the benchmark of 5 percent. The values are elaborated in Appendix F. Therefore, it is acceptable to conclude that the model is reliable.
Step
7: determining the reliability of the
second-order composite
To estimate the reliability for each indicator of the composite as well as weight estimates, a simplified version of Mosier’s (1943) equation for determining the reliability of a weighted composite ρS = w’ S*w can be applied (van Riel et al., 2017). The empirical correlation matrix as one of the components is attached in Appendix G. The calculation is done in excel and the process is in Appendix H and the reliability scores 0.949603124.
4.2.3 Stage 3
Step
8:
re-estimating
the
model
with
reliability-adjusted single indicators
The scores obtained in the first-order constructs are used as indicators in order to keep the model consistent. After correcting the composite for disattenuation, the re-estimated model with reliability-adjusted indicators is set out in Figure 11.
Figure 11. the re-estimated model with reliability-adjusted indicators
Step 9: obtaining consistent path coefficients and
confidence intervals
[image:6.596.324.539.315.428.2]After the modification, the path coefficient between customer experience with the company and brand loyalty is 0.793. The direct effects inference table (Figure 12) notes the information that the t-value is higher than 1.96, while the p-value is smaller than α=0.05 (Ocass & Julian, 2003), which means that the data are statistically significant and all the constructs here have a significant impact on their related latent variables in this context.
Figure 12. Direct effects inference
A standard value for R Square is 0.10 (Falk & Miller, 1992). Since the R Square is 0.629 and the adjusted R Square is 0.628, both of them are larger than 0.10, thus the model fits the data and the endogenous construct is adequately explained by the set of exogenous constructs.
[image:6.596.58.283.513.699.2]4.2.4 Final results
Figure 13. The conceptual model with path coefficient results
The main findings from the data analysis in Figure 13 are that the employee service plays a crucial role in customer experience with the company, and the weight is 0.583. Servicescape has a relatively high weight of 0.324, while the core service only has extremely limited weight of 0.200. Referring back to the research question, customer experience has a positive impact on brand loyalty in the hotel domain with a path coefficient of 0.793, which is quite enormous.
4.3 Results of hypotheses
service) and brand loyalty are tested in Stage 1, hence, hypotheses 1 to 3 can also be explained.
The t-value between the core service and brand loyalty is 0.689 which is smaller than 1.96, and the p-value is 0.246 which is larger than 0.05, therefore, there is no significant relationship between core service and brand loyalty, Hypotheses 1 is rejected.
The t-value of servicescape and brand loyalty is 1.937, slightly smaller than 1.96, while the p-value is 0.026, smaller than 0.05. Since it is a one-sided test, Hypotheses 2 is accepted.
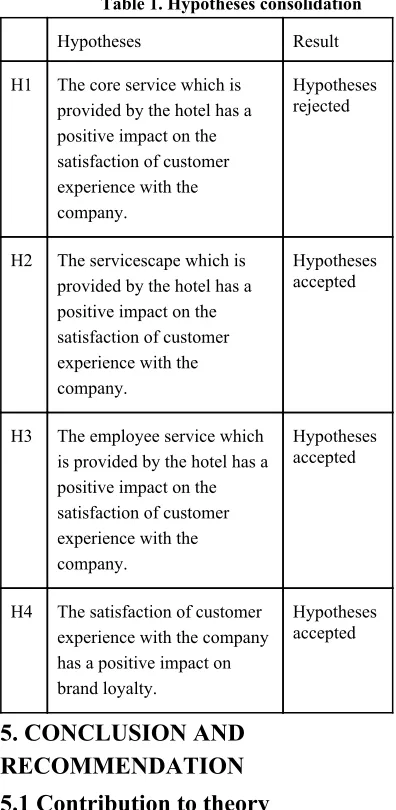
[image:7.596.54.252.255.660.2]There is a significant relationship between employee service and brand loyalty because the t- value is 4.301 and the p-value is smaller than 0.05. Thus, Hypotheses 3 could be accepted. Table 1 issues the summary of the hypotheses acceptions.
Table 1. Hypotheses consolidation
Hypotheses Result
H1 The core service which is provided by the hotel has a positive impact on the satisfaction of customer experience with the company.
Hypotheses rejected
H2 The servicescape which is provided by the hotel has a positive impact on the satisfaction of customer experience with the company.
Hypotheses accepted
H3 The employee service which is provided by the hotel has a positive impact on the satisfaction of customer experience with the company.
Hypotheses accepted
H4 The satisfaction of customer experience with the company has a positive impact on brand loyalty.
Hypotheses accepted
5. CONCLUSION AND
RECOMMENDATION
5.1 Contribution to theory
With the rise of the tertiary industry, the hotel industry, as a representative example of a service industry, is more concerned about the customer experience with the company and brand loyalty.
As mentioned in the previous sections, there are plenty of literatures that gave sufficient explanations and discussions about the correlation between customer experience and brand management field, but there are not too many literatures mainly focused on the relationship between customer experience and
brand loyalty, especially in a hotel context. One of the purposes of this thesis is to fill in this gap and confirm the importance of the customer experience with the company on brand loyalty in the hotel domain.
In this thesis, a literature review related to customer experience and brand loyalty is provided, and the most relevant factors of customer experience (the core service, servicescape and employee service) are focused. For the data collection, 226 randomly selected respondents from different cultural backgrounds filled in the online survey. The PLS path modeling is used and the three-stage approach is applied to analyze the survey data.
Relying on the results of this thesis, customer experience has a significant positive impact on brand loyalty in the hotel domain. The core service does not have a significant influence on customer experience with the company, while the servicescape and the employee service proved to have a crucial positive impact on customer experience with the company.
Although some researchers empirically suggested that core service can be validated as a significant contributor of customer experience with the company in the hotel domain (So & King, 2010), what customers care about is changing in the past decade. It is imperative to keep on the pace of the customer needs and their expectations.
5.2 Contribution to practice
Based on the findings of this thesis, it could be necessary for the hotel managers to pay more attention to how to improve the customer experience with the hotel in order to gain a higher level of brand loyalty.
Moreover, among the three constructs which affect the customer experience with the company, the factor of the employee service has the strongest influence and indicates that the customers are caring more about the servicescape and especially the employee service in the hotel experience nowadays. Compared to the constructors above, the core service is less important, but it does not mean that this factor can be neglected because it still occupies 0.200 in the weights. This phenomenon could be attributed to the popularity of the internet that makes the data of the hotel more accessible for the customers. For example, the pictures of the hotel and the cleanliness of the room, the size of the bed, etc. The customers can get the information about the hotel accurately and easily through the internet, which means they already know what to expect before they arrive at the hotel. Nevertheless, the employee service factor is more complicated that is hard to be measured and observed online. Even though there are many reviews about the employee service of the hotels on the websites like booking.com or TripAdvisor, but just as Shakespeare said “There are a thousand Hamlets in a thousand people's eyes”, people’s feelings of the employee service of the hotel can be different for a variety of reasons. Other people’s reviews would only provide some suggestions, and that may differ from what the customers really experienced in the hotel. Consequently, the customers’ expectations about the employee service of the hotel would be vague before they really experienced that, which could lead to the employee service is the dominant indicator of the customer experience with the hotel.
To sum up, the problem of how to improve the servicescape and the employee service of the hotel could be the major questions for the hotel managers to obtain a higher satisfaction of customer experience and the brand loyalty.
5.3 Limitations
There are several limitations of this thesis. First of all, the finite time causes the restriction of the database. Secondly, because of the ambitious aim of the quantity of the samples, it is vital to try multiple ways to reach the respondents. However, taking advantage of the Whatsapp group and Wechat group may lead to the disadvantage of snowball sampling biases. Thirdly, brand loyalty is a part of brand equity (Aaker, 1991), customer experience with the company is only an element of brand meanings which also has a direct impact on brand equity (Berry, 2000). As the paper is limited by personal research ability, the theoretical framework is only centred a small part of this area and despite other possible influencers that might lead to biases.
6. REFERENCES
1. Aaker, D. A. (1991). Managing brand equity:
Capitalizing on the value of a brand name . New
York, NY: Free Press.
2. Berry, L. L. (2000). Cultivating Service Brand Equity. Journal of the Academy of Marketing
Science,28(1), 128-137.
doi:10.1177/0092070300281012
3. Bollen, K. A., & Stine, R. A. (1992). Bootstrapping Goodness-of-Fit Measures in Structural Equation Models. Sociological Methods & Research,21(2), 205-229. doi:10.1177/0049124192021002004 4. D., D. V., Velleman, P. F., & Bock, D. E. (2016).
Stats: Data and models. Boston: Pearson.
5. Dick, A. S., & Basu, K. (1994). Customer Loyalty: Toward an Integrated Conceptual Framework.
Journal of the Academy of Marketing Science,22 (2),
99-113. doi:10.1177/0092070394222001
6. Dijkstra, T. K., & Henseler, J. (2015). Consistent Partial Least Squares Path Modeling. MIS
Quarterly,39(2), 297-316.
doi:10.25300/misq/2015/39.2.02
7. Falk, R. F., & Miller, N. B. (1992). A primer for soft
modeling. Akron, OH: University of Akron Press.
8. Gil, R. B., Andrés, E. F., & Salinas, E. M. (2007). Family as a source of consumer -based brand equity.
Journal of Product & Brand Management,16(3),
188-199. doi:10.1108/10610420710751564
9. Grace, D., & Ocass, A. (2004). Examining service experiences and post-consumption evaluations.
Journal of Services Marketing,18(6), 450-461.
doi:10.1108/08876040410557230
10. Grace, D., & OCass, A. (2005). Service branding: Consumer verdicts on service brands. Journal of
Retailing and Consumer Services,12(2), 125-139.
doi:10.1016/j.jretconser.2004.05.002
11. Hair, J. F., Black, W. C., Babin, B. J., & Anderson, R. E. (2006).Multivariate data analysis. Upper Saddle River, NJ: Pearson Education.
12. Henseler, J., Dijkstra, T. K., Sarstedt, M., Ringle, C. M., Diamantopoulos, A., Straub, D. W., Calantone, R. J. (2014). Common Beliefs and Reality About PLS.
Organizational Research Methods,17(2), 182-209.
doi:10.1177/1094428114526928
13. Henseler, J., Hubona, G., & Ray, P. A. (2016). Using PLS path modeling in new technology research: Updated guidelines. Industrial Management & Data
Systems,116(1), 2-20.
doi:10.1108/imds-09-2015-0382
14. Hu, L., & Bentler, P. M. (1999). Cutoff criteria for fit indexes in covariance structure analysis: Conventional criteria versus new alternatives.
Structural Equation Modeling: A Multidisciplinary
Journal,6(1), 1-55. doi:10.1080/10705519909540118
15. Jacoby, J., & Chestnut, R. W. (1978). Brand loyalty
measurement and management. New York: Wiley.
16. Johns, N. (1999). What is this thing called service?
European Journal of Marketing,33(9/10), 958-974.
doi:10.1108/03090569910285959
17. Kayaman, R., & Arasli, H. (2007). Customer based brand equity: Evidence from the hotel industry.
Managing Service Quality: An International
Journal,17(1), 92-109.
doi:10.1108/09604520710720692
18. Keller, K. L. (2003).Strategic brand management:
Building, measuring, and managing brand equity.
Upper Saddle River, NJ: Prentice Hall.
19. Kim, H., & Kim, W. G. (2005). The relationship between brand equity and firms’ performance in luxury hotels and chain restaurants. Tourism
Management,26(4), 549-560.
doi:10.1016/j.tourman.2004.03.010
20. Lewis, R. C., & Chambers, R. E. (2000). Marketing
leadership in hospitality: Foundations and practices .
New York: John Wiley & Sons.
21. Mcdonald, M. H., Chernatony, L. D., & Harris, F. (2001). Corporate marketing and service brands -Moving beyond the fast-moving consumer goods model. European Journal of Marketing,35(3/4), 335-352. doi:10.1108/03090560110382057
22. Meyer, C., & Schwager, A. (2007, February 01). Understanding customer experience. Harvard
Business Review. Retrieved from
https://hbr.org/product/understanding-customer-exper ience/R0702G-PDF-ENG
23. Mazzocchi, M. (2008). Statistics for Marketing and
Customer Research. London: Sage.
24. Morgan Stanley (1997). Globalization: The Next
Phase in Lodging . New York, NY: Morgan Stanley
report..
25. Nam, J., Ekinci, Y., & Whyatt, G. (2011). Brand equity, brand loyalty and consumer satisfaction.
Annals of Tourism Research,38(3), 1009-1030.
doi:10.1016/j.annals.2011.01.015
26. Ocass, A., & Julian, C. (2003). Examining firm and environmental influences on export marketing mix strategy and export performance of Australian exporters. European Journal of Marketing,37(3/4), 366-384. doi:10.1108/03090560310459005.
27. Ritchie, J. R., & Hudson, S. (2009). Understanding and meeting the challenges of consumer/tourist experience research.International Journal of Tourism
Research,11(2), 111-126. doi:10.1002/jtr.721
28. So, K. K., & King, C. (2010). “When experience matters”: Building and measuring hotel brand equity.
International Journal of Contemporary Hospitality
Management,22(5), 589-608.
doi:10.1108/09596111011053765
constructs using consistent partial least squares: The case of second-order composites of common factors.
Industrial management & data systems, 117(3),
459-477. doi:10.1108/IMDS-07-2016-0286
30. Walls, A., Okumus, F., Wang, Y., & Kwun, D. J. (2011). Understanding the Consumer Experience: An Exploratory Study of Luxury Hotels. Journal of
Hospitality Marketing & Management,20(2),
166-197. doi:10.1080/19368623.2011.536074 31. Xu, J. B., & Chan, A. (2010). A conceptual
framework of hotel experience and customer -based brand equity.International Journal of Contemporary
Hospitality Management,22(2), 174-193.
doi:10.1108/09596111011018179
32. Yuan, Y. E., & Wu, C. K. (2008). Relationships Among Experiential Marketing, Experiential Value, and Customer Satisfaction. Journal of Hospitality &
Tourism Research,32(3), 387-410.
doi:10.1177/1096348008317392
7. APPENDICES
Appendix A. Brand equity model (Aaker,
1991)
Appendix B. Service-branding model (Berry,
2000)
Appendix C. Questionnaire
Basic info
1. How often do you in a hotel? - I have never stayed in a hotel - 1~5 times per year
- 6~10 times per year - 11~15 times per year - More than 15 times per year
The following are scale questions. “1” is “Strongly disagree”, “7” is “Strongly agree”.
Core service
Please recall your last hotel stay. The following questions are related to the core service in the hotel. For example: the reception desk, the cleanness of the room, etc.
2. The core service of the hotel suits my needs. 3. The core service of the hotel Is reliable. 4. The core service of the hotel is superior. 5. The core service of the hotel.
6. The core service of the hotel is quality.
Servicescape
Please recall your last hotel stay. The following questions are related to the servicescape in the hotel. For example, the swimming pools, the restaurant chairs, etc.
7. The facilities in the hotel are up-to-date facilities. 8. Facilities in the hotel are attractive.
9. The hotel employees are dressing neatly.
10. The facilities in the hotel suit the service type. (For example, if you got the information via the internet that this hotel has special facilities/ services, you wanted to try them and booked the hotel. After you arrived in the hotel, are these facilities/services the same as you expected?)
Employee service
11. The hotel employees provided prompt service. 12. The hotel employees were willing to help. 13. The hotel employees were never too busy for me. 14. I can trust the employees.
15. I feel safe in transactions. 16. The hotel employees were polite.
17. The hotel employees gave personal attention. (For example, if you took your child with you to the hotel restaurant, the employees will bring a special chair for your child, etc.)
Brand loyalty
18. I will recommend this hotel brand to someone who seeks my advice.
19. I will stay in this hotel brand next time.
20. I will switch to other brands if I experience a problem with this hotel brand.
Personal information 21. What is your gender? - Female
- Male