University of Warwick institutional repository: http://go.warwick.ac.uk/wrap
This paper is made available online in accordance with
publisher policies. Please scroll down to view the document
itself. Please refer to the repository record for this item and our
policy information available from the repository home page for
further information.
To see the final version of this paper please visit the publisher’s website.
Access to the published version may require a subscription.
Author(s): K. T. D. EAMES
Article Title: Contact tracing strategies in heterogeneous populations
Year of publication: 2007
Link to published version: http://dx.doi.org/
10.1017/S0950268806006923
Contact tracing strategies in heterogeneous populations
K. T. D. E A M E S *
Department of Biological Sciences and Mathematics Institute, University of Warwick, Coventry, UK
(Accepted 25 April 2006; first published online 20 July 2006)
S U M M A R Y
Contact tracing is a well-established disease control measure that seeks to uncover cases by following chains of infection. This paper examines mathematical models of both single-step and iterative contact tracing schemes and analyses the ability of these procedures to trace core groups and the sensitivity of the intervention to the timescale of tracing. An iterative tracing process is shown to be particularly effective at uncovering high-risk individuals, and thus it provides a powerful public health tool. Further targeting of tracing effort is considered. When the population exhibits like-with-like (assortative) mixing the required effort for eradication can be significantly reduced by preferentially tracing the contacts of high-risk individuals ; in populations where individuals have reliable information about their contacts, further gains in efficiency can be realized. Contact tracing is, therefore, potentially an even more potent tool than its present usage suggests.
I N T R O D U C T I O N
Contact tracing is a sophisticated control measure, applicable to a wide range of infectious diseases. It has been used to combat infections such as smallpox, SARS, tuberculosis, and a large number of sexually transmitted diseases (STDs) [1–9]. Unlike common control tools such as vaccination or public health campaigns, contact tracing is a multi-stage process potentially requiring a large investment of health-care provider time. The first stage of contact tracing requires the diagnosis of an infected index case ; then any likely contacts of this index case must be deter-mined, notified, and treated ; any contacts sub-sequently found to be infected become new index cases and the process is repeated [1, 4, 9]. Because of the time and resources that contact tracing requires,
mathematical models can be useful in attempting to understand and explain when and whether contact tracing is a successful strategy.
Previous modelling work has investigated the use of contact tracing in the context of a number of infectious diseases, in particular smallpox [5, 10–13] and STDs [6, 14–17]. In the latter instance contact tracing has been applied for many years whereas in the former it is under consideration as an emergency measure to deal with a new outbreak of infection. It has been suggested that, when symptoms can be easily identified and when contact tracing can be carried out iteratively and rapidly, it can be a highly effective measure [15–17]. In the case of STDs, contact tracing is particularly useful for uncovering asymp-tomatic cases (which can, nevertheless, be identified in the laboratory), thus providing a way of treating individuals who would otherwise remain infectious in the population [18].
The extent to which the idealized contact-tracing procedure described above is possible varies with * Author for correspondence : Dr K. T. D. Eames, Department
of Biological Sciences and Mathematics Institute, University of Warwick, Gibbet Hill Road, Coventry CV4 7AL, UK.
circumstances and with the characteristics of the infection against which it is used. For instance, when there is no curative treatment available identified cases may need to be quarantined rather than treated [13]. If there is no quick and reliable diagnostic test it may be necessary to isolate all contacts, whether infected or not, until the emergence, or otherwise, of symptoms demonstrates their infection status [5, 10]. These time delays and the large numbers of patients involved make it difficult to maintain chains of contact tracing and to trace quickly in such circumstances.
In this paper we consider the factors that make contact tracing successful and examine the robustness of the intervention when these factors are removed. We focus specifically on the iterative properties of contact tracing and the speed at which contacts can be notified. We consider the possibility of further targeting tracing efforts. In certain circumstances, by preferentially tracing particular contacts, the inter-vention effort required to eradicate infection can be reduced.
M E T H O D S
Contact tracing is intrinsically linked to networks of interactions within populations, such as sexual partnership networks for STDs [7, 19–21]. Trans-mission of infection takes place through inter-person connections [6, 7, 19–22] and these established links also allow the progress of infection to be traced. We define a mixing network to be the set of all individuals and all links between individuals that could allow transmission of infection – a sexual mixing network
would contain information about sexual partnerships (Fig. 1). Contact tracing cannot be attempted without knowledge of the contacts of an individual, whether social or sexual, and obtaining this information is a vital step in the tracing process ; we therefore use network modelling methods to study this intervention. We use pair-wise models [23] as a robust method of representing epidemics within a mixing network. Pair-wise models treat connected pairs of individuals as their basic variable and therefore lie between the more usual random mixing approaches [24, 25] and full stochastic simulations of complete networks [12, 26]. By explicitly modelling the essential unit of disease transmission – an interaction between an in-fected and a susceptible individual – pair-wise models are able to include the mixing behaviour observed in networks and can capture, to a large extent, the spread of infection on networks. Although they cannot include much of the large-scale structure of net-works, pair-wise models can capture the local network structure, which is of primary importance in disease transmission, and they have been demonstrated to be accurate and adaptable tools [14]. Pair-wise models can readily be parameterized once the distribution of partnerships (who mixes with whom) in the population is known, and therefore do not require complex and time-consuming evaluation of complete mixing net-works. Pair-wise models retain the flexibility of more conventional approaches, and have been adapted to study heterogeneous populations, monogamous interactions, and contact tracing [14, 15, 17, 27, 28].
In this paper we consider simple infections in which individuals can be in one of two states : susceptible or infectious [24, 25]. Individuals become infected at a rate t per infected partner and recover at rate g, following which they are once again susceptible. This form of highly simplified susceptible–infected– susceptible (SIS) model is appropriate for many common STDs such as chlamydia and gonorrhoea [24, 25], and provides a framework within which further complexities can be introduced. Births and deaths are ignored, and the mixing network is assumed to remain fixed. We define the infection parameter, r, via r=t/g. The notation used in this paper is listed in the Table.
We denote by [S] the number of susceptible indi-viduals and by [I] the number of infected individuals, and consider how these numbers will change over time. [I] will decrease owing to recovery and will in-crease when infection is transmitted. Within a mixing network, infection can only spread between network
S I
[image:3.595.74.303.65.208.2]I
neighbours. We denote by [SI] the number of con-nections within the network between a susceptible and an infected individual ; it is only along these connections that infection can be transmitted. We can now form differential equations for the evolution of the numbers of susceptible and infected individ-uals [23] :
d
dt[S]=xt[SI]+g[I], (1) d
dt[I]=t[SI]xg[I]: (2)
To be iterated, we must also calculate how [SI], the number of susceptible–infected pairs, changes over time ; [SI] increases when infection is introduced into a susceptible–susceptible pair (which can take place if one of the susceptibles has an infected partner) or if recovery occurs within an infected–infected pair ; [SI] decreases if the susceptible individual becomes infected – either from within the pair or by an external partner – or if the infected individual recovers.
We can now write a differential equation describing the dynamics of [SI] :
d
dt[SI]=t([SSI]x[ISI]x[SI])+g([II]x[SI]): (3)
Here [SSI] is the number of triples within the network consisting of a central susceptible individual with a susceptible and an infected partner, and [ISI] simi-larly. Within this equation they relate to infection entering the pair of interest from outside. The three pair terms in this equation relate to within-pair
processes (infection or recovery). See Figure 1 for an illustration of these definitions.
As with the equations ford/dt[S] andd/dt[I], new terms, the triples, have been introduced. We could continue the process, modelling these in terms of triples and quadruples, but this would rapidly become unfeasible, requiring both a large number of equations and a great deal of data to parameterize. Instead, in order to close the system, triples are evalu-ated in terms of pairs and singles using the moment closure approximation
[ABC](kx1)[AB][BC]
k[B] , (4)
where A, B, and Ccan represent either S or I. k is the neighbourhood size (i.e. the number of contacts) of the central type-B individual [23]. The approxi-mation is derived as follows : an [ABC] triple requires an [AB] pair ; the B individual in any such pair has (kx1) further contacts. Out of a total ofk[B] contacts of type-B individuals within the population, [BC] are with type-C individuals, thus any one contact has a probability of [BC]/k[B] of being with a type-C
individual. Combining these gives the approximation. The system can easily be extended to consider populations containing individuals with a range of neighbourhood sizes [14] ; the complete set of equa-tions is given in the Appendix.
In this paper we adapt this set of equations to consider two distinct contact tracing approaches : single-step and iterative tracing. In the former case a proportion of the partners of index cases is treated Table. List of notation
Notation Definition
g,t Recovery rate, transmission rate per infectious contact
r Infection parameter,=t/g
[S], [I] Number of susceptible, infected individuals
[SI] Number of susceptible–infected partnerships within the network (numbers of other partnership types represented similarly)
k Neighbourhood size, i.e. number of partners in the mixing network [SSI] Number of susceptible–susceptible–infected triples
(numbers of other triple types represented similarly)
f,fc Fraction of contacts traced, critical fraction to eradicate infection [T] Number of individuals from which tracing is taking place
c,cm Rate of tracing, rate of tracing from individuals withmneighbours
ax1 Duration of the contact tracing process
R0 Basic reproductive ratio : number of secondary cases generated by
one index case in a wholly susceptible population
M Total number of partnerships from each risk group
concurrently with the index patient, thus resulting in the recovery of pairs of individuals ; this is an ap-propriate model for certain STD situations when patients and their partners attend a clinic together, but does not allow infected contacts to become new index cases. The second model includes the iterative behaviour of tracing, with the infected partners of any diagnosed cases being sought for treatment and further tracing ; in the iterative model, contact tracing behaves as a hyperparasite of infection, spreading through the infected portion of the mixing network.
C O N T A C T T R A C I N G
Single-step contact tracing
In this model, briefly introduced elsewhere [14], some fraction, f, of the contacts of an index case receive treatment at the same time as the index patient. Thus, a recovery ‘ event ’ may involve more than one indi-vidual leaving the infected class. Similar single-step approaches have been suggested by other authors [5, 6, 10, 13], particularly in contexts where there is no simple and rapid diagnostic test available and where chains of tracing are, therefore, not seen. It is most applicable in circumstances where formal contact tracing procedures are not carried out but when two individuals in a partnership seek treatment together. The governing equations for single-step
tracing are :
d
dt[S]=xt[SI]+g[I]+fg[II], (5) d
dt[I]=t[SI]xg[I]xfg[II], (6)
the extra recovery term resulting from those occasions when two individuals are treated at once. As above, the system is closed by modelling the dynamics of pairs within the network and applying the moment closure approximation (see Appendix for the com-plete set of equations).
As shown in Figure 2, the additional recovery through contact tracing results in a reduction in equilibrium prevalence. It might be hoped that by sufficiently increasing the tracing fraction single-step tracing can eradicate infection altogether. However, this is not necessarily the case. For example, in a homo-geneous population, in which each individual has
k contacts, eradication is only possiblerk(rk2x
rkx
rx2k)<1. As Figure 3 shows, there is only a relatively small region of parameter space in which single-step tracing can drive infection from the system. When contact tracing is restricted to a single step it can only have a limited effect on the impact of a pathogen.
Iterative contact tracing
The more usual form of contact tacing, as carried out by GUM clinics, is an iterative process : any infected 0 0·5 1·0 1·5 2·0 2·5 3·0 3·5 4·0
0 0·1 0·2 0·3 0·4 0·5 0·6 0·7 0·8 0·9 1·0
Equilibrium prevalence
r
[image:5.595.320.546.67.244.2]Tracing=0% Tracing=10% Tracing=25% Tracing=50%
Fig. 2.Equilibrium prevalence plotted against the infection parameter,r, for a range of tracing fractions,f, in a single-step tracing model,g=1 throughout, withr varied by al-teringt. A heterogeneous network was used to parameterize the model, with individuals of neighbourhood size ranging from 1 to 13.
0 0·5 1·0 1·5 2·0 2·5 3·0 3·5 4·0 2
3 4 5 6 7 8 9 10
r
Neighbourhood size,
[image:5.595.77.301.68.241.2]k
contacts of an index case are treated as new index cases, and their contacts are also sought. In this way contact tracing spreads through the population, following chains of infection. To represent iterative contact tracing this model, introduced in ref. [15], in-cludes an extra tracing class (denoted T) : following treatment individuals enter this tracing class and their contacts are traced. Any successfully traced contacts likewise enter the tracing class. We assume that tracing takes place at rate c and that the tracing process has a duration ax1
, after which individuals return to the susceptible class. The governing equations for numbers in each class are :
d
dt[S]=xt[SI]+a[T], (7) d
dt[I]=t[SI]xc[IT]xg[I], (8) d
dt[T]=c[IT]+g[I]xa[T]: (9)
The c[IT] terms represent contact tracing from individuals in the tracing class, T, leading to the removal of infected individuals into the tracing class. Once again, the dynamics of pairs are modelled explicitly, making use of the moment closure ap-proximation (see Appendix for the complete set of equations). In this model tracing occurs iteratively, with each index case being-capable of generating fur-ther index cases [16, 17, 28] ; the tracing class behaves as a hyperparasite within the system, passing between infected individuals.
We see from Figure 4 that iterative tracing is an effective control measure leading to a large reduction in infection prevalence. Comparing Figures 2 and 4 shows that iterative tracing has a much more dra-matic impact than single-step tracing. As has been shown previously [15, 16], when the tracing process is rapid compared with the dynamics of infection (c and a are much larger than t and g) the critical tracing fraction – the fraction of contacts, fc, that must be traced to eradicate infection – is given by
fc=1x1/R0, where R0 is the basic reproductive ratio – the average number of new cases generated by an infected individual in an otherwise susceptible population. This relationship holds in a wide range of scenarios, including heterogeneous populations and asymptomatic infections [15], and has a relatively simple explanation : for eradication, each infection must generate no more than one untraced case, i.e. (1xfc)R0<1Þfc>(1x1/R0). Immediately a differ-ence between single-step and iterative tracing emer-ges : in the latter case it is always possible to eradicate infection.
Part of the power of contact tracing comes from its ability to target interventions towards the most high-risk parts of the network ; contact tracing involves surveying the partners of infected cases and thus it tends to focus on high-risk individuals. Such individuals, especially when they mix with each other to form high-risk core groups, tend to dominate the dynamics of infection ; disease is concentrated in core groups, particularly when population prevalence is low [25, 29–32]. Contact tracing alters the distri-bution of infection within the population because individuals at highest risk of infection are also the most likely to be traced. We use the mean number of contacts of infected individuals in a heterogeneous network as a measure of the influence of core groups – the higher this number, the more infection is restricted to high-risk individuals – plotted in Figure 5 against equilibrium prevalence to examine how con-tact tracing affects the distribution of infection.
In all cases, as anticipated, the greater the preva-lence, the less it is concentrated in the core groups. When tracing is considered, the results differ greatly between the two forms of contact tracing. Single-step tracing has little effect on the distribution of infection through the population, whereas iterative tracing greatly reduces the dominance of core groups. By repeatedly following links from infected cases, iterat-ive tracing results in intervention efforts naturally focusing on areas of the network where prevalence 0 0.5 1.0 1.5 2.0 2.5 3.0 3.5 4.0
0 0.1 0.2 0.3 0.4 0.5 0.6 0.7 0.8 0.9 1.0
Equilibrium prevalence
r Tracing=0%
[image:6.595.50.274.67.243.2]Tracing=10% Tracing=25% Tracing=50%
is highest, allowing the most dominant individuals to be contacted and treated. Because iterative tracing effectively targets high-risk parts of the mixing network, the ability of core groups to sustain infection is reduced, greatly aiding the eradication of infection. By contrast, in single-step tracing the core groups retain much of their dominance and eradication is consequently much more difficult.
[image:7.595.100.524.70.244.2]Another issue affecting the success of contact tracing is the speed at which tracing is carried out ; for instance, it is of little benefit to trace all partners of an index case if tracing does not occur until infection has already spread many further steps through the population [13]. The expression above for the critical tracing fraction depends on tracing being carried out before secondary cases have had a chance to trans-mit infection ; if tracing is slower we would expect to have to trace more individuals to eradicate infection. Figure 6 demonstrates the larger tracing fraction required to eradicate infection as the speeds of trans-mission and tracing become similar. Although eradi-cation remains possible, the critical tracing fraction becomes so large that it will seldom be attainable in practice. Thus, contact tracing requires both rapid diagnostic tests and capable and well-resourced health services.
Targeted contact tracing
We have noted that contact tracing directs inter-vention efforts towards at-risk parts of the mixing network, the neighbourhood of infected individuals. We now examine the possibility of further targeting
interventions, thus avoiding expending effort on sub-sections of the population where infection is rare.
To investigate the value of targeted contact tracing we consider a simplified population structure, con-sisting of two groups with different mixing properties, one high-risk (with 10 contacts) and one low-risk (with four contacts). The numbers of individuals in each group are selected so that each group has the same total number of contacts, M. We include variation in population mixing patterns by adjust-ing the assortativity of the population [19, 33]. Assortativity is a measure of the extent to which 0 0·1 0·2 0·3 0·4 0·5 0·6 0·7 0·8
4·8 5·0 5·2 5·4 5·6 5·8 6·0 6·2 (a)
Mean neighbourhood size of infected
Equilibrium prevalence
Tracing=0% Tracing=10% Tracing=25% Tracing=50%
0 0·1 0·2 0·3 0·4 0·5 0·6 0·7
4·8 5·0 5·2 5·4 5·6 5·8 6·0 6·2 (b)
Mean neighbourhood size of infected
Equilibrium prevalence
Tracing=0% Tracing=10% Tracing=25% Tracing=50%
Fig. 5. Mean neighbourhood size of infected individuals plotted against equilibrium prevalence for a range of tracing fractions, using the simulation results shown in Figures 2 and 4. (a) Single-step tracing ; (b) iterative tracing. Also shown (dashed line) is the mean neighbourhood size of the population.
0·5 1·0 1·5 2·0 2·5 3·0 3·5 4·0
0 0·1 0·2 0·3 0·4 0·5 0·6 0·7 0·8 0·9 1·0
R0
Critical tracing fraction Λ=∞ Λ=10
Λ=1
Λ=0·1
Fig. 6.Critical tracing fraction necessary to eradicate infec-tion for the iterative tracing model plotted againstR0for a
range of timescale separations. The timescale separation,L, is defined by the ratio of the tracing and infection time-scales : g=1 and a=Lrg throughout ; R0 and tracing
[image:7.595.321.544.305.481.2]similar individuals interact ; the more assortative the population, the more the mixing is ‘ like with like ’. In this two-group model mixing can range from completely assortative, when all links are within group, to completely disassortative, when all links are between individuals in different groups. We note that high assortativity leads to high R0 whereas prevalence is maximized at some intermediate assor-tativity [24, 30, 33]. The first result arises because of the dominance of the high-risk group during the early stages of an epidemic : the more coherent this group, the higher R0. In contrast, prevalence is maximized when there is both a sufficiently distinct core group to sustain high levels of infection within itself and enough contact between the core and non-core for disease to be widespread in the general population. The more assortative the population the greater the segregation of the groups and thus the greater the unevenness of the distribution of infection.
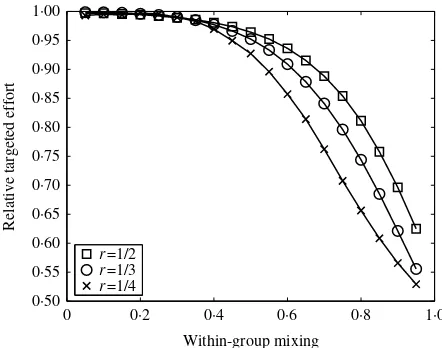
Tracing effort can be apportioned in various ways from entirely directed towards one group to entirely directed towards the other. Use of a simplified popu-lation allows all possible choices of intervention targeting to be tested simply by allowing the fraction of effort applied to the high-risk group to vary be-tween zero and one. We look here at two means of targeting tracing : targeting according to the charac-teristics of the index case, and targeting according to the characteristics of the contact.
First we consider interventions that alter the rate at which tracing is carried out from index cases. We write cm as the rate at which individuals are traced
from an index case with mpartners, and allow this parameter to differ between the two groups, depend-ing on how tracdepend-ing-effort is apportioned. Specifically, if the available effort,E, has a fractionhassigned to the high-mixing group, chigh is increased by hE/M (the denominator is in place since the effort is split between all links that might be traced from this group). When h=1 all effort is spent tracing the contacts of the high-risk group.
Figure 7 shows the effort required to eradicate in-fection when contact tracing is targeted compared to the effort required when tracing is uniformly applied. We see that in some cases there is very little difference between the two approaches. However, targeted con-tact tracing is worthwhile when the population is assortative, and the lower the pre-intervention level of infection the greater the improvement. It is optimal to direct tracing efforts preferentially towards the contacts of core group individuals. This can be
explained as follows : for tracing from one group to be more beneficial than tracing from another, the groups must have partners with different levels of infection. The prevalence in the neighbourhood of an index case will depend partly on the index case itself, but will also depend on the properties of the individuals in the neighbourhood – if the neighbour-hood consists of high-risk individuals, for instance, then they are likely to have been infected via other sources. Thus, targeting is likely to be useful when the population is non-randomly mixed, i.e. either assortative or disassortative. Moreover, for it to be worthwhile to contact particular groups the preva-lence of infection must differ between groups. Therefore, although disassortative mixing allows for particular types of individual to be contacted, the relatively even distribution of infection means that targeting is of little worth. Assortatively mixed populations, however, display unevenly distributed infection, so core group individuals should be sought, and this can be achieved through tracing from other core group members. The fact that targeting becomes more beneficial at lower levels of pre-intervention prevalence supports this argument – when prevalence is low the distribution of infection is more uneven.
We can conclude that there are occasions when contact tracing should be targeted. We have also seen instances when targeting is not worthwhile and,
0 0·2 0·4 0·6 0·8 1·0
0·50 0·55 0·60 0·65 0·70 0·75 0·80 0·85 0·90 0·95 1·00
Within-group mixing
Relative targeted effort
[image:8.595.296.517.68.242.2]r=1/2 r=1/3 r=1/4
indeed, the effort involved in attempting to target interventions may be such as to negate any positive effect. Targeting is only noticeably beneficial in as-sortative populations and it is unclear whether human mixing networks, whether social or sexual, are sufficiently assortative for targeted tracing to be recommended [1, 29, 34, 35]. An adequate answer depends on a far more thorough understanding of the patterns of population mixing and the limitations and constraints inherent in human interactions.
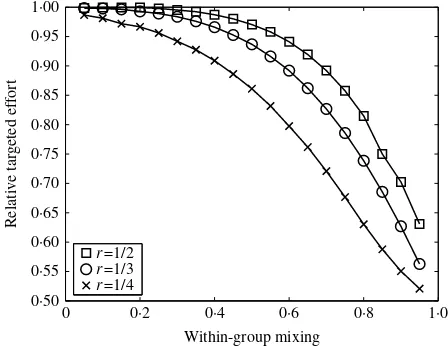
In principle, adjusting the tracing rate according to the characteristics of the index case should be achievable ; index cases are seen by the health services and can be interviewed to determine their relevant properties. Alternatively, we can consider targeting tracing depending on the characteristics not of the index but of the contact : for example by attempting preferentially to trace core group individuals. This requires that index cases can be questioned not only about the identities and numbers of their contacts, but also about their contacts’ attributes. To work effectively, this approach requires that individuals have good knowledge about their partners and that they are prepared to divulge this information.
To examine this option requires only the smallest of adjustments to the model :cmbecomes the rate with
which individuals withmpartners are traced. We see from Figure 8 that, once again, there are situations when this form of targeting is highly beneficial. As before, the less even the spread of infection the greater the benefit of targeting contact tracing, but here we do not require such highly assortative populations to make targeting worthwhile. Previously, only in such
cases was it possible to be know which individuals were being traced, but if tracing is carried out accord-ing to the properties of contacts, then it is always possible to specifically target core groups. If it is possible to trace based on the properties of contacts then the range of circumstances in which significant savings can be made is noticeably extended.
D I S C U S S I O N
Contact tracing is potentially a potent disease control measure. To operate at its fullest efficiency it requires sophisticated and highly trained operatives, capable of gathering the necessary information, coordinating efforts, and contacting individuals. Contact tracing relies on networks of interactions for its success and therefore requires network-based modelling tech-niques to capture the tracing process. Here we have used pair-wise models of epidemics on networks to examine single-step and iterative contact-tracing schemes.
Through the construction of models of con-tact tracing we have seen that to be successful concon-tact tracing must be carried out rapidly and must act iteratively. When these conditions are met the impact on infection prevalence is great ; the natural targeting of tracing efforts towards the at-risk neighbourhood of infected index cases allows core group individuals to be uncovered and treated. The automatic targeting of contact tracing is a property of the intervention that emerges over a series of tracing steps. A single-step tracing scheme is therefore unable to access core groups as effectively : the failure to trace the partners of all uncovered cases means that infection can be rapidly reintroduced. Indeed, it is only for a very limited range of infection parameters that single-step tracing can eradicate infection, whereas iterative contact tracing is much more broadly effective.
Despite the targeting inherent in contact tracing, there are circumstances in which further focusing of the intervention significantly reduces the tracing effort required to eradicate infection. In assortative networks, where mixing tends to be between indi-viduals with similar characteristics, great savings are possible. In such networks the distribution of infec-tion is highly skewed towards the core group – a lack of interaction between the groups means that preva-lence in the general population is lower – and since the contacts of core individuals tend also to be in the core, preferential tracing from the core group allows tracing to target the areas of the network where
0 0·2 0·4 0·6 0·8 1·0
0·50 0·55 0·60 0·65 0·70 0·75 0·80 0·85 0·90 0·95 1·00
Within-group mixing
Relative targeted effort
[image:9.595.76.300.70.243.2]r=1/2 r=1/3 r=1/4
infection is most likely to be found. In randomly mixed networks, where the neighbourhoods of all individuals have broadly similar properties, there is little to be gained from tracing preferentially from particular individuals. In disassortative networks prevalence is reasonably constant across the popu-lation so there are no obvious desirable targets for tracing.
When tracing can be adjusted according to the characteristics of the target individual rather than the index case, there is a greater range of populations in which eradication effort is reduced. In this case, core individuals can be specifically targeted and so long as there is an uneven distribution of infection this proves beneficial. In particular, this form of tracing confers an advantage in randomly mixed populations, not seen when tracing rates depend on the properties
of the index case alone. Although tracing according to the properties of the target is an attractive prop-osition, it is unclear to what extent it is practical. Studies have suggested that, in sexual mixing net-works, individuals are not well-informed about their partners’ behaviour [36, 37], but, dependent on the biases present in individuals’ perceptions, there may be sufficient information for targeted tracing to be feasible. Furthermore, there are cases where risk is highly correlated with characteristics such as occupation, ethnicity, or place of residence [20, 30, 32, 38], in which case relevant information about contacts may be more readily available. Further net-work studies are needed to clarify these issues, but it certainly appears that with good network knowledge and considered use of available resources traditional methods of disease control can be improved.
A P P E N D I X
SIS governing equations
For completeness, the full set of pair-wise equations for an SIS type infection in a heterogeneous net-work is given below. In such a population, where the neighbourhood size varies, individuals are labelled acccording to both their infection status and their neighbourhood size. Thus, [Sm] is the number of susceptible
individuals withmcontacts and [SmIn] is the number of pairs consisting of a susceptible withmcontacts and an
infected withn contacts. Other terms are defined analogously. All triples in the system are evaluated in terms of pairs and singles using the moment closure approximation :
[AmBnCp][A
mBn][BnCp](nx1)
n[Bn] , (10)
whereA,B, andCcan be eitherSorI. This approximation is derived from the same reasoning as outlined in the main text.
d dt[S
m]=g[Im]xtP n
[SmIn],
d dt[I
m]=xg[Im]xtP n
[SmIn],
d dt[S
mSn]=xtP q
([SmSnIq]+[IqSmSn])+g([SmIn]+[ImSn]),
d dt[S
mIn]=tP q
([SmSnIq]x[IqSmIn])xt[SmIn]xg[SmIn]+g[ImIn],
d dt[I
mIn]=tP q
([ImSnIq]+[IqSmIn])+t([SmIn]+[ImSn])x2g[ImIn]: 9 > > > > > > > > > > > > > > > > > = > > > > > > > > > > > > > > > > > ;
(11)
(the number of between-group contacts) appropriately we can obtain a population with a required level of between-group mixing.
Governing equations for single-step contact tracing
As described in the main text, the equations governing the dynamics of the numbers of susceptible and infected individuals in the presence of single step contact tracing are
d
dt[S]=xt[SI]+g[I]+fg[II], (12)
d
dt[I]=t[SI]xg[I]xfg[II], (13)
wherefis the fraction of contacts that are traced. As in the tracing-free SIS case, we must form similar equations for the behaviour of the various pair types ; reasoning as before gives
d
dt[SS]=x2t[SSI]+2g[SI]+2fg[II]+2fg[SII], (14) d
dt[SI]=t([SSI]x[ISI])xt[SI]xg[SI]+g(1xf)[II]+fg([III]x[SII]), (15) d
dt[II]=2t[SI]+2t[ISI]x2g[II]x2fg[III]: (16)
Exactly the same moment closure approximation as used previously closes the system and allow it to be iterated.
Governing equations for iterative tracing
As described in the main text, the equations governing the dynamics of the numbers of susceptible, infected, and tracing individuals in the presence of iterative contact tracing are
d
dt[S]=xt[SI]+a[T], (17)
d
dt[I]=t[SI]xc[IT]xg[I], (18)
d
dt[T]=c[IT]+g[I]xa[T], (19)
wherecis the tracing rate andax1
the tracing duration. Again, we form equations for the behaviour of pairs.
d
dt[SS]=x2t[SSI]+2a[ST], (20)
d
dt[SI]=t([SSI]x[ISI])xt[SI]xg[SI]+a[IT]xc[SIT], (21) d
dt[ST]=xt[IST]+g[SI]+a([TT]x[ST])+c[SIT], (22) d
dt[II]=2t[ISI]+2t[SI]x2g[II]x2c[IIT], (23) d
dt[IT]=t[IST]+g([II]x[IT])xa[IT]+c([IIT]x[TIT])xc[IT], (24) d
dt[TT]=2g[IT]x2a[TT]+2c[IT]+2c[TIT]: (25)
A C K N O W L E D G E M E N T S
The author thanks the MRC, EPSRC, and Emmanuel College, Cambridge, for their funding of this research, and Matt Keeling for his support and advice in the preparation of this manuscript.
D E C L A R A T I O N O F I N T E R E S T
None.
R E F E R E N C E S
1. Barlow D, Daker-White G, Band B. Assortative sexual mixing in a heterosexual clinic population – a limiting factor in HIV spread ? AIDS 1997 ; 11: 1039–1044.
2. Donnelly CA, et al. Epidemiologlcal determinants of spread of causal agent of severe acute respiratory syndrome in Hong Kong.Lancet2003 ;361: 1761–1766. 3. Fenner F,et al.Smallpox and its Eradication. Geneva,
Switzerland : World Health Organisation, 1988. 4. FitzGerald MR, Thirlby D, Bedford CA.The outcome
of contact tracing for gonorrhoea in the United King-dom.International Journal of STD and AIDS1998 ;9: 657–660.
5. Fraser C,et al.Factors that make an infectious disease outbreak controllable. Proceedings of the National Academy of Sciences USA2004 ;101: 6146–6151. 6. Kretzschmar M, van Duynhoven YTHP, Severijnen AJ.
Modeling prevention strategies for gonorrhea and chlamydia using stochastic network simulations. Ameri-can Journal of Epidemiology1996 ;144: 306–317. 7. Rothenberg R, Narramore J. The relevance of social
network concepts to sexually transmitted disease con-trol.Sexually Transmitted Diseases1996 ;23: 24–29. 8. Rothenberg RB, et al. Contact tracing : comparing
the aproaches for sexually transmitted diseases and tuberculosis. International Journal of Tuberculosis and Lung Disease2003 ;7(Suppl.) : 342–348.
9. Wright A, Chippindale S, Mercey D.Investigation into the acceptability and effectiveness of a new contact slip in the management of Chlamydia trachomatis at a London genitourinary medicine clinic. Sexually Transmitted Infections2002 ;78: 422–424.
10. Eichner M. Case isolation and contact tracing can prevent the spread of smallpox. American Journal of Epidemiology2003 ;158: 118–128.
11. Ferguson NM,et al.Planning for smallpox outbreaks.
Nature2003 ;425: 681–685.
12. Halloran ME,et al.Containing bioterrorist smallpox.
Science2002 ;298: 1428–1432.
13. Kaplan EH, Craft DL, Wein LM.Emergency response to a smallpox attack : the case for mass vaccination.
Proceedings of the National Academy of Sciences USA
2002 ;99: 10935–10940.
14. Eames KTD, Keeling MJ. Modelling dynamic and network heterogeneity in the spread of sexually
transmitted disease.Proceedings of the National Acad-emy of Sciences USA2002 ;99: 13330–13335.
15. Eames KTD, Keeling MJ.Contact tracing and disease control. Proceedings of the Royal Society of London, Series B2003 ;270: 2565–2571.
16. Miiller J, Kretzschmar M, Dietz K.Contact tracing in stochastic and deterministic epidemic models. Math-ematical Biosciences2000 ;164: 39–64.
17. Tsimring LS, Huerta R. Modeling of contact tracing in social networks.Physica A2003 ;325: 33–39. 18. Fish ANJ,et al.Chlamydia trachomatis infection in a
gynaecology clinic population : identification of high-risk groups and the value of contact tracing.European Journal of Obstetrics and Gynecology and Reproductive Biology1989 ;31: 67–74.
19. Ghani AC, Swinton J, Garnett GP.The role of sexual partnership networks in the epidemiology of gonorrhea.
Sexually Transmitted Disease1997 ;24: 45–56. 20. Jolly AM, Wylie JL.Gonorrhoea and chlamydia core
groups and sexual networks in Manitoba. Sexually Transmitted Infection2002 ;78: i145–51.
21. Klovdahl AS. Social networks and the spread of infectious diseases : the AIDS example.Social Science Medicine1985 ;21: 1203–1216.
22. Rothenberg RB, et al. Social network dynamics and HIV transmission.AIDS1998 ;12: 1529–1536. 23. Keeling MJ, Rand DA, Morris AJ.Correlation models
for childhood epidemics. Proceedings of the Royal Society of London, Series B1997 ;264: 1149–1156. 24. Anderson RM, May RM. Infectious Diseases of
Humans : Dynamics and Control. Oxford : Oxford University Press, 1991.
25. Hethcote HW, Yorke JA. Gonorrhea : Transmission Dynamics and Control. Springer Lecture Notes in Biomathematics. Berlin : Springer, 1984.
26. Read JM, Keeling MJ.Disease evolution on networks : the role of contact structure.Proceedings of the Royal Society of London, Series B2003 ;270: 699–708. 27. Eames KTD, Keeling MJ.Monogamous networks and
the spread of sexually transmitted diseases. Math-ematical Biosciences2004 ;189: 115–130.
28. Huerta R, Tsimring LS.Contact tracing and epidemics control in social networks.Physics Review E2002 ;66: 056115.
29. Aral SO, et al. Sexual mixing patterns in the spread of gonococcal and chlamydial infections. American Journal of Public Health1999 ;89: 825–833.
30. Bell G, et al. Partner notification for gonorrhoea : a comparative study with a provincial and a metropolitan UK clinic. Sexually Transmitted Infection 1998 ; 74: 409–414.
31. Garnett GP.The geographical and temporal evolution of sexually transmitted disease epidemics. Sexually Transmitted Infection2002 ;78(Suppl.) : 14–19. 32. Wasserheit JN, Aral SO. The dynamic topology of
sexually transmitted disease epidemics : implications for prevention strategies. Journal of Infectious Diseases
1996 ;174(Suppl.) : 201–213.
models. Journal of Infectious Diseases 1996 ; 174
(Suppl.) : 150–161.
34. Edmunds WJ, O’Callaghan CJ, Nokes DJ.Who mixes with whom ? A method to determine the contact patterns of adults that may lead to the spread of air-borne infections. Proceedings of the Royal Society of London, Series B1997 ;264: 949–957.
35. Garnett GP, et al. Sexual mixing patterns of patients attending sexually transmitted diseases clinics.Sexually Transmitted Disease1996 ;23: 248–257.
36. Ellen JM, et al. Individuals’ perceptions about their sex partners’ risk behaviours.Journal of Sex Research
1998 ;35: 328–332.
37. Stoner BP,et al. Avoiding risky sex partners : percep-tion of partners’ risks v partners’ self reported risks.
Sexually Transmitted Infection2003 ;79: 197–201. 38. PHLS, DHSS & PS and the Scottish ISD(D)5