University of Warwick institutional repository: http://go.warwick.ac.uk/wrap
This paper is made available online in accordance with publisher policies. Please scroll down to view the document itself. Please refer to the repository record for this item and our policy information available from the repository home page for further information.
To see the final version of this paper please visit the publisher’s website. Access to the published version may require a subscription.
Author(s): Pavlo R. Blavatskyy and Ganna Pogrebna Article Title: Myopic loss aversion revisited
Year of publication: 2009 Link to published article:
http://dx.doi.org/10.1016/j.econlet.2009.03.023
Myopic Loss Aversion Revisited
*March 2008
Pavlo Blavatskyy† and Ganna Pogrebna‡
Abstract
In this paper we reexamine several experimental papers on myopic loss aversion by analyzing individual rather than aggregate choice patterns. We find that the behavior of the majority of subjects is inconsistent with the hypothesis of myopic loss aversion.
Key words: myopic loss aversion, evaluation period, prospect theory
JEL Classification codes: D81, C91, D14
*
We are grateful to Uri Gneezy, Jan Potters, Michael Haigh, John List, Thomas Langer and Martin Weber who generously provided their experimental data. We also thank participants of the 2nd International Meeting on Experimental and Behavioral Economics (IMEBE) in Valencia, Spain (December 2005), research seminars at the University of Zurich, Switzerland (March 2006) and the University of Innsbruck, Austria (June 2006) and International Association for Research in Economic Psychology and Society for the Advancement of Behavioral Economics (IAREP-SABE) Conference in Paris, France (July 2006) for their helpful comments. We appreciate insightful comments and valuable suggestions from Glenn Harrison, Thorsten Hens, Rudolf Kerschbamer,Martin Kocher, Thomas Langer, Jan Potters, Matthias Sutter and Peter Wakker. Previous version of this paper was circulated under the title: Myopic Loss Aversion Revisited: The Effect of Probability Distortions in Choice under Risk.
†
Institute for Empirical Research in Economics, University of Zurich, Winterthurerstrasse 30, CH-8006 Zurich, Switzerland, tel.: +41(0)446343586, fax: +41(0)446344978, e-mail:
2
Myopic Loss Aversion Revisited
1. Introduction
Myopic loss aversion (MLA) refers to a combination of greater sensitivity to
losses than to gains (loss aversion) and a tendency to evaluate outcomes frequently
(mental accounting) e.g. Thaler et al. (1997). Benartzi and Thaler (1995) proposed MLA
as an explanation for the equity premium puzzle (Mehra and Prescott, 1985). However,
Durand et al. (2004) showed that the analysis of Benartzi and Thaler (1995) is not robust.
In a similar vein, Fielding and Stracca (2006) find that MLA can explain historical equity
premium only if investors have highly short-sighted evaluation period.
Given these recent findings that macroeconomic simulations of equity premium
puzzle do not appear to be consistent with MLA hypothesis, this papers takes a closer
look at the experimental evidence in support of MLA. Thaler et al. (1997), Gneezy and
Potters (1997), Gneezy et al. (2003), Langer and Weber (2005), Haigh and List (2005)
and Bellemare et al. (2005) all find that, on average, subjects bet significantly higher
amounts on a risky lottery when its performance is assessed over a relatively long time
period. Thus, aggregate choice patterns observed in the above mentioned experiments
appear to be in support of MLA. However, this paper shows that the majority of
individual choice patterns in several of these experiments are actually inconsistent with
MLA hypothesis.
The remainder of this paper is organized as follows. Section 2 presents the
experimental design of Gneezy and Potters (1997), which was subsequently replicated
(with additional treatments) by Langer and Weber (2005), Haigh and List (2005) and
Bellemare et al. (2005). Section 3 reexamines the experimental results and shows that the
2. Experimental design
Gneezy and Potters(1997)ask subjects tobet any partxof their initial endowment
on a risky lottery that yields –x with probability 2/3 and 2.5x with probability 1/3.
Subjects are randomly assigned to one of the two experimental treatments. In treatment
H, subjects make investment decisions in 9 rounds. In rounds 2-9 subjects observe the
outcome of the lottery realized in the previous round. In treatment L, subjects make
investment decisions only in round t5{1,4,7}. The level of investment chosen in round t
remains constant in rounds t, t+1 and t+2. In rounds 4 and 7 subjects observe cumulative
outcome of the lottery from previous three rounds. In both treatments subjects receive a
new initial endowment at the beginning of every period (irrespective of past earnings).
Langer and Weber (2005), Haigh and List (2005) and Bellemare et al. (2005)
replicated the experiment of Gneezy and Potters(1997) and made several modifications
to their design. Langer and Weber (2005) increased the number of rounds from 9 to 18
and used two other risky lotteries for which they did not find evidence of MLA. Haigh
and List (2005) conducted a field experiment with professional traders from the Chicago
BoardofTrade.Bellemare et al.(2005)usedan additional treatment identical to treatment
L except that subjects observed the realization of the risky lottery in every period (betting
behavior in this treatment was not significantly different from that in treatment H).
3. Reexamination of experimental results
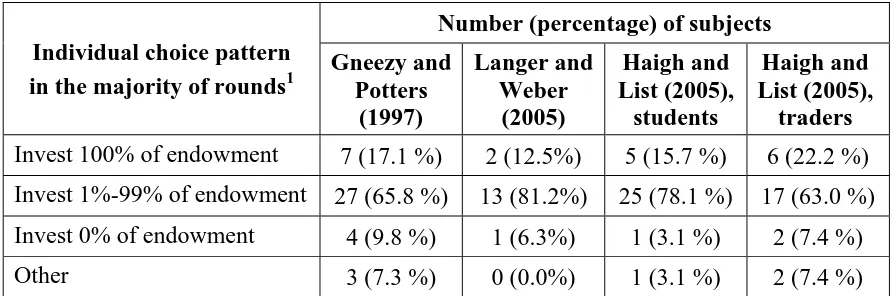
Tables 1 and 2 show that the majority of subjects in the experiments of Gneezy
and Potters(1997), Langer and Weber (2005) and Haigh and List (2005) exhibit the same
individual choice patterns, both in treatment H and treatment L. In the majority of
experimental rounds they invest an intermediate fraction of their initial endowment. Only
a handful of subjects abstain from betting on the risky lottery and 12%-22% (15%-37%)
4
Individual choice pattern in the majority of rounds1
Gneezy and Potters (1997) Langer and Weber (2005) Haigh and List (2005), students Haigh and List (2005), traders
Invest 100% of endowment 7 (17.1 %) 2 (12.5%) 5 (15.7 %) 6 (22.2 %) Invest 1%-99% of endowment 27 (65.8 %) 13 (81.2%) 25 (78.1 %) 17 (63.0 %) Invest 0% of endowment 4 (9.8 %) 1 (6.3%) 1 (3.1 %) 2 (7.4 %)
Other 3 (7.3 %) 0 (0.0%) 1 (3.1 %) 2 (7.4 %)
Table 1 Individual choice patterns observed in Treatment H
Individual choice pattern in the majority of rounds
Number (percentage) of subjects Gneezy and Potters (1997) Langer and Weber (2005) Haigh and List (2005), students Haigh and List (2005), traders
[image:5.612.83.530.71.219.2]Invest 100% of endowment 15 (35.7 %) 3 (15.0%) 6 (18.8 %) 10 (37.0 %) Invest 1%-99% of endowment 27 (64.3 %) 17 (85.0%) 26 (81.2 %) 17 (63.0 %) Invest 0% of endowment 0 (0.0 %) 0 (0.0%) 0 (0.0 %) 0 (0.0 %)
Table 2 Individual choice patterns observed in Treatment L
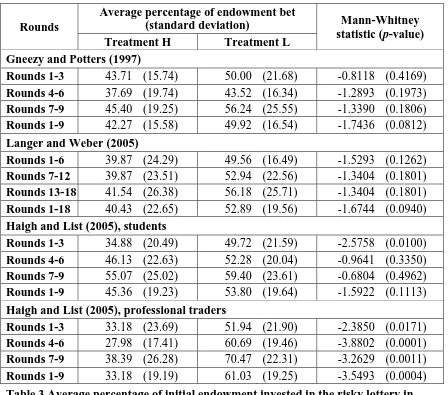
Let us now focus on subjects who consistently bet an intermediate fraction of
their endowment on the risky lottery. Table 3 shows that their intermediate bets are not
significantly different across two treatments in all experiments with an exception of field
experiment of Haigh and List (2005) with professional traders. We will now demonstrate
that such behavior is inconsistent with the hypothesis of MLA.
The prediction of MLA is based on a deterministic decision theory proposed by
Tversky and Kahneman (1992). According to their cumulative prospect theory, an
individual derives utility from changes in wealth, which is captured by the value function
( )
αx x
v = if x≥0 and v
( )
x =−λ( )
−x β if x<0. Coefficient λ >0 is the index of lossaversion (e.g. Köbberling and Wakker (2005)) and coefficients α and β, that capture
diminishing sensitivity to gains and losses, are estimated to be both equal to 0.88.
1
Rounds
Average percentage of endowment bet
(standard deviation) Mann-Whitney statistic (p-value) Treatment H Treatment L
Gneezy and Potters (1997)
Rounds 1-3 43.71 (15.74) 50.00 (21.68) -0.8118 (0.4169)
Rounds 4-6 37.69 (19.74) 43.52 (16.34) -1.2893 (0.1973)
Rounds 7-9 45.40 (19.25) 56.24 (25.55) -1.3390 (0.1806)
Rounds 1-9 42.27 (15.58) 49.92 (16.54) -1.7436 (0.0812)
Langer and Weber (2005)
Rounds 1-6 39.87 (24.29) 49.56 (16.49) -1.5293 (0.1262)
Rounds 7-12 39.87 (23.51) 52.94 (22.56) -1.3404 (0.1801)
Rounds 13-18 41.54 (26.38) 56.18 (25.71) -1.3404 (0.1801)
Rounds 1-18 40.43 (22.65) 52.89 (19.56) -1.6744 (0.0940)
Haigh and List (2005), students
Rounds 1-3 34.88 (20.49) 49.72 (21.59) -2.5758 (0.0100)
Rounds 4-6 46.13 (22.63) 52.28 (20.04) -0.9641 (0.3350)
Rounds 7-9 55.07 (25.02) 59.40 (23.61) -0.6804 (0.4962)
Rounds 1-9 45.36 (19.23) 53.80 (19.64) -1.5922 (0.1113)
Haigh and List (2005), professional traders
Rounds 1-3 33.18 (23.69) 51.94 (21.90) -2.3850 (0.0171)
Rounds 4-6 27.98 (17.41) 60.69 (19.46) -3.8802 (0.0001)
Rounds 7-9 38.39 (26.28) 70.47 (22.31) -3.2629 (0.0011)
[image:6.612.84.532.69.464.2]Rounds 1-9 33.18 (19.19) 61.03 (19.25) -3.5493 (0.0004)
Table 3 Average percentage of initial endowment invested in the risky lottery in treatments H and L by subjects who bet only intermediate fraction of their endowment in the majority of experimental rounds
An individual who invests nothing into the risky lottery obtains zero utility in
both treatments. An individual betting amount x on the lottery in treatment H gets utility
(1) UH
( ) (
x = 2.5x)
w+( )
13 − x w−( )
2 3β
α λ
where w+
( )
p = pγ(
pγ +(
1− p)
γ)
1γ and w−( )
p = pδ(
pδ +(
1− p)
γ)
1δ are the probabilityweighing functions for gains and losses respectively (p∈
[ ]
0,1 and coefficients γ >0 and0
>
δ are estimated to be 0.61 and 0.69 correspondingly).
An individual betting amount x on the risky lottery in treatment L obtains utility
6
Let
( )
( )
23 3 1 5 . 2 − + = w w αλ and
(
)
(
)
(
)
(
)
(
)
(
8 27)
3 27 1 4 5 . 7 27 7 5 . 0 4 27 19 5 . 0 − + + + + − + − = w w w w β α α α α α λ .
Notice that when α =β, an individual bets nothing on the risky lottery in treatment H if
her index of loss aversion λ is greater than λ (in this case UH
( )
x <0). An individualbets all her initial endowment on the risky lottery if λ<λ (UH
( )
x >0). Finally, anindividual is exactly indifferent between betting and not betting (i.e. she can invest any
fraction of her endowment in the risky lottery) if λ=λ (UH
( )
x =0). Similar predictionholds for treatment L with the threshold for index of loss aversion being λ instead of λ.
For conventional parameterizations of cumulative prospect theory ratio λ is
smaller than ratio λ. For example, λ≈1.33 and λ ≈1.66 for parameters estimated by
Tversky and Kahneman (1992).2 Therefore, individual betting behavior in treatments H and L, which is consistent with the hypothesis of MLA, can be organized in the following
Table 4 (depending on the unobservable index of loss aversion).
Index of loss aversion λ λ<λ λ=λ λ <λ <λ λ =λ λ >λ
Betting on the risky
lottery in treatment H everything anything nothing nothing nothing Betting on the risky
lottery in treatment L everything everything everything anything nothing Table 4 Predicted behavior in treatments H and L according to MLA
In terms of the between-subject design of Gneezy and Potters(1997), Table 4 has
the following testable implications:
A. Percentage of subjects, who bet all their endowment on the risky lottery, is higher in
treatment L than in treatment H;
2
B. Percentage of subjects, who abstain from betting, is higher in treatment H than in L;
C. Percentage of subjects, who bet all their endowment in treatment L, is higher than the
percentageofsubjects,who betanintermediate fractionofendowmentin treatmentH;
D. Percentage of subjects, who bet nothing in treatment H, is higher than the percentage
of subjects, who bet an intermediate fraction of their endowment in treatment L.
Tables 1 and 2 show that while implications A and B of MLA are confirmed for
all experiments, implications C and D of MLA are clearly violated. In all experiments the
majority of subjects decide to bet an intermediate fraction of their endowment on the
risky lottery. The fraction of subjects who consistently bet an intermediate fraction of
their endowment is nearly identical across two treatments (ranging between 65% and
85% across different experiments) and their intermediate bets are not significantly
different across two treatments (except for the field experiment ofHaighandList (2005)).
MLA can explain this finding only if ratios λ and λ happen to be equal for the
majority of subjects in both treatments. However, for the equality λ =λ to hold, we need
to assume unconventional parameterizations of cumulative prospect theory (in particular,
γ
δ < ), which contradicts to the existing experimental evidence (e.g. Tversky and
Kahneman (1992), Abdellaoui (2000)). Moreover, if λ =λ, then MLA cannot explain
implications A and B that apparently lead to statistically significant difference between
aggregate choice patterns in treatments H and L.
4. Conclusion
In this paper we reexamine the experimental evidence on risk taking and
evaluation periods, provided by Gneezy and Potters (1997), Langer and Weber (2005)
and Haigh and List (2005). A close look at the data suggests that behavioral patterns of
8
to vary greatly across treatments with different length of evaluation period.
Our results suggest two important messages. First, experiments on risk taking and
evaluation periods may reflect other phenomena than MLA. Some experimental evidence
in support of the assumption of loss aversion of prospect theory has already been called
into question by Plott and Zeiler (2005, 2006). They found that asymmetries in exchange
behavior initially interpreted as evidence of endowment effect predicted by loss aversion
are actually caused by subject misconceptions about the experimental procedure.
The second message is that the question of comparing expected utility theory and
MLA approaches in the laboratory remains unanswered. While many attempts have been
made to create an appropriate procedure, current experimental algorithms fail to
discriminate between the two alternatives. It is left to further research to design an
experiment, which would test expected utility theory versus MLA.
References
Abdellaoui, M. (2000) “Parameter-free Elicitation of Utility and Probability Weighting
Functions”, Management Science, XLVI, 1497-1512.
Bellemare, Ch., Krause, M., Kröger, S. and Ch. Zhang (2005) “Myopic Loss Aversion:
Information Feedback vs. Investment Flexibility”, Economics Letters, 87, 319-324.
Benartzi, S. and R. Thaler (1995) “Myopic Loss Aversion and the Equity Premium
Puzzle”, Quarterly Journal of Economics, CX, 73-95.
Durand, R., Lloyd, P. and H. Wee Tee (2004) “Myopic Loss Aversion and the Equity
Premium Puzzle Reconsidered”, Finance Research Letters, 1, 171-177.
Fielding, D. and L. Stracca (2006) “Myopic Loss Aversion, Disappointment Aversion
and the Equity Premium Puzzle”, Journal of Economic Behavior and Organization,
Gneezy, U., Kapteyn A., and J. Potters (2003) “Evaluation Periods and Asset Prices in a
Market Experiment”, Journal of Finance, LXIII, 821-838.
Gneezy, U., and J. Potters (1997) “An Experiment on Risk Taking and Evaluation
Periods”, Quarterly Journal of Economics, CXII, 631-645.
Haigh, M. and J. List (2005) “Do Professional Traders Exhibit Myopic Loss Aversion?
An Experimental Analysis”, The Journal of Finance, LX, 523-534.
Köbberling, V. and P. Wakker (2005) “An Index of Loss Aversion“, Journal of
Economic Theory, CXXII, 119-131.
Langer, Th. and M. Weber (2005) “Myopic Prospect Theory vs. Myopic Loss Aversion:
How General is the Phenomenon?” Journal of Economic Behavior and
Organization, LVI, 25-38.
Mehra, R. and E. Prescott (1984) “The Equity Premium: a Puzzle”, Journal of Monetary
Economics, XV, 341-350.
Plott, Ch. and K. Zeiler (2005) “The Willingness to Pay—Willingness to Accept Gap, the
“Endowment Effect, Subject Misconceptions, and Experimental Procedures for
Eliciting Valuations,” American Economic Review, 95(3), 530-545.
Plott, Ch. and K. Zeiler (2007) “Asymmetries in Exchange Behavior Incorrectly
Interpreted as Evidence of Prospect Theory," American Economic Review, 97(4),
1449-1466.
Thaler, R., Tversky, A., Kahneman, D., and A. Schwartz (1997) “The Effect of Myopia
and Loss Aversion on Risk Taking: An Experimental Test,” Quarterly Journal of
Economics, CXII, 647-661
Tversky, A. and D. Kahneman (1992) “Advances in Prospect Theory: Cumulative