Mental Workload Measurement: A Maritime Simulation Study
René Vreede, s1788132 University of Twente
Maritime Research Institute Netherlands
Department of Cognitive Psychology and Ergonomics First supervisor: Prof. dr. J.M.C. Schraagen Second supervisor: Prof. dr. ing. W.B. Verwey
Abstract
A study of varying conditions of taskload to test various workload measures was conducted. The measures were tested for internal consistency, sensitivity, and correlations. The measures, selected on the basis of previous literature, include measures of primary and secondary
Acknowledgment
I would like to thank my supervisor prof. dr. Jan Maarten Schraagen for his help with
conducting this study and his excellent feedback on my work. His ideas and knowledge were of invaluable value to me in order to write this thesis.
Secondly, I would like to thank prof. dr. ing. Willem Verwey for his guidance in writing my thesis. His perspective made me rethink the way a report has to be written.
I would also like to thank Colin Guiking, Dimitri van Heel and Wendie Uitterhoeve for their infinite patience while I was working at MARIN. The possibility that they created to conduct the experiments in their laboratory was a unique experience in my life.
Contents
1. Introduction ... 2
1.1 Mental Workload ... 3
1.2 Beginners and Experts ... 6
1.3 Measurement Theory ... 8
1.4 Aim of Study ... 12
2. Method ... 13
2.1 Participants ... 13
2.2 Materials ... 14
2.3 Research Design ... 21
2.4 Procedure ... 22
2.5 Statistical Analyses ... 22
3. Results ... 23
3.1 Internal Consistency ... 23
3.2 Sensitivity ... 24
3.3 Correlations ... 33
3.4 Individual Analysis ... 38
4. Discussion ... 39
4.1 Sensitivity ... 39
4.2 Correlations ... 42
4.3 Individual Analysis ... 44
4.4 Power of Analyses ... Fout! Bladwijzer niet gedefinieerd. 4.5 Recommendations for Future Research ... 45
5. References ... 47
Appendix A. Theory of multiple test corrections. ... 52
2
1. Introduction
In the field of human factors engineering (HFE), the study of humans who use complex systems safely, effectively, and efficiently is of great importance. This pursuit has not been fruitless. Improvements have been made by analyzing the work environment, addressing factors such as cognitive performance, decision making, and perception (e.g., Wickens, 2008; Klein, 2008). Some researchers focus on analyzing real-world behavior as it naturally occurs, while others simulate an environment in a laboratory setting to validate, illustrate, or create a theoretical framework which can help understand human behavior in relation to complex systems. The automotive and aviation industries are typical fields where improvements have been empirically tested and applied. A third sector that is becoming increasingly interested in the application of HFE research is the maritime industry (Sellberg, 2017). Like other transport industries, safety is of great concern in maritime situations. A single accident can have grave consequences for the continuous activities within a port or cause serious environmental damages on the open waters. Additionally, it is likely that the accidents that do happen are due to a system that was not able to help the operator
accordingly. The human factors expert helps the maritime sector by investigating that system and the effect of the system on the operator. After all, HFE is about adapting the system to the human, not vice versa. Through good operator performance fewer mistakes will be made and fewer accidents will occur (Matthews, Reinerman-Jones, Barber, & Abich IV, 2015). The rising amount of technology in the modern world asks ever more cognitive capabilities from operators, while physical demands decline.
A concept that is associated with performance is mental workload. Mental workload is a concept that is ubiquitous in HFE literature, and presents an issue that becomes increasingly relevant (Young, Brookhuis, Wickens, & Hancock, 2015). There is an abundance of
3
Saldien, 2018), and they do not all align. Therefore, the next paragraph will discuss the concept of mental workload in more detail.
1.1Mental Workload
Even though there is no universal agreement on the definition of mental workload, there are shared aspects within the various ways it is defined. A number of definitions will be cited and their similarities will be described. Early on (Welford, 1978, p. 151) mental
workload was defined “… in terms of the demands made by tasks, the capacities the subject brings to meet these demands, and the strategies he uses to relate the first to the second”. Another early study by Moray (1979, p. 13) described mental workload as “.. the rate at which information is processed by the human operator, and basically the rate at which decisions are made and the difficulty of making the decisions”. A more recent definition was described by Kramer and Parasuraman as (2007) “…a set of mental and composite brain states that modulate human performance in different perceptual, cognitive, and/or sensorimotor tasks” (p. 704). Ayaz et al. (2012) defined mental workload as “… how hard the brain is working to meet task demands” (p. 36). The definitions above all describe a relationship between the cognitive capability of the operator (e.g., capacities to meet demands; Welford, 1978) and task demands (e.g., perceptual, cognitive, and/or sensorimotor tasks; Kramer & Parasuraman, 2007).
4
cognitive capability of the operator and that cognitive resources have to be allocated (Van Acker et al., 2018).
A ubiquitous term in the definitions given above is the demands of tasks. Task demands can vary through task complexity (Wickens, 2002). Low task complexity could cause an increase in automatization of processes, which would result in a lower mental workload (Van Acker et al., 2018). Coincidental changes in the environment (e.g., changes in the weather) or system failures (such as engine failure) are also factors of task complexity (Hart & Staveland, 1988). Another way to influence task demands is when an operator has to switch tasks (e.g., different maneuvers when sailing). In summary, task demands are aspects of the environment to which the operator can attend to by using his cognitive resources.
Multiple Resource Theory gives another perspective on workload. Wickens (2002) proposes four categorical and dichotomous dimensions which can explain variance in performance. Namely, processing stages, perceptual modalities, visual channels, and processing codes. The processing stages can be split into perception, cognition, and
responding. The perceptual modalities are defined as auditory and visual. The visual channels are focal and ambient vision. The processing codes involve a distinction between spatial and symbolic processes. According to Wickens (2002) the complexity lays in the type of
resources that is being taxed. If the same resource category and dimension is being taxed, there would be a larger effect on workload than when the task demands are split over different categories or dimensions.
5
workload is hard to define (Sivaraman, Yoon, & Mitros, 2016). Basic criteria are discussed by Brookhuis, de Waard, and Fairclough (2003), but they have not described a direct relation with accidents. However, the rate of accidents can be lowered through correct measurement of mental workload in order to quantify the boundaries. By studying mental workload we gain insight in what sort of behavior is taxing the operator. The use of the cognitive resources is influenced by individual variations, like experience and internal goals of the operator (Van Acker et al., 2018). In the perspective of the elaborate views on the construct of mental workload described via these theories, we note that it is difficult to find a single definition or measurement method that can describe the complexity of mental workload in its entirety. The definition of mental workload used in this study does not compel all of the refinement that stems from the literature. The definition results from agreements in the literature and is described in a collective way.
“Mental workload is a subjectively experienced physiological processing state, revealing the interplay between one’s limited and multidimensional cognitive
resources and the cognitive work demands being exposed to” (Van Acker et al., 2018, p. 358).
6
Corradini, Shuett, & Fonda, 2017). One study on the cognitive workload of tugboat captains was found in the literature (Miklody, Uitterhoeve, van Heel, Klinkenberg, & Blankertz, 2017). Tugboat captains are excellent participants for a study on mental workload. Tugboat captains come into contact with differing levels of mental workload when they have to perform diverse maneuvers, while functioning in changing environmental circumstances, and because of the dynamic characteristics of maritime operations where tugboats are deployed.
The Maritime Research Institute Netherlands (MARIN) is interested in mental workload in a maritime environment. It wants to investigate the various instruments for measuring mental workload described below. The instruments are analyzed via criteria for mental workload described by Eggemeier, Wilson, Kramer, and Damos (1991) and the American Educational Research Association, American Psychological Association, and National Council on Measurement in Education (AERA, APA, & NCME, 1999). Firstly, psychometric constructs must take individual differences into account. Operators might differ in their estimation of a task, strategies for managing effort, and in competency. An
appropriate standard for this is internal structure. Internal consistency (reliability) tests several measurements of the same instrument that propose to measure mental workload and whether they produce similar scores. Secondly, an instrument must be able to detect changes in cognitive demands (sensitivity). Thirdly, the standards require evidence on relationships of the measure with other variables (correlations).
1.2 Beginners and Experts
It is expected that experts will experience less mental workload than the novice
7
A study conducted by Bunce et al. (2011) on command and control systems found that greater expertise was associated with less neural activity at low to moderate levels of taskload, but higher neural activity in the prefrontal cortex, measured with functional near infrared spectroscopy, at high levels of taskload. The novices showed higher levels of neural activity at low to moderate levels of taskload. However, there was even less neural activity at higher levels of task difficulty. The researchers related this to the novices giving up, because the task was too difficult. Another study (Jo, Lee, & Lee, 2014) on automobile drivers found that experts had an easier time processing information than novices at a higher speed of driving. The authors suggested that this probably resulted from previous experiences with high speed driving. A study by Erridge et al. (2017) found similar results as well. They found that experts exert more focused attention on the most relevant stimuli in their work environment,
experience less mental workload and are able to concentrate better than novices. A study by Li, Chiu, Kuo, and Wu (2013) found that experienced operators were more efficient at
executing their tasks (also due to knowing where the relevant information can be gained, as in the study by Erridge et al. in 2017) and performed better at these tasks. Additionally, Li et al. (2016) also found that experts improve their performance due to timely knowledge of which stimuli need attending.
8
1.3 Measurement Theory
1.3.1 Primary performance.
The first category of measurement depends on the collection of data that directly stems from the operator’s success on the primary task. This is based on an acceptable low error likelihood, whilst the operator is also being efficient. In the maritime environment of a tugboat captain, and within the sort of scenarios that were ran, general and specific
performance criteria can be defined. These criteria are further elaborated on in the method section.
1.3.2 Secondary performance.
In a realistic work environment with a dominant task, performance on a secondary task is related to the left over resources unused by the primary task through error rate and time (Young et al., 2015). A secondary task that taxes the same resource as the primary task can be applied as an indicator of mental workload. A fitting tool to assess the visual and executive component of mental workload of an operator on a primary task is the simultaneous
performance on a peripheral detection task (PDT). If visual demands of the primary task are high, PDT has proved to be a sensitive indicator of mental workload (Vlakveld et al., 2015; Martens & Van Winsum, 2000). However, these studies were conducted with car drivers and cyclists. The visual demands of a tugboat captain while he is maneuvering in and near a port or while he is navigating close to an offshore platform are also taxed, although no previous studies on this have been found. With an increase of mental workload, reaction times become slower and the hit rate will drop (Vlakveld et al., 2015).
1.3.3 Subjective workload measures.
1.3.3.1 NASA TLX.
9
domains, including the maritime industry (Hart & Staveland, 1988; Rauffet, Chauvin, Nistico, & Judas, 2016). Hart (2006) notes that the NASA-TLX has been reliably translated in various languages, using appropriate wording for the respective culture and language. In the literature the NASA-TLX is validated with other subjective surveys for mental workload, like the Subjective Workload Assessment Technique and Workload Profile (Rubio, Díaz, Martín, & Puente, 2004). Additionally, the NASA-TLX is often validated with task performance and physiological measures (e.g., Luque-Casado, Perales,Cárdenas, & Sanabria, 2016). The NASA-TLX was conducted as an evaluation survey after a scenario was completed. This made it only possible to analyze differences between-subjects, and it was expected that novices would report higher workload than the experts.
1.3.3.4 RSME (Rating Scale Mental Effort).
The Rating Scale Mental Effort (RSME) is a unidimensional self-assessment scale. The question arises if unidimensional scales provide the same insight as multidimensional scales. A better diagnosticity can be provided by multiple scales, because it is possible to determine which dimensions influence workload. However, unidimensional scales (including the RSME; Zijlstra, 1993; De Waard, 1996) have been found to be just as sensitive as
multidimensional scales in various scenarios (Rubio et al., 2004). A higher score indicates a higher mental effort.
1.3.4 Physiological measures.
1.3.4.1 Pupil dilation.
10
Yang, & Ferris, 2016; Kahneman & Beatty, 1966; Young et al., 2015; Coyne & Sibley, 2016). The size of cameras has decreased significantly and their resolution has increased.
Additionally, computers became more powerful as well. The improvements in technology made it more practical to measure the pupil dilation in a more naturalistic environment like a tugboat simulator. The operator is not restricted in his movement, because only the eye-tracking glasses have to be worn in combination with a mobile phone to collect the data.
1.3.4.2 Functional near infrared spectroscopy.
11
et al., 2016). The prefrontal cortex is often observed because of the association with working memory, decision making, and executive functions (Hincks, Afergan, & Jacob, 2016). An increasing number of studies on prefrontal cortex activity via FNIRS have concluded that it is a relevant index for mental workload while performing complex cognitive tasks (Figner et al., 2010).
1.3.4.3 Electrodermal activity.
Electrodermal activity is measured via transpiration of the skin. The sweat glands are under control of the sympathetic autonomous nervous system, so we can infer that
electrodermal activity gives an indication of arousal (Roth, 1983). Mental workload is related to a decline in parasympathetic autonomous nervous system activity, and an activation of the sympathetic autonomous nervous system (Gawron, Schiflett, & Miller, 1989). The apparent changes of the autonomous nervous system can be made visible with skin conductance sensors (Roth, 1983). There are many studies that discuss this effect of electrodermal activity (Hogervorst, Brouwer, & Van Erp, 2014; Mehler, Reimer, Coughlin, & Dusek, 2009; Verwey & Veltman, 1996). Finally, one study found that EDA matches better with other measures of workload when the workload is high than when workload is only moderate. It is expected that the intensity of arousal will increase with an increase of task difficulty (Broekhoeven, 2016).
1.3.4.4 Electrocardiography.
12
nervous system, and a decrease of HRV can be related to an increase in mental workload (Berntson et al., 1997). Only the parasympathetic autonomous nervous system has an effect on high frequency HRV (0.14 Hz to 0.50 Hz), while both the parasympathetic and
sympathetic autonomous nervous system have an effect on low frequency HRV (0.07 Hz to 0.14 Hz; Berntson et al., 1997). The suppression of parasympathetic activity is related to a heightened mental workload for both frequency ranges. This causes less change in blood pressure and therefore less HRV (Hogervorst, Brouwer, & van Erp, 2014). Therefore a ratio of LF/HF HRV can be used as an index too, and it is expected that the ratio would increase with an increase of the task difficulty.
1.4 Aim of Study
The gathered data made it possible to investigate the psychometric issues related to criteria for mental workload assessment (Eggemeier et al., 1991; AERA et al., 1999). These psychometric issues led to the following research questions. (1) To what extent do multiple measures of the same mental workload instrument correlate? (2) To what extent are the mental workload measures sensitive to differences in task difficulty? (3) To what extent do concurrent measures with multiple mental workload instruments react to the manipulations in task demands? (4) To what extent can we attribute the results to the experimental design or construct validity? Finally, it is expected that the novices will experience more mental workload than the experts.
The investigation of the multiple mental workload measures was conducted using a simulation of the maritime environment of a tugboat captain. Two scenarios were employed for this study, varying in task demands. The difference in demands is categorized between resting phases, medium difficulty, and high difficulty. The difficulties were established by experts who train tugboat captains. The trainers suggested that difficulties could be
13
changing how the tugboat is controlled (e.g., sailing backwards), and influencing the environmental conditions (e.g., an increase of swell of the ocean). For the first scenario six common maneuvers were selected and employed in a racecourse setting. Three of these maneuvers were judged by the experts to have a medium difficulty, and another three maneuvers were judged to have a high difficulty. The second scenario simulates a realistic hoisting operation near an offshore platform. The difficulty in the second scenario is
influenced by changing the environment, namely increasing the swell of the sea. The trainers based their judgment of the difficulty of the maneuvers on their experience training tugboat captains. The measures were categorized as performance criteria, subjective reports, and physiological measures.
2. Method
2.1 Participants
Twenty participants took part in the study (mean age = 46, SD = 13). Out of the twenty participants, eight were categorized as novice captains (mean years of experience = 3, SD = 1), and twelve were categorized as experts (mean years of experience = 23, SD = 18). There was a clear difference in years of experience as a captain between two groups, t (13) = 3.65, p < .01. The inclusion criterion was a basic understanding of how to operate a tugboat. Experience with the specific Azimuth Stern Drive tugboat (Damen 3211) used in the
14
2.2 Materials
2.2.1 Scenarios.
2.2.1.1 The racecourse scenario.
The racecourse scenario contained six maneuvers, excluding a resting phase in
between each of these six maneuvers. The order in which the maneuvers were performed was in a fixed order. This scenario took 50 minutes to complete. The resting phases’ interval lasted from the end of a maneuver until the arrival at the following one. These resting phases had two functions. The mental workload was low, so the results can be compared to the
15
Table 1. A schematic overview of the racecourse scenario.
Maneuver Description Expected mental
workload
AB Sailing from A to B. Low
B Zigzag between buoys (65m apart). Medium
BC Sailing from B to C. Low
C Moor at the quay frontally, depart backwards. Medium
CD Sailing from C to D. Low
D Pivot around the buoy. Medium
DE Sailing from D to E. Low
E Zigzag backwards between buoys (65m apart). High
EF Sailing from E to F. Low
F Zigzag backwards between buoys (45m apart) High
FG Sailing from F to G. Low
G Navigate backwards into starting position, after the notification that starboard engine has failed.
[image:18.595.72.542.458.721.2]High
16
2.2.1.2 The hoisting operation scenario.
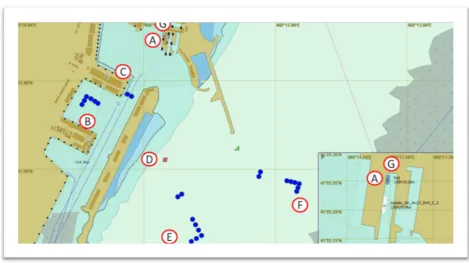
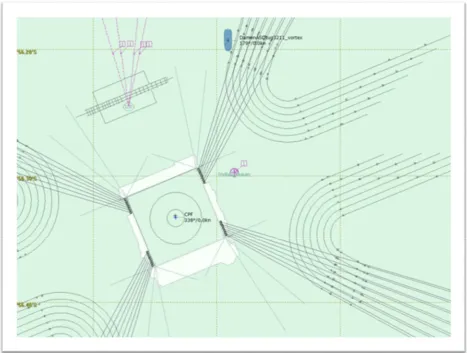
[image:19.595.75.554.353.628.2]The hoisting scenario evolved around the tugboat captain navigating towards the platform (Figure 2). There was a crane located on the east side of the platform. A basket that carried personnel hung from it. The captain was asked to try and stabilize beneath the basket for five minutes. Then, the basket was lowered on deck and pulled back up again. Afterwards, the captain was asked to retreat back to open sea. While the captain was retreating, the swell was increased in order to increase the difficulty of the operation. Then, the captain was asked to perform the same maneuver. A schematic overview is given in Table 2. The scenario lasted about twenty minutes, and the order of the manipulation was fixed.
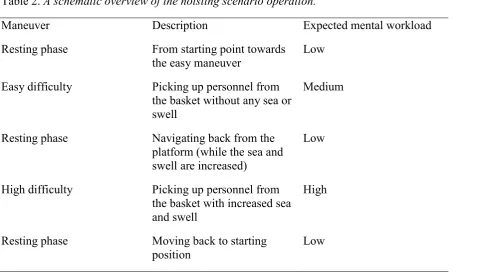
Table 2. A schematic overview of the hoisting scenario operation.
Maneuver Description Expected mental workload
Resting phase From starting point towards
the easy maneuver Low Easy difficulty Picking up personnel from
the basket without any sea or swell
Medium
Resting phase Navigating back from the platform (while the sea and swell are increased)
Low
High difficulty Picking up personnel from the basket with increased sea and swell
High
Resting phase Moving back to starting position
17
Figure 2. The map of the hoisting scenario operation.
2.2.2 Simulator specification.
18
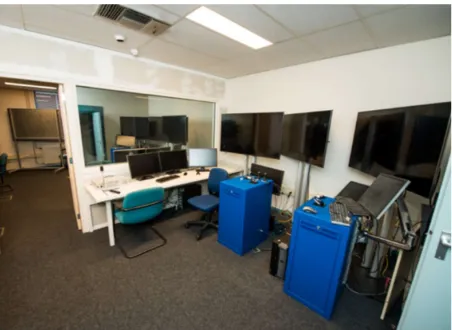
[image:21.595.72.525.118.448.2]Normally the LCD screens form a hexagon, but in this photo they have been pushed to the sided to give an overall view.
Figure 3. Photo of the tugboat simulator laboratory.
2.2.3 Primary performance parameters.
19
mean and the standard deviation of the distance to the buoy were analyzed, and lower values meant better performance.
For the hoisting operation one performance criterion was defined. Namely the distance of the tugboat to the basket while the participant was trying to position the tugboat under the basket. Again, a lack of variation in the distance to the basket can be an indicator of low workload performance. The mean and the standard deviation of the distance to the basket with personnel were analyzed to index performance, where lower values represented better
performance.
2.2.4 Secondary performance.
The PDT transmitted the signal via a wireless connection to a dedicated server. A LED light emitted a pulse every three, four, or five seconds. If the participant responded later than two seconds, the reaction was scored a miss. The computer logged the time when the LED emitted a pulse, and registered the reaction time in the same row. This made it possible to calculate the reaction time, and the hit rate. The reaction time and hit rate were averaged per maneuver. It was not possible to calculate the number of false alarms, because these actions were not logged. This prohibited the application of signal detection theory.
2.2.5 Subjective reports.
2.2.5.1 NASA-TLX.
The NASA-TLX was administered as an evaluative test after the racecourse or hoisting scenario was completed. The test was conducted with pen and paper.
2.2.5.2 Rating Scale Mental Effort
20
2.2.6 Physiological measures.
2.2.6.1 Pupil response.
The pupil dilation was measured with the SensoMotoric Instruments Eye Tracking Glasses (SMI, n. d.). The glasses were equipped with two small cameras, mounted on the inside of the frame. These cameras recorded the pupil size. The data were saved on a mobile phone, which the participant carried while the experiments were conducted. The eye tracker was calibrated per participant. The data was processed in BeGaze (SensoMotoric Instruments, n. d.).
2.2.6.2 Functional near infrared spectroscopy.
The oxygenation of the prefrontal cortex was measured with the fNIR103P system (Biopac Systems Inc., 2018a). The data were collected via four light sensors. Before the collection of the data started, a baseline was established. This took no more than five seconds. The software package COBIstudio was used for the collection of the data (Version 1.3; Biopac Systems Inc.). Next, some post processing of the data was needed via the software package fNIRsoft (Version 4.8; Biopac Systems Inc.). Three filters were applied to minimize the noise in the signal. The first filter tried to cancel out ambient noise that was left in the signal. The second filter was a finite impulse response filter (FIR), which tried to cancel out unwanted frequencies in the signal. The last filter tried to minimize the number of artefacts (e.g., unwanted movement of the sensor). After the filtering the oxygenation could be calculated by subtracting deoxygenated hemoglobin from oxygenated hemoglobin.
2.2.6.3 Electrodermal activity.
21
collection started. The data were analyzed with the AcqKnowledge software package
(Version 5.0; Biopac Systems Inc.). The threshold of a skin conductance response was set at 0.05 µSiemens. The difference between the amplitude of the skin conductance response and the baseline amplitude was calculated to give a representation of the intensity of the arousal of the participant.
2.2.6.4 Electrocardiography.
The BN-ECG2 (Biopac Systems Inc, 2018c) was employed to collect the data. The ECG data were collected via a device that was attached to the abdomen of the participant with a Velcro band. The ECG had to be calibrated for each participant before a measurement started. The AcqKnowledge software (Version 5.0; Biopac Systems Inc.) was used to retrieve the heart rate (RR interval) and the heart rate variability (RMSSD; Goedhart et al., 2007) from the data. The lower frequency HRV was divided by the higher frequency HRV to get to the ratio of LF to HF. A higher ratio was associated with a higher mental workload.
2.2.6.5 Video cameras and observation software.
Three 1080p video cameras were used to capture the experiments. This was useful for two reasons. If there would be any unexplainable results, the recordings might give us a better idea of what happened. Additionally, the recordings were used to indicate when maneuvers were performed on a time interval with the software package Observer XT (Version 14.0; Noldus).
2.3 Research Design
22
consisted of the measurement instruments (e.g., primary performance, secondary performance, subjective reports, and physiological measures).
2.4 Procedure
One participant was tested at a time. The participants were given an explanation of the experiment, and were provided an informed consent form. They were given another form where they were asked to fill in their demographics and experience. Next, the physiological sensors were attached to the participant and calibrated if needed. Participants were explained what the goal of the scenario was a second time. The racecourse scenario was the first scenario that was executed. During each maneuver the RSME was conducted. At the end of the run the NASA-TLX was conducted. The participant was offered a break after completing the racecourse scenario. The hoisting scenario was conducted next. The same procedure was taken for the hoisting scenario. The experiment lasted approximately two hours.
2.5 Statistical Analyses
Averages of the parameters were calculated for each maneuver for the statistical analysis. Cronbach’s alpha was computed to analyze the internal consistency of a parameter. A repeated measures analysis of variance (ANOVA) was performed to test the difference of the measure to the level of difficulty. The level of expertise was added as a between-subjects factor. Mauchly’s test was employed to indicate the assumption of sphericity and the
23
3. Results
Data were lost due to loss of signal from one or more sensors. Analyses were based on the twelve remaining participants. An analysis of power was calculated for the remaining participants and a desired power of .8 was reached. The experimental design of this study might have called for a statistical analysis via multivariate analysis of variance, testing all dependent variables in one go. However, due to the exploratory nature of this study towards various mental workload measures, the choice was made to test the sensitivity of the various parameters independently.
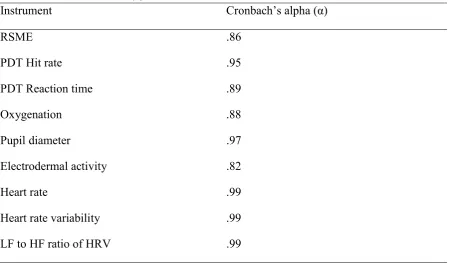
3.1 Internal Consistency
The internal consistency was calculated via Cronbach’s alpha per measurement instrument and per scenario (racecourse scenario, Table 3; hoisting operation scenario, Table 4). It was notable that alpha coefficients are above .8, with the exception of the ECG
24
Table 3. Internal consistency for the racecourse scenario.
Instrument Cronbach’s alpha (α)
RSME .86
PDT Hit rate .95
PDT Reaction time .89
Oxygenation .88
Pupil diameter .97
Electrodermal activity .82
Heart rate .99
Heart rate variability .99
LF to HF ratio of HRV .99
Table 4. Internal consistency for the hoisting operation scenario.
Instrument Cronbach’s alpha (α)
RSME .84
PDT Hit rate .95
PDT Reaction time .82
Oxygenation .95
Pupil diameter .92
Electrodermal activity .92
Heart rate .65
Heart rate variability .72
LF to HF ratio of HRV .66
3.2 Sensitivity
[image:27.595.82.528.393.663.2]25
3.2.1 Racecourse scenario.
3.2.1.1 Primary performance.
The primary performance was analyzed for specific maneuvers, because the
parameters that were selected for the analysis were only relevant for that specific maneuver. The first parameter time (Figure 3), was marginally significant within-subjects, F (2,36) = .25, p = .051, ηp2 = .15. With respect to the post hoc tests, there was a marginally significant
difference between zigzag B (306 seconds) and zigzag F (375seconds), F (2,36) = .22, p = .06, ηp2 = .26. No differences between expertise levels were found.
26
Figure 3. Time by zigzag maneuver, split by expertise.
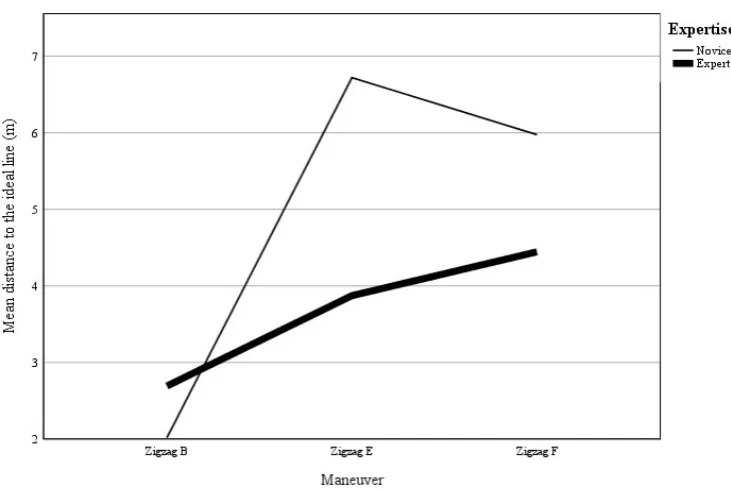
Figure 4. Mean distance to the ideal line by maneuver, split by expertise.
[image:29.595.80.446.428.674.2]27
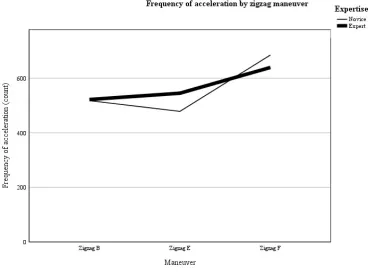
The fourth parameter, the frequencies of acceleration, was significant for the differences between the zigzag maneuvers, F (2,36) = 3.74, p = .03, ηp2 = .17. Figure 5
[image:30.595.79.448.217.489.2]includes a graph of the data. No differences between expertise were found. Post hoc tests were also not significant.
Figure 5. Frequency of acceleration by zigzag maneuver, split per expertise.
The fifth parameter, frequency of angle changes was not significantly different between the zigzag maneuvers.
28
3.2.1.2 Secondary performance.
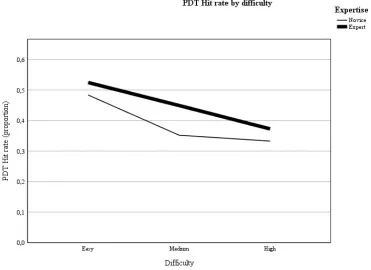
[image:31.595.79.451.322.592.2]No significant differences were found between novices and experts for both parameters (hit rate & reaction time), therefore the compared means contain data for both groups. The differences between the difficulty levels for the PDT hit rates were significant, F (2,36) = 23.15, p < .01, ηp2 = .56. All post hoc tests were significant. The hit rate decreased from Easy (51%) to Medium (41%) difficulty, p < .01, ηp2 = .50, from Easy (51%) to High (36%) difficulty, p < .01, ηp2 = .67, and from Medium (41%) to High (36%) difficulty, p = .05, ηp2 = .29. The differences between the difficulty levels of the PDT reaction times were not significant.
Figure 6. PDT hit rate by difficulty level, split per expertise. 3.2.1.3 Subjective reports.
29
p < .01, ηp2 = .47, from Easy (34) to High difficulty (64), p < .01, ηp2 = .71, and from Medium (52) to High (64) difficulty, p < .01, ηp2 = .41. Figure 7 shows a depiction of the data.
[image:32.595.80.452.188.453.2]Additionally, the NASA-TLX was tested between-subjects (novices and experts). This difference was not significant.
Figure 7. RSME by difficulty level, split per expertise. 3.2.1.4 Physiological measures.
30
Figure 8. Oxygenation by difficulty level, split per expertise.
The differences between the difficulty levels for the heart rate were significant, F (2,28) = 18.46, p < .01, ηp2 = .57. The heart rate increased from Easy (79) to Medium (85) difficulty, p < .01, ηp2 = .59, from Easy (79) to High difficulty (90), p < .01, ηp2 = .67, and from Medium (85) to High (90) difficulty, p = .05, ηp2 = .35. Figure 9 depicts the data of the heart rate by difficulty level.
31
Figure 9. Heart rate by difficulty level, split per expertise.
3.2.2 Hoisting operation scenario.
3.2.2.1 Primary performance.
The mean and the standard deviation of the distance of the tugboat to the basket with personnel were tested between the medium and the hard phase of the scenario, and the
expertise level was factored in. The mean distance to the basket was not significantly different within the difficulty levels or between the novices and experts. The standard deviation of the distance to the basket was also not significantly different within the difficulty levels or between the novices and experts.
3.2.2.2 Secondary performance.
32
3.2.2.3 Subjective reports.
[image:35.595.80.454.325.593.2]No significant differences were found between novices and experts, therefore the compared means contained data for both groups. The RSME showed a significant difference of the score between the task difficulty levels, F (2,34) = 27.36, p <.01, ηp2 = .62. The score of the RSME increased from Easy (23) to Medium (47) difficulty, p < .01, ηp2 = .56, from Easy (23) to High difficulty (58), p < .01, ηp2 = .74, and from Medium (47) to High (58) difficulty, p = .05, ηp2 = .29. The NASA-TLX was only tested between-subjects, the difference was not significant. Figure 10 shows the data of the RSME for the hoisting scenario.
Figure 10. RSME by difficulty level, split per expertise. 3.2.2.4 Physiological measures.
33
[image:36.595.80.444.196.460.2]difficulty was significant, p < .01, ηp2 = .77. Additionally, the post hoc comparison between Medium (-2.14 µMol/L) and High (-0.29µmol/L) difficulty was significant, p < .01, ηp2 = .72. The differences between the difficulty levels for the pupil diameter, EDA, heart rate, HRV, and LF/HF ratio of HRV were not significant.
Figure 11. Oxygenation by difficulty level, split per expertise.
3.3 Correlations
This paragraph reports the extension to which concurrent measures reacted to the manipulations in task difficulty via Pearson’s correlation coefficient. The tables are
34
35
Table 5. Correlation matrix for the measurements of the racecourse scenario.
T im e R S M E P D T H it r at e P D T R ea ct io n ti m e O xy ge na ti on P up il d ia m et er E D A H ea rt r at e H ea rt r at e va ri ab il it y L F /H F r at io o f H R V D is ta nc e to id ea l li ne – m ea n D is ta nc e to id ea l li ne – S D A cc el er at io n fr eq ue nc y A ng le c ha ng e fr eq ue nc y B uo y pi vo t – m ea n B uo y pi vo t – S D
Time - -.03 .14 -.02 .14* .12 .09 .24 .08 -.09 .54** .57** .46** .06 .62* .68**
NASA-TLX -.26 .28 -.30 .22 .15 -.37 .34 .30 .07 -.04 NA NA NA NA NA NA
RSME .47** .49
.37 - .06 -.06 .28 .12 -.04 .12 .11 -.01 .41** .27 .27 .23 .18 .44
PDT Hit rate .05 .03 .04
.35 .16
.06 - -.46 .25 .16 -.02 .07 -.25 -.11 .08 .07 .01 .05 -.15 -.17
PDT Reaction time -.01 .01 -.04 -.32 -.05 .02 -.64 -.40*
-.46* - -.29 -.23 .26 .14** .06 .05 -.03 -.01 .05 .01 -.21 -.03
Oxygenation .30 .10 .14 .51 .24 .28 .33 .25 .24 -.28 -.36
-.15 - -.04 -.33 .46** -.38* .22 .10 .06 -.38 -.04 .19 -.10
Pupil diameter .14 .16 .02 .40 .24 .01 .40 .07 .21 -.35 -.24 -.23 -.25 -.10
.07 - -.53** -.31 -.06 .14 -.07 -.10 -.19 -.30 .10 .27
EDA -.29 .04
.07 -.24 -.12 .11 .03 -.02 -.06 .48 .37 .14 -.39 -.25 -.47 .17 -.43
-.75* - -.23 -.15 -.19 -.13 .02 .05 .30 .30 .17
Heart rate -.15 .10 -.25 -.03 -.09 .15 .04 .13 .11 .13 .11 .10 .78 .42 .55 .78 -.37 -.14 -.17 -.26
-.15 - -.07 -.17 .04 .13 -.02 .31 -.41 -.55
Heart rate variability .19 .08 .19 -.17 -.08 -.23 -.45 -.24 -.22 .20 -.06 .06 -.24 -.40 -.40 -.20 .02 -.15 -.36 -.21 -.03 .15 .05
-.27 - -.32** .20 .31 .35 .11 .24 -.03
LF/HF ratio of HRV .23 -.02 -.16 .34 -.08 -.14 .37 -.15 -.09 .26 .10 -.02 .29 .35 -.01 .38 .05 .26 .31 -.17 -.24 -.20 -.26 -.16 -.52 -.30
-.36 - -.13 -.17 -.04 .00 52 -.02
Distance to ideal line – mean
.55 .69* .55 -.40 .64 .48 .20 .09 .03 -.19 -.04 .12 .08 .01 .30 -.08 .07 -.47 -.11 .06 .05 .50 -.13 -.06 .41 .35 -.01 -.29 -.04
-.21 - .93 .25 .12 NA NA
Distance to ideal line – SD
.51 .76** .48 -.35 .54 .38 .22 .06 -.05 -.14 -.04 .23 .02 -.03 .24 -.10 .14 -.46 -.07 .09 .11 .52 -.09 -.15 .51 .38 .04 -.29 -.02 -.26 .98 .95 .97
- .30 .17 NA NA
Acceleration frequency .47 .52 .40 .27 .06 .37 -.14 -.11 .20 .18 .18 -.12 -.41 -.60 .18 -.10 -.25 -.17 .41 .29 .38 -.05 .08 -.12 .42 .42 .29 .01 .04 -.12 .20 .23 .28 .29 .38 .22
- .66 NA NA
Angle change frequency -.01 -.08 .10 .03 -.22 .51 -.12 .10 .16 -.18 .21 .04 -.23 -.18 .46 -.24 -.20 -.38 .30 .44 .26 .29 .64 .07 .41 -.14 .10 .11 .24 -.22 .21 -.17 .30 .25 -.04 .21 .54 .60
.74 - NA NA
Buoy
pivot – mean .62* .18 -.15 -.21 .19 .10 -.16 -.41 .24 52 NA NA NA NA - .63*
Buoy
36
Table 6. Correlation matrix for the measurements of the hoisting operation scenario.
R SM E PD T H it r at e PD T R ea ct io n ti m e O xy ge na tio n Pu pi l di am et er E D A H ea rt r at e H ea rt r at e va ri ab ili ty L F/ H F r at io of H R V D is ta nc e to ba sk et – m ea n D is ta nc e to ba sk et – S D
NASA-TLX -.39 -.31 .07 .07 -.21 .01 .44 .59 -.32 NA NA
RSME - .18 -.06 .07 .35 -.01 -.22 -.22 .09 .20 -11
PDT Hit rate
.31 .06 .31
- -.34 -.19 .29 -.20 -.06 .36 -.18 .32 -.34
PDT Reaction time
-.30 .11 .18 -.50 -.46 .01
- -.18 -.12 -.17 .50 .08 -.30 -.18 .13
Oxygenation .27 .26 -.04 -.21 -.26 -.17 .04 -.12 -.28
- -.14 .20 .05 .07 .24 .43 -.28
Pupil diameter .20 .49 .28 .40 .28 .25 -.79 .27 .23 -.17 -.36 .06
- .30* .18 .15 .27 -.14 .18
EDA .22 .13 -.20 -.28 -.14 -.21 -.07 -.14 -.44 .24 .43 .07 .01 .47 .42
- -.32 -.24 .09 -.19 .13
Heart rate -.35 .01 -.12 -.22 -.10 .15 .21 .69 .62 .35 -.08 -.22 -.27 -.74 -.37 -.53 -.23
-.25 - .27 -.01 .21 -.15
Heart rate variability
-.19 -.16 .08 .08 .69 .37 -.16 -.14 .58 .24 -.44 .16 .09 .21 .35 -.42 -.21 -.15 .38 .03
.12 - -.41 -.33 .39
LF/HF ratio of HRV
-.21 .29 .06 .24 -.41 -.39 -.28 .01 -.55 .01 .39 .22 .17 .43 .21 -.11 .40 .04 -.12 .22 .04 -.34 -.53 -.45
- .24 -.03
Distance to basket – mean .27 .16 .29 .37 -.18 -.12 .61 .46 -.16 -.12 -.14 -.29 .19 .22 -.54 -.19 .20 .29 - -.70
37
behave in the measurement theory section of this manuscript. Table 5 and 6 show an overview of all correlations that were calculated per scenario. Appendix A contains a discussion on the manner we chose to correct for multiple testing.
3.3.1 The racecourse scenario.
Fifty-five correlations were calculated for the racecourse scenario. Twelve of these correlations were significant. Namely, time and oxygenation (r =.14, p < .05), time and mean distance to the ideal line (r =.54, p < .01), time and the standard deviation of the distance to the ideal line (r =.57, p < .01), time and acceleration frequency (r =.46, p < .01), time and the standard deviation of the distance to the pivot buoy (r =.68, p < .01), the RSME and the mean distance to the ideal line (r =.41, p < .01), PDT reaction time and heart rate (r =.14, p < .01), oxygenation and heart rate (r =.46, p < .01), oxygenation and HRV (r = -.38, p < .05), pupil diameter and EDA (r = -.53, p < .01), HRV and the ratio of HRV in LF/HF (r = -.32, p < .01), and the standard deviation of the distance to the pivot buoy and the mean of the distance to the pivot buoy (r =.63, p < .05).
Out of these twelve significant correlations, only one of the observed effects was not in line of expectation. Namely, pupil diameter and EDA were negatively correlated. It was expected that the widening of the pupil diameter would be correlated with an increase in electrodermal activity. These results showed weak evidence that convergent validity was found among all correlated parameters. Nevertheless, there were some remarkable
correlations. Time strongly correlated with all other primary performance criteria, except for the angle change frequency.
3.3.2 The hoisting operation scenario.
38
deviation of the distance to the basket. This was an unexpected result, since in this case one would expect that when the mean decreases that the standard deviation would decrease as well.
3.4 Individual Analysis
The previous paragraphs tried to investigate the results in terms of reliability, construct validity, and convergent validity. This still made it hard to relate the results towards the
validity of the parameters or the experimental design. Moreover, were the differences in task difficulty discriminant enough to induce changes in mental workload of the participant? Or was it the instrument that was not able to capture the changes in mental workload?
The approach to these questions was made via analyses on an individual level. We hypothesized that high values on the primary performance criteria (e.g., a high mean or standard deviation of the distance to the basket with personnel) represented difficulty with performing the task as instructed. The next step was to describe the values of the other parameters for that individual who scored high on the primary performance criteria. This can give a broader perspective on the question if the results originated from a lack of task
difficulty or instruments being insensitive to measure these apparent difficulties with performing the primary task correctly. Zigzag maneuver F and hard phase of the hoisting operation were chosen for this analysis, because they were amongst the most difficult maneuvers. Therefore, the manipulations of task difficulty should be most noticeable within these maneuvers.
39
and standard deviation) the most from the basket with personnel did not have uniformly high scores on the dependent variables in comparison with the overall data set.
From these results it was concluded that we were not successful at detecting the manipulated task demands. There were indications that one participant had great difficulty with performing the task. However, the employed instruments did not register that.
4. Discussion
The research questions of this study concerned internal consistency, sensitivity, correlations, and individual analysis. Significant differences in sensitivity to task demands where found for time, distance to the ideal line, PDT hit rate, oxygenation, and heart rate. Almost no correlations were found between the instruments. We were also unable to find indicative results of higher task demands on the individual level, meaning that high scoring individuals did not reflect high values on the mental workload instruments. The results of the internal consistency tests showed that we did measure reliably, however validating these results proved to be difficult.
4.1 Sensitivity
We were not able to measure mental workload with the primary performance criteria defined for the hoisting operation scenario, neither within the difficulty levels nor between the novices and experts. In this case, it is very hard to argue against the validity of this parameter to index performance. The goal was clear, position steadily below the basket while the personnel is being transferred. Not conforming to these demands is directly related to the distance to the basket. Therefore it is more logical to reason that the manipulations to the task difficulty might have been too small in the case of the hoisting operation.
40
instead of a steady increase of a certain stimulus frequency. For example in the racecourse scenario, we used zigzag maneuvers and mooring maneuvers. Zigzag B, E, and F are easier to compare than comparing zigzag B with mooring maneuver G. This might explain the
incongruence found in the primary performance criteria.
It was predicted that the primary performance criteria would be sensitive to the changes in mental workload between the different maneuvers, but also that they would be sensitive to differences between the novices and experts. The lack of differences between the novices and experts could have resulted from the types of tasks that we designed. We
employed common maneuvers and tried to make them more difficult by creating smaller spaces to maneuver in or increase the swell of the ocean. However, the maneuvers remain the same. Maybe differences in experience will be clearer when uncommon maneuvers have to be performed. In that case the likelihood is probably smaller that novices know these maneuvers and the lack of knowledge and experience relative to experts might become clear.
The literature on the PDT states that reaction time and hit rate are negatively correlated (Vlakveld et al., 2015; Martens & Van Winsum, 2000). Within the racecourse scenario only the hit rate was sensitive to the manipulations, and for the hoisting operation both parameters were not sensitive. However, when looking at the correlations of reaction time and hit rate it is very clear that they are negatively correlated. This stresses the
importance of testing the parameters independently and also analyzing correlations between the measures (O’Donnell et al., 1991; AERA et al., 1999).
41
maneuvers should be more difficult than the resting phases. It is not possible to control for this effect, since the participant has to actively judge his own mental effort.
Unexpected results were found through the analysis of the oxygenation of the prefrontal cortex. Oxygenation did not increase with task difficulty consistently. It is not possible to pinpoint why this is so, although one study claims that heightened situational awareness decreases the oxygenation in the PFC (McKendrick et al., 2016). Within the racecourse scenario, when traveling from C to D, the captain exits the port. It might be that the captains were also preoccupied with their surroundings while transitioning from port to open sea. Moreover, the first phase during the hoisting operation has the lowest oxygenation level. It might be that the captain was engaged with his surroundings throughout the first phase.
The pupil diameter was not sensitive to task manipulations in either scenario. This was surprising, since the relation between pupil diameter and mental workload is so well
42
The EDA was sensitive to the task manipulations in both scenarios. But, the found effects were opposite to what we expected. The intensity of arousal decreased with an increase of task difficulty. The results might have been influenced during the calibration of the signal. The calibration of the signal was performed just after the introduction of the study, it could be so that the captain was nervous or excited. This might have influenced the baseline to be higher.
Three parameters were extracted from the ECG data. Only the heart rate averages of the racecourse scenario increased significantly with increased task difficulty. The HRV measure was sensitive to changes in task manipulations in the hoisting operation scenario, but these changes were not significant. The LF/HF ratio of HRV was not sensitive either. It is difficult to explain these results. It might result from task manipulations being too small to be measured with an ECG. Especially, since the HRV is such a well-documented measure for mental workload (Berntson et al., 1997).
To summarize, part of the primary performance instruments, the RSME, and part of the physiological measures were sensitive to the manipulations in task demands. The oxygenation levels did not change as we expected them to. We conclude that we were partially unable to reproduce cited studies of the effect of task demands on the used mental workload instruments (PDT reaction time, Vlakveld et al., 2015; NASA-TLX, Hart &
Staveland, 1988; pupil dilation, Rodriguez-Paras, Yang, & Ferris, 2016; oxygenation, Ayaz et al., 2011; electro dermal activity, Hogervorst, Brouwer, & Van Erp, 2014; heart rate
variability and LF/HF ratio of heart rate variability, Berntson et al., 1997).
4.2 Correlations
The correlations tried to shed light on convergent validity through alternative
43
unitary mental workload response. In either scenario there were weak correlations, while part of them were in the opposite direction of the expected polarity. Not to say there were not any correlations, but as previously discussed some might have been due to chance. It is
remarkable that the RSME, PDT hit rate, and heart rate did not correlate strongly, yet were the most sensitive indices in the racecourse scenario. This further substantiates the necessity of following the guidelines published by O’Donnell et al. (1991) and the AERA et al. (1999).
There were different imaginable reasons for the lack of converging validity of the different indices. The latent construct of mental workload is approximated by the instruments that correlate with it. Not being able to find strong evidence for the latent construct could indicate that the measurement model contains errors. Possibly, a single measure might reflect mental workload and the other indices measure different constructs. There might also be variations on the individual level within the different measurements. A study on the
autonomous nervous system suggested that there can be differences between the reactions of individual systems (Christie & Friedman, 2004). Therefore, mental workload indices might be different for individuals as well. If this were the case, then analysis of such a construct should take place on an individual basis.
44
Independent of the dimension that is being taxed, if an increase in task difficulty would elicit use of an abundance of these cognitive systems, then any singular activated system can be a mental workload measure. However, this does not automatically mean that the cognitive systems should correlate between the individuals. This is also reflected by the fact that we were not able to significantly distinguish different workload dimensions with a correlation analysis.
4.3 Individual Analysis
45
4.5 Recommendations for Future Research
It remains interesting for future authors to investigate which cognitive systems correlate with mental workload. However, a lack of a universal definition creates more ambiguity towards the study of mental workload. If one wants to measure something that is not clearly defined, the data will be much harder to interpret. Another recommendation is to be aware of individual differences in the responses to the instruments. Individual differences towards sensitivity might indicate that it is functional to create indices on a personal level. It is also useful to be aware of the complexity of task demands that is presented to the
participant in a practical simulation like in this study. We tried to manipulate task demands, but did not exactly define how the task demands would increase. There might be interactive effects between the various ways the task demands were manipulated, which makes it harder to define what influenced the increase in difficulty. There will always be a trade-off when validating the instruments in an applied environment, instead of a laboratory where one has more control of the manipulations that are presented to the participant.
46
47
5. References
Aberson, C. L. (2010). Applied power analysis for the behavioural sciences. USA: Routledge. Acker, van B. B., Parmentier, D. D., & Vlerick, P., & Saldien, J. (2018). Understanding
mental workload: From a clarifying concept analysis toward an implementable framework. Cognition, Technology & Work, 20, 1-15.
Acqknowledge (Version 5.0)[Computer Software]. Goleta, CA: Biopac Systems, Inc. American Educational Research Association, American Psychological Association, &
National Council on Measurement in Education. (1999). Standards for educational and psychological testing. Washington, USA: American Educational Research Association.
Ayaz, H., Shewokis, P. A., Bunce, S., Izzetoglu, K., Willems, B., & Onaral, B. (2012). Optical brain monitoring for operator training and mental workload assessment. NeuroImage, 59, 36-47.
Ayaz, H., Shewokis, P. A., Curtin, A., Izzetoglu, M., Izzetoglu, K., & Onaral, B. (2011). Using MazeSuite and functional near infrared spectroscopy to study learning in spatial navigation. Journal of Visualized Experiments.
Benjamini, Y. & Hochberg, Y. (1995). Controlling the false discovery rate: A practical and powerful approach to multiple testing. Journal of the Royal Statistical Society, 57, 289-300.
Benjamini, Y. & Yekutieli, D. (2001). The control of the false discovery rate in multiple testing under dependency. The Annals of Statistics, 29, 1165-1188.
Berntson, G. G., Bigger Junior, J. T., Eckberg, D. L., Grossman, P., Kaufmann, P. G., Malik, M., . . . Van der Molen, M. W. (1997). Heart rate variability: Origins, methods, and interpretive caveats. Psychophysiology, 34, 623-648.
Biopac Systems, Inc. (2018a). Wireless pediatric fNIR system [Physiological instrument]. Retrieved from https://www.biopac.com/product/wireless-fnir-optical-brain-imaging- system/
Biopac Systems, Inc. (2018b). Bionomadix wireless PPG and EDA amplifier [Physiological instrument]. Retrieved from https://www.biopac.com/product/bionomadix-ppg-and-eda-amplifier/
Biopac Systems, Inc. (2018c). Bionomadix 2CH wireless ECG amplifier [Physiological instrument]. Retrieved from https://www.biopac.com/product/bionomadix-2ch-ecg- amplifier/
Broekhoven, R. van (2016). Comparison of real-time relative workload measurements in rail signalers (Master’s thesis). Retrieved from University of Twente Theses. (69431) Brookhuis, K. A., De Waard, D., & Fairclough, S. H. (2010). Criteria for driver impairment.
Ergonomics, 46, 433-445.
Bunce, S. C., Izzetoglu, K., Ayaz, H., Shewokis, P., Izzetoglu, M., Pourrezaei, K., Onaral, B. (2011). Implementation of fNIRS for monitoring levels of expertise and mental workload. Proceedings of the International Conference on Foundations of Augmented Cognition, USA, 6, 13-22.
Causse, M., Chua, Z., Peysakhovich, V., Del Camp, N., & Matton, N. (2017). Mental workload and neural efficiency quantified in the prefrontal cortex using fNIRS. Scientific Reports, 7, 1-15.
Christie, I. & Friedman, B. (2004). Autonomic specificity of discrete emotion and dimensions of affective space a multivariate approach. International Journal of Psychophysiology 51, 143–153.
COBI Studio (Version 1.3)[Computer software]. Goleta, CA: Biopac Systems, Inc.
48
Press.
Coyne, J. & Sibley, C. (2016). Investigating the use of two low cost eye tracking systems for detecting pupillary response to changes in mental workload. Proceedings of the Human Factors and Ergonomics Society, USA, 60, 37-41.
De Waard, D. (1996). The measurement of driver’s mental workload (Doctoral dissertation). Retrieved from Research Database Rijksuniversiteit Groningen (90-6807-308-7) Eggemeier, F. T., Wilson, G. F., Kramer, A. F., & Damos, D. L. (1991). General
considerations concerning workload assessment in multitask environments. In D. L. Damos Ed.), Multiple task performance (pp. 207–216). London, UK: Taylor & Francis.
Erridge, S., Ashraf, H., Purkayastha, S., Darzi, A., & Sodergren, M. H. (2017). Comparison of gaze behaviour of trainee and experienced surgeons during laparoscopic gastric
bypass. Proceedings of the Annual Academic Surgical Congress, USA, 12, 287-294. Ferrari, M. & Quaresima, V. (2012). A brief review on the history of human functional near-
infrared spectroscopy (fNIRS) development and fields of application. Neuroimage 63, 921-935.
Field, A. (2009). Discovering statistics using SPSS. UK: Sage Publications. FNIRSoft (Version 4.8)[Computer software]. Goleta, CA: Biopac Systems, Inc.
Gavas, R., Chatterjee, D., & Sinha, A. (2017). Estimation of cognitive load based on the pupil size dilation. 2016 IEEE International Conference on Systems, Man, and Cybernetics, Canada, 606-611.
Gawron, V. J., Schiflett, S. G., & Miller, J. C. (1989). Measures of in-flight workload. Aviation Psychology, 240-287.
Goedhart, A. D., van der Sluis, S., Houtveen, J. H., Willemsen, G., & de Geus, E. J. (2007). Comparison of time and frequency domain measures of RSA in ambulatory
recordings. Psychophysiology, 44, 203-215.
Hart, S. G. & Staveland, L. E. (1988). Development of NASA-TLX (Task Load Index): Results of Empirical and Theoretical Research. In P. A. Hancock & N. Meshkati (Eds.), Human Mental Workload (pp. 239-250). Amsterdam: Noord-Holland.
Hart, S. G. (2006). NASA-task load index (NASA-TLX); 20 years later. Proceedings of the Human Factors and Ergonomics Society, USA, 50, 904-908.
Hincks, S. W., Afergan, D., & Jacob, R. J. K. (2016). Using fNIRS for real-time cognitive workload assessment. In C. M. Fidopiastis, D. D. Schmorrow (Eds.), Lecture notes in Computer Science: Vol 9743. Bioinformatics (pp. 198-208).
Hogervorst, M. A., Brouwer, A. –M., & van Erp, J. B. F. (2014). Combining and comparing EEG, peripheral physiology and eye-related measures for the assessment of mental workload. Frontiers in Neuroscience, 8, 1-14.
Holm, S. (1979). A simple sequentially rejective multiple test procedure. Scandinavian Journal of Statistics, 6, 65-70.
Hommel, G. (1988). A stagewise rejective multiple test procedure based on a modified Bonferroni test. Biometrika, 75, 383-386.
Jo, D., Lee, S., & Lee, Y. (2014). The effect of driving speed on driver's visual attention: Experimental investigation. Proceedings of the International Conference on Engineering Psychology and Cognitive Ergonomics, Greece, 11, 174-182.
Kahneman, D. & Beatty, J. (1966). Pupil diameter and load on memory. Science, 154, 1583- 1585.
Klein, G. (2008). Naturalistic decision making. Human Factors, 50, 456-460.
49
of psychophysiology (pp. 704-722). New York, NY, US: Cambridge University Press. Li, S., Chen, W., Fu, Y., Wang, C., Tian, Y., & Tian, Z. (2016). Investigating the effects of
experience on human performance in an object-tracking task: A case study of manual rendezvous and docking. Behaviour & Information Technology, 35, 427-441.
Li, W. C., Chiu, F. C., Kuo, Y., S., & Wu, K. J. (2013). The investigation of visual attention and workload by experts and novices in the cockpit. Proceedings of the International Conference on Engineering Psychology and Cognitive Ergonomics, USA, 10, 167-176. Liu, Y., Subramaniam, S.C.H., Sourina, O., Konovessis, D., Liew, S.H.P., Krishnan, G., &
Ang, H.E. (2017). EEG-based mental workload and stress recognition of crew
members in maritime virtual simulator: A case study. Proceedings of the International Conference on Cyberworlds, UK, 16, 64-71.
Luque-Casado, A., Perales, J. P., Cárdenas, D., & Sanabria, D. (2016). Heart rate variability and cognitive processing: The autonomic response to task demands. Biological Psychology, 113, 83-90.
Malogoli, A., Corradini, M., Corradini, P., Shuett, T., Fonda, S. (2017). Towards a method for the objective assessment of cognitive workload: A pilot study in vessel traffic service (VTS) of maritime domain. Proceedings of the International Forum on Research and Technologies for Society and Industry, 3, Italy, 1-6.
Mandrick, K., Peysakhovich, V., Rémy, F., Lepron, E., & Causse, M. (2016). Neural and psychophysiological correlates of human performance under stress and high mental workload. Biological Psychology, 121, 62-73.
Marquart, G., Cabrall, C., & De Winter. (2015). Eye-related measures of driver’s mental workload. Procedia Manufacturing, 3, 2854-2861.
Martens, M. H. & Van Winsum, W. (2000). Measuring distraction: The peripheral detection task. Proceedings NHTSA: Internet Forum on the safety impact of driver distraction when using in-vehicle technologies.
MATLAB (R2018a)[Computer Software] Natick, MA: MathWorks.
Matthews, G. M., Reinerman-Jones, L. E., Barber, D. J., & Abich IV, J. (2015). The psychometrics of mental workload: Multiple measures are sensitive but divergent. Human Factors, 57, 125-143.
McKendrick, R., Parasuraman, R., Murtza, R., Formwalt, A., Baccus, W., Paczynski, M., & Ayaz, H. (2016). Into the wild: Neuroergonomic differentiation of hand-held and augmented reality wearable displays during outdoor navigation with functional near infrared spectroscopy. Frontiers in Systems Neuroscience, 18, 1-15.
Mehler, B., Reimer, B., Coughlin, J. F., & Dusek, J. A. (2009). Impact of incremental increases in cognitive workload on physiological arousal and performance in young adult drivers. Transportation Research Record, 2138, 6-12.
Miklody, D., Uitterhoeve, W. M., van Heel, D., Klinkenberg, K., & Blankertz, B. (2017). Maritime cognitive workload assessment. In L. Gamberini, A. Spagnolli, G. Jacucci., B. Blankertz, J. Freeman (Eds.), Lecture Notes in Computer Science: Vol. 9961 (pp. 102-114). Cham, Switzerland: Springer Nature.
Moray, N. (1979). Mental workload its theory and measurement. Proceedings of the Symposium on Theory and Measurement of Mental Workload, Greece, 3, 13-23. Mulder, L.J.M., Dijksterhuis, C., Stuiver, A., & De Waard, D. (2009). Cardiovascular state
changes during performance of a simulated ambulance dispatchers’ task: potential use for adaptive support. Applied Ergonomics, 40, 965-977.
50
Noyes, J., Garland, K., & Robbins, L. (2004). Paper‐based versus computer‐based assessment: is workload another test mode effect? British Journal of Educational Technology, 35, 111-113.
Observer XT (Version 14.0)[Computer software]. Wageningen, The Netherlands: Noldus. O’Donnell, R.D., Eggemeier, F.T. (1986). Workload assessment methodology. In Boff, K.R.,
Kaufman, L., Thomas, J.P. (Eds.), Handbook of Perception and Human Performance (pp. 1-49). New York, USA: Wiley.
Rauffet, P., Chauvin, C., Nistico, C., & Judas. (2016). Analysis of submarine steering: effects of cognitive and perceptual–motor requirements on the mental workload and
performance of helmsmen. Cognition, Technology & Work, 18, 657-672.
Rodriguez-Paras, C., Yang, S., & Ferris, T. K. (2016). Using pupillometry to indicate the cognitive redline. Proceedings of the Human Factors and Ergonomics Society, USA, 60, 685-685.
Roth, W. T. (1983). A Comparison of P300 and Skin Conductance Response. Advances in Psychology, 10, 177-199.
Rubio, S., Diaz, E., Martin, J., & Puente, J.M. (2004). Evaluation of subjective mental workload: A comparison of SWAT, NASA-TLX, and workload profile methods. Applied Psychology: An International Review 53, 61-86.
Sato, H., Yahata, N., Funane, T., Takizawa, R., Katura, T., & Atsumori, H. (2013). A NIRS- fMRI investigation of prefrontal cortex activity during a working memory task. Neuroimage 83, 158–173.
Šidák, Z. K. (1967). Rectangular confidence regions for the means of multivariate normal distributions. Journal of the American Statistical Association, 62, 626-633.
Sellberg, C. (2017). Simulators in bridge operations training and assessment: A systematic review and qualitative synthesis. WMU Journal of Maritime Affairs, 16, 247-263. Sivaraman, V., Yoon, D., & Mitros, P. (2016). Simplified audio production in asynchronous
voice-based discussions. Conference on Human Factors in Computing Systems, USA, 34, 1045-1054.
SensoMotoric Instruments. (n. d.). Eye Tracking Solutions [Eye tracker]. Retrieved from https://www.smivision.com/
Unni, A., Ihme, K., Surm, H., Weber, H., Ludtke, A., Nicklas, D., . . . & Rieger, J. W. (2016). Brain activity measured with fNIRS for the prediction of cognitive workload. IEEE Conference on Cognitive Infocommunciations, Hungary, 6, 349-354.
Veltman, J. A. & Gaillard, A. W. K. (1998). Physiological workload reactions to increasing levels of task difficulty. Ergonomics, 41, 656-669.
Verwey, W. B. & Veltman, H. A. (1996). Detecting short periods of elevated workload: A comparison of nine workload assessment techniques. Journal of Experimental Psychology: Applied, 2, 270-285.
Vlakveld W. P., Twisk, D., Christoph, M., Boele, M., Sikkema, R., Remy, R., & Schwab, A. L. (2015). Speed choice and mental workload of elderly cyclists on e-bikes in simple and complex traffic situations: A field experiment. Accident Analysis & Prevention, 74, 97-106.
Welford, T. (1978). Mental workload as a function of demand, capacity, strategy and skill. Ergonomics, 21, 151-167.
Wickens, C. D. (2002). Multiple resources and performance prediction. Theoretical Issues in Ergonomics Science, 3, 159-177.
Wickens, C. D. (2008). Multiple resources and mental workload. Human Factors, 50, 449- 455.
51
35, 1132-1137.
Young, M. S., Brookhuis, K. A., Wickens, C. D., & Hancock, P. A. (2015). State of science: Mental workload in ergonomics. Ergonomics, 58, 1-17.
52
Appendix A. Theory of multiple test corrections.
Large numbers of correlations were calculated per scenario. By analyzing this much data in one matrix one is bound to find some significant results by chance. For the previous question of sensitivity this could be remediated by correcting via the Bonferroni procedure. However, the Bonferroni method is too strict when a high number of measures are correlated concurrently (e.g., a .05 α criterion becomes .05 / 100 = .00005). The odds of running into a Type II error increases with the increase of compared measures. There are alternatives to the Bonferroni method that are less strict when the amount of comparisons is large. Common suggestions for a correction for multiple comparisons are the (1) False Discovery Rate (Benjamini & Hochberg, 1995), (2) the Šidák correction (Šidák, 1967), and (3) the Holm– Bonferroni method (Holm, 1979).
The False Discovery Rate is an application of Bayes’ rule which calculates the probability (Rate) that no false positives were found. The FDR controls for the expected proportion (the prior in Bayes’ rule) of statistical significant results that are false (Type I error). The FDR method is less strict when controlling for Type I errors than procedures for familywise error rate corrections such as the Bonferroni procedure. The FDR procedure by Benjamini and Hochberg (1995) is valid when the tests are independent, with the exception of some scenarios in which the tests can be dependent (Benjamini & Yekutieli, 2001). However, the adjustment for the dependence of the tests is replaced by the requirement for a positive correlation between tests (Hommel, 1988).
53
the Šidák correction assumes that the individual tests are independent (Šidák, 1967), and that is probably not the case in this calculation of the intercorrelations of mental workload
measurements.
The Holm-Bonferroni method employs a version of the Bonferroni correction in a sequential manner to correct for familywise error rates when comparing multiple tests. This is performed by sorting all p-values from smallest to largest, let m be the number of p-values. Give all p-values an index (i), starting with the smallest (e.g., smallest p-value gets index 1). The Holm-Bonferroni correction is then calculated as follows, new p-value = (m – i + 1) * original p-value. These new p-values can then be evaluated with the alpha criterion of choice, which is the standard .05 in this case.