The influence of
inner-state displays
on human-human
interaction
Master thesis Human Media Interaction
30
thof August 2016
Written by
Anne-Greeth van Herwijnen
Committee
Abstract
Motivation:In today’s society people are sharing more and more of their daily life and emotions on social media. These social media posts contain more and more private information. Extamicy is the concept used to describe this public privateness. People are not only more aware of their social context, by using smart watches and fit bands they also become more aware of their body state and are focussed on being healthier and happier people. Measuring their exercise levels and choosing to share them with the world is common, but there are systems that go one step further and share more private information, such as live heart rate visualisation. These kind of systems are defined in this research as inner-state displays, since they display the inner-state of the user.
Problem statement:The problem with new techniques like inner-state displays, such as the Neurotiq Social which visualizes the EEG of the user, is that there has been almost no research into usefulness of such an inner-state display in a social context. The attitude towards an inner-state display has not been researched a lot. In this research the social context will be focussed around the concept of empathy. The first research question is: “What is the influence of an inner-state display on empathy in a human-human interaction?” and the second: “What is the attitude towards an inner-state display, focussing on the acceptance and usability?”.
Approach:To measure the usefulness and the attitudes towards the Neurotiq Social this research is divided into three steps. The first step is a validation of the colours of the Neurotiq Social. The second step is a dictator game experiment using the Neu-rotiq Social as stimulus to evoke empathy which is measured by the amount given away in the experiment. The last step is focus groups interviews to learn more about the opinions and attitudes towards the Neurotiq Social and inner-state displays in general.
Results:98 participants were part of the pre-experiment on colour association. These results showed that overall participants associate brain activity states with green-blue. Due to the fact that not all the frequency bands can have the same colour, the colours were chosen partially based on the results and partially due to the fact that the colours needed to differ. In the dictator game 40 students participated in 20 pairs. The results showed that there was no difference in the amount of lottery tickets given away between the condition with or without the Neurotiq Social. Ten students participated in the focus group interviews, resulting into two focus groups who came to similar results. In general, the students were sceptical about wearing the Neurotiq Social in any social context, mainly because it is something they would not normally wear and it was something that was too much in their face and distracting. They saw possibilities in changing the wearable to something like a bracelet and show information that is easier to interpret.
Contents
1 Introduction 6
2 Related Work 9
2.1 Social beings and empathy . . . 9
2.2 Social and affective intelligence . . . 11
2.3 Inner state displays (ISDs) . . . 12
3 NEUROTiQ by Sensoree 15 3.1 History of the NEUROTiQ . . . 15
3.2 Neurotiqs and EEG . . . 15
3.3 Neurotiq Social . . . 16
4 Methodology 18 5 Pre-experiment: Colour interpretation test 20 5.1 Motivation . . . 20
5.2 Method . . . 21
5.2.1 Participants . . . 21
5.2.2 Materials . . . 22
5.2.3 Procedure . . . 23
5.2.4 Statistical analysis . . . 23
5.3 Results . . . 23
5.3.1 Chi-squared test: questionnaire version . . . 24
5.3.2 Chi-squared test: goodness of fit . . . 24
5.3.3 Chi-squared test: frequency bands . . . 25
5.4 Final colour selection . . . 26
5.5 Discussion . . . 26
6 Neurotiq Social experiment 29 6.1 Introduction . . . 29
6.1.1 Dictator game . . . 29
6.1.2 Hypothesis . . . 30
6.2 Method . . . 30
6.2.1 Participants . . . 30
6.2.2 Conditions . . . 30
6.2.3 Apparatus and materials . . . 30
6.2.3.1 Equipment . . . 30
6.2.3.2 Materials . . . 31
6.3 Results . . . 33
6.3.1 Lottery tickets and IOSS . . . 33
6.3.2 Questionnaires . . . 34
6.4 Discussion . . . 35
6.5 Future work . . . 36
7 Focus Groups 37 7.1 Introduction . . . 37
7.2 Method . . . 37
7.2.1 Participants . . . 37
7.2.2 Apparatus . . . 38
7.2.3 Procedure . . . 38
7.2.3.1 Focus group interview . . . 38
7.2.3.2 Analysis focus group interviews . . . 39
7.3 Result . . . 40
7.3.1 Inner state display & Neurotiq Social . . . 40
7.3.2 Social context . . . 41
7.4 Discussion and future work . . . 41
8 Conclusion 42 A Social Experiments to measure empathy 47 B Materials colour experiment 49 B.1 Consent form . . . 49
B.2 Questionnaire colour experiment . . . 51
C Graphs colour experiment 54 C.1 BCI words . . . 54
C.2 Emotion . . . 56
D Materials main experiment 59 D.1 Consent form . . . 59
D.2 Dictator game instructions and ballot . . . 61
D.2.1 Dictator instructions . . . 61
D.2.2 Receiver instructions . . . 61
D.2.3 Ballot . . . 61
D.3 Procedure . . . 61
D.4 Results ballot . . . 63
D.5 Figures of the questionnaires of the main experiment . . . 65
E Focus group materials 70 E.1 Mail . . . 71
E.2 Procedure . . . 73
List of Tables
5.1 Colours experiment: descriptive statistics gender . . . 22
5.2 Colour experiment: descriptive statistics age . . . 22
5.3 Colour experiment: descriptive statistics colour blindness . . . 22
5.4 Colour experiment: chi-squared test questionnaire versions . . . 24
5.5 Colour experiment: goodness of fit chi-squared test . . . 25
5.6 Colour experiment: chi-squared test on the combined concepts of fre-quency bands . . . 25
5.7 Colour experiment: Colours for the Neurotiq Social based on majority vote . . . 27
6.1 Dictator game: times concepts were mentioned on ballot . . . 34
6.2 Main experiment: Scores on the Eysenck personality scale . . . 34
6.3 Main experiment:Mann-Whitney-Wilcoxon test on Eysenck personality results . . . 35
6.4 Main experiment:Mann-Whitney-Wilcoxon test on empathy quotient re-sults . . . 35
A.1 Measurements for empathy/altruism suggested by literature . . . 48
List of Figures
2.1 Baron-Cohen’s Empathy model . . . 10
2.2 Conceptualization of Emotional Intelligence (Salovey & Mayer, 1990) . . 11
2.3 The perceived usefulness and danger when sharing emotions with wear-ables (Duval & Hashizume, 2006) . . . 13
3.1 The different Neurotiqs . . . 16
3.2 The MUSE EEG headset . . . 17
3.3 A raw EEG and the different frequency bands . . . 17
5.1 Original colour scale and interpretation of the Neurotiq Social . . . 21
5.2 The colour wheel and the LED representation of purple . . . 23
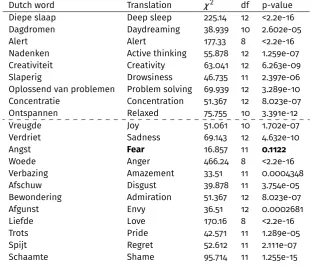
5.3 Graph of distribution responses to the concept of fear . . . 26
5.4 Graph of distribution responses to the concept of deep sleep . . . 27
5.5 Final colours per frequency band represented on the Neurotiq Social . 27 6.1 Set-up main experiment in HMI lab . . . 31
6.2 English translation of instructions for the dictator . . . 33
6.3 Dutch ballot for distributing the lottery tickets . . . 33
6.4 English translation of instructions for the receiver . . . 33
6.5 Graph showing significant difference in IOS score pre and post the dic-tator game . . . 35
7.1 EEG representation of focus group tasks . . . 38
C.1 Graph of distribution responses to the concept of active thinking . . . . 54
C.2 Graph of distribution responses to the concept of alert . . . 54
C.3 Graph of distribution responses to the concept of concentration . . . . 55
C.4 Graph of distribution responses to the concept of creativity . . . 55
C.5 Graph of distribution responses to the concept of daydreaming . . . . 55
C.6 Graph of distribution responses to the concept of drowsiness . . . 55
C.7 Graph of distribution responses to the concept of problem solving . . . 55
C.8 Graph of distribution responses to the concept of relaxed . . . 55
C.9 Graph of distribution responses to the concept of anger . . . 56
C.10 Graph of distribution responses to the concept of joy . . . 56
C.11 Graph of distribution responses to the concept of love . . . 56
C.12 Graph of distribution responses to the concept of shame . . . 56
C.13 Graph of distribution responses to the concept of sadness . . . 57
C.14 Graph of distribution responses to the concept of regret . . . 57
C.16 Graph of distribution responses to the concept of fear . . . 57
C.17 Graph of distribution responses to the concept of envy . . . 58
C.18 Graph of distribution responses to the concept of admiration . . . 58
C.19 Graph of distribution responses to the concept of disgust . . . 58
C.20 Graph of distribution responses to the concept of amazement . . . 58
D.1 Graph of empathy quotient scores . . . 66
D.2 Graph of Eysneck psychoticism scores . . . 67
D.3 Graph of Eysneck neuroticism scores . . . 68
Chapter 1
Introduction
Social Networking Sites (SNSs) such as Twitter and Facebook enable us to share our actions and thoughts with others, friends but also with everyone who wants to read them. Not only actions and thought, but also our emotions considering these ac-tions and thoughts. In 2013 Facebook added the option to add an emoticon to your message. There are over a hundred different emotional states you can add to your message, such as “Drinking coffee, feeling happy”. The concept on Facebook used to be that you couldlikesomeone’s message if the message was funny, but also to show
your support when a message was sad. However, this was complicated sometimes, because liking the fact that somebody’s grandmother died felt wrong and liking that somebody got married felt a bit of an understatement. The Facebook Data Team (2010) shows with their data analysis a negative correlation between the amount of likes and the use of negative emotions. To increase the emotional response readers could give, Facebook introduced, on the 24thof February 2016, six different animated emoji
“Re-actions”: Like, Love, Haha, Wow, Sad and Angry. Facebook Newsroom (2016) says the following about the introduction ofreactions: “We’ve been listening to people and
know that there should be more ways to easily and quickly express how something you see in News Feed makes you feel. That’s why today we are launching Reactions, an extension of the Like button, to give you more ways to share your reaction to a post in a quick and easy way.”. Multiple sources show the increase of users of SNSs, in the Netherlands the CBS (2015) shows an increase of users of 16% between 2012 and 2014. This example suggests a transition in the western culture towards the SNSs and from internal emotions towards shared external emotions.
A crucial part of what is described above holds close connection with a crucial mechanism in human to human interaction, which is empathy. Being able to feel what a person is feeling and to communicate those feelings towards them. Knowing what somebody is feeling is always difficult, but body language is a way to interpret what somebody feels. If somebody blushes it means often they feel uncomfortable or em-barrassed. Seeing these emotions and feelings, understanding them and communi-cating a proper response are all part of empathy, but it is not always easy to read somebody’s emotional state. Facebook allows users to communicate their emotional state. Just like SNSs tech-companies also focus more on the emotional state of the user.
stress level is monitored. Products like the leaf (Bellabeat, 2016), the moodmetric ring (Moodmetric, 2015) and the feel (Sentio Solutions Inc., 2015) all promote a healthier and happier life style wearing some kind of jewellery able to measure certain phys-iological body measurements, such as heart rate and galvanic skin response. These previous technologies are relatively small but there are also larger products such as the hexoskin (Carre Technologies inc., 2016), a smart t-shirt that monitors heart rate, heart rate variability to measure stress, breathing volume, activity (steps, cadence & calories) and sleep. The motto of this shirt is: “Listen to your body and live a longer, healthier, and happier life.”. Where all the previous products focus on heart rate and other physiological body measurements that can be interpreted relatively straight forward, there are wearables that monitor a person’s inner-state by measuring EEG such as the Emotiv Insight (EMOTIV Inc., 2016) or the Muse headband (Interaxon, 2016). Those products are also focussed on making the wearer more aware of their inner-state.
The previous examples all fit somewhere in the wearable spectrum. This spectrum starts with something like a smart watch, a typical commercial product which is more and more present in our daily lives and ends with futuristic products such as the NEUROTiQ by Sensoree which uses the Muse headband. All these products are user-centred technologies, without somebody to wear them, they are useless.
Sensoree is a company which makes wearables that have a place on the more futuristic part of the spectrum. Some of their products are not only wearables that serve the users themselves but also serve the social environment of the user by com-municating the inner-state outwards. These products display what the user’s body provides the system, such as heart rate or EEG. These systems are defined asinner state displays (ISDs). An ISD is a piece of technology showing the physiological state of the user, such as the Neurotiq Social. Showing this state is not only in a visual modality but could also extend to other modalities such as audio.
One of the challenges with new technologies such as the ISDs created by Sensoree is that there is not much research on the acceptance of the technology and the influ-ence of the technology. One of the ISDs created by Sensoree is the Neurotiq Social, this ISD is used in this thesis. A way to test these technologies is in the controlled environment of an experiment. This serves as a proof of concept of the benefits of a wearable inner-state display, specifically the Neurotiq Social. The Neurotiq Social is a brain-computer interface. This is a wearable cap that uses LEDs to display the brain activity. The intention of the Neurotiq Social is to serve a social purpose.
The aim of this thesis is to present a proof of concept of the social benefits of the Neurotiq Social. Besides this proof of concept this thesis also shows the opinion of Dutch students on the concept of the Neurotiq Social and wearable technology.
This thesis aims to prove the usefulness of inner-state-displays to society and the attitude of society towards inner-state-displays. The usefulness is measured as a function of altruism, closely related to empathy, and the attitude is measured with a focus group. To achieve this, this thesis answers the following questions.
First research question What is the influence of an inner-state display on empathy in a human-human interaction?
Second research question: What is the attitude towards an inner-state display, fo-cussing on the acceptance and usability?
Chapter 2
Related Work
This chapter provides a literature framework to place the research questions into con-text. The concepts that play an important role in the research questions are: human-human interaction, empathy and inner-state displays. Section 2.1 focusses upon the social nature of humans and concept of empathy in that context. Section 2.2 explores the concept of social and affective intelligence since this is crucial to the concept of empathy. The last section, section 2.3, elaborates on the concept of inner-state dis-plays and extimacy.
2.1
Social beings and empathy
For most of us humans, the core of our being is interacting with other humans and to develop relationships. Batson (1990) questions how social we really are. According to him we live in a social world where the actions of a human are almost all the time directed towards others or in response to others. But does living in a social world make human beings social beings? According to Batson it does, since humans value others not only for their own gain but also for the benefit of others. To determine how social humans are Batson (1990) tests the empathy-helping relationship which describes the obvious fact that humans help each other. Most research shows that empathy is a crucial part of this helping relationship. Humans are more likely to help someone when they feel for the other. But why do they help the other: to relief their own feeling of guilt (egocentric motivation) or to benefit the other (altruistic motivation)? Altruism is defined as the disinterested and selfless concern for the well-being of others (Stevenson, 2010). The human capacity for altruistic caring is, however, limited to those to whom they feel empathy (Batson, 1990, p.344).
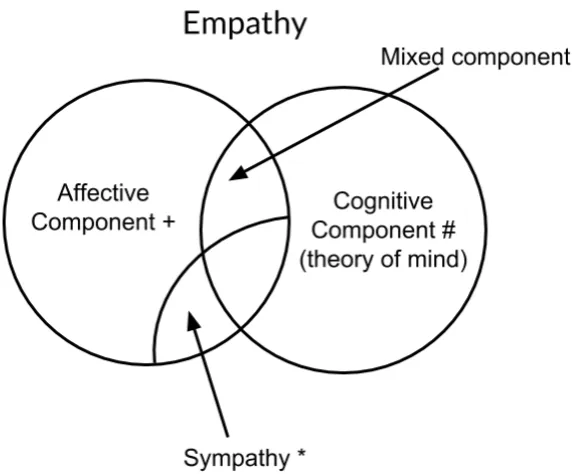
Figure 2.1: Baron-cohen & Wheelwright’s empathy model showing the two overlapping compo-nents and sympathy as special case of affective component of empathy.
+Feeling an appropriate emotion triggered by seeing learning of another’s emotion.
#Understanding and or predicting what someone else might think, feel, or do.
*Feeling an emotion triggered by seeing learning of someone else’s distress which moves you to want to alleviate their suffering
of the affective component with a part of the cognitive component. The cognitive component emphasizes the need for understanding the feelings of the other person, putting aside one’s own perspective and taking on the perspective of the other.
Decety & Jackson (2004, p.75) describes the functional architecture of empathy, consisting of three major components:
• affective sharing between the self and the other, based on perception-action coupling that lead to shared representations;
• self-other awareness. Even when there is some temporary identification, there is no confusion between self and other;
• mental flexibility to adopt the subjective perspective of the other and also reg-ulatory processes.
These components also fit in the model of Baron-cohen & Wheelwright (2004), the first component fits in the affective component and the last in the cognitive component. The second component is one of the key components of the model of Baron-cohen & Wheelwright (2004) and is also part of the description of Batson (1990).
resources have to be divided among two participants. There is one person who has all the resources and is allowed to divide those the way he (the dictator) seems fit. Andreoni & Rao (2011) shows that the situation where the receiver is allowed to ask for a share elicits a more altruistic approach, which can be explained with the second component of Decety & Jackson (2004). The dictator becomes aware of the other and is able to start affective sharing. According to Andreoni & Rao (2011, p.514), the empathy-altruism hypothesis posits that feelings of empathy are the primary explanation for altruistic acts for which the agent does not expect to receive compensating material benefits through reciprocity or the absence of sanctions. Other possible games or experiments to test altruism are described in appendix A.
2.2
Social and affective intelligence
To understand emotions, to express empathy and to have social interactions with oth-ers is important. A key concept in having such interactions is social intelligence. The traditional division of intelligence into abstract, mechanical and social intelligence also includes social intelligence (Thorndike & Stein, 1937). Social intelligence is the ability to understand and manage people (Thorndike & Stein, 1937, p.275). These social skills could also include the ability to understand oneself (Salovey & Mayer, 1990). To understand oneself and another are both crucial to empathy (Baron-cohen & Wheel-wright, 2004). As mentioned before social interaction also involves the expression of emotions. Salovey & Mayer (1990, p.189) defines emotional intelligence as a subset of social intelligence, involving the ability to monitor one’s own and others’ feelings and emotions, to discriminate among them and to use this information to guide one’s thinking and actions. Figure 2.2 shows the conceptualization of emotional intelligence by Salovey & Mayer, which shows the three building blocks of emotional intelligence: appraisal and expression of emotion, regulation of emotion and utilization of emotion. Empathy is the appraisal and expression of emotions towards others. Its counterpart is non-verbal perception, with empathy being more than just perception and a central characteristic to emotionally intelligent behaviour (Salovey & Mayer, 1990).
Emotional Intelligence
Appraisal and Expression of Emotion
self
verbal non-verbal
other
non-verbal perception
empathy
Regulation of Emotion
in self in other
Utilization of Emotion
flexible planning
creative thinking
redirected attention
motivation
Figure 2.2: Conceptualization of Emotional Intelligence (Salovey & Mayer, 1990)
interaction, Picard & Cosier (1997) focusses on the interaction between human and computer, especially the communication of emotion called “affective intelligence”. The problem with today’s technology is that it often mediates in human to human interaction and blocks the affective information. There is a great need for tools that enable affective communication. Not only with disabled people who rely on systems to convey their message, but also in business settings where people rely on telecon-ferences (Picard & Cosier, 1997).
2.3
Inner state displays (ISDs)
As shown before, affective computing is becoming more important due to the techno-logical nature of our environment. To show affective states of the user, it is crucial to measure a user’s affective/emotional state, such as heartbeat, galvanic skin response or EEG. An inner state displays is able to show a person’s inner functions, such as heart rate or brain activity. Brain activity can be recorded by electroencephalography (EEG). Showing an inner state is not only visual but could also be in another modality such as audio. Inner state displays can be as simple as a monitoring system in a hospital showing the vital signs of a patient, but could also be more futuristic like the Heart Sync or Neurotiq Social by Sensoree. This section focusses on wearable ISDs like those of Sensoree.
According to Uğur (2013) emotion is always related to motion, wearable interface can easily measure body motion, but also inner body motion, such as ECG because they are placed on the body. The Neurotiq Social is an example of an “organic user interface”, a concept introduced by Holman & Vertegaal (2008). The idea behind an organic user interface is that is adapts to its user and is flexible, due to nature of the technology used. In the case of the Neurotiq Social, the LED strip, the material of the cap and partially the Muse can adapt to the user and are not static. Also the movement of the LEDs makes the interface itself more organic than static. By turning the body into a dynamic display, these interfaces can change the way in which emotions are normally expressed (Uğur, 2013, p.51).
The expression of emotion is something, even though in normal human interac-tion is something we cannot always control, we try to control as much as possible. Showing emotion in a public setting is something that differs from culture to culture and from person to person. Duval & Hashizume (2005) shows the difference between Japanese and French and also the difference between gender on the show of emotion and the acceptance of wearables. Schaar & Ziefle (1999) shows the same difference in gender and the fact that technical experience is also crucial in the acceptance of wear-ables. Duval & Hashizume (2005) presents universal guidelines for the acceptance of wearables.
• Wearables should improve the comfort and safety of their wearer, and possibly of surrounding or distant people.
• Wearables should be able to communicate with other devices, and to suggest them a behaviour based on knowledge about their wearer.
• Support for communication should focus on disrupted settings (e.g. on trips, or with disabled persons) rather than on standard situations
Figure 2.3: The perceived usefulness and danger when sharing emotions with wearables (Duval & Hashizume, 2006)
• Full control of the system by an artificial agent should be avoided, and the au-tonomy and intelligence of the system should be selected based on cultural preferences.
Schaar & Ziefle (1999, p.607) adds to this that a persons’ acceptance is primarily formed by the assumed fears and the perceived disadvantages rather than driven by a positively connoted usage motivation. People are more afraid of losing control of their shared emotion than willing to see the beneficial functions, such as an increase in empathy. Duval et al. (2009) shows with figure 2.3 that people see more fear in disclosing their emotions than they see the usefulness. Buenaflor (2013) shows that there are six factors that are crucial for the acceptance of technology and one of those is the fundamental needs as introduced by Maslov. This shows that people accept technology earlier when it contributes to a lower need such as the need for health and safety than for a need for intimacy. This also explains the finding of Duval et al. (2009), since the need for safety triumphs the need for intimacy. To increase the acceptance of ISDs as affective wearables, it is important to keep the guidelines of Duval & Hashizume in mind, but also to show the positive connotation and benefits to counter the assumed fears and disadvantages.
need in the hierarchy people tend to reject this technology faster than, for example, a smart watch that focusses on the physiological needs and does not share emotions without consent.
The sections above show the paradox of inner state displays. On one hand the user might benefit on many levels of sharing his emotions as shown by Uğur (2013) and it would help many people to behave more social intelligent, but it also breaks some control and social barriers. It increases the lack of privacy by showing emotion without control from the user. One advantage of the Neurotiq Social is that is does not directly and clearly shows or communicate emotions, but shows the mental activity of a person, even though this might be interpreted by others as showing the emotional state.
Chapter 3
NEUROTiQ by Sensoree
This master thesis is constructed around the Neurotiq Social by Sensoree. The Neu-rotiq Social is a version of the NEUROTiQ. Section 3.1 describes the concept of the Neurotiq and the different versions, section 3.2 describes the role of EEG in the Neu-rotiq and section 3.3 goes into more detail about the NeuNeu-rotiq Social.
3.1
History of the NEUROTiQ
Sensoree (2016) describes the first NEUROTiQ as follows: “NEUROTiQ is brain animat-ing fashion – a knitted EEG brain sensor – that maps thoughts and exhibits brain states with colour.”. There are different versions of the NEUROTiQ: the first is the real NEU-ROTiQ, the second was the Neurotiq Spa (see figure 3.1b) and the last version is the Neurotiq Social (see figure 3.1c). These different versions all had different goals and have been used in different settings. The NEUROTiQ (figure 3.1a) was designed to be a museum piece or artefact.
Sensoree was commissioned to create a new concept piece for a 3d Print exhi-bition. The Sensoree Therapeutic Biomedia – embedded in the design – is the tech-nology that converts the BCI data to colour frequencies. This visualizes brain states with colour and maps brain activity on the head for others to see. This design also premièred in NYFW 2014 and since has travelled globally. In 2015, they created the NeurotiQ Spa version as an experiential exhibit for 3 people to try the design and be lead through a brain exercise class (such as meditation). A data log / print out of their experience wearing the design was also added.
The Neurotiq converts EEG signals into light. To capture these EEG signals the first version used the Emotiv EPOC, the latter versions used the MUSE headset (see figure 3.2). The Neurotiq Spa was part of the Sensoree Spa and was mainly used by the leader of the meditation to monitor the participants. The Neurotiq Social is the most wearable version of the Neurotiq so far, it is wireless and the participants can walk around and move around.
3.2
Neurotiqs and EEG
(a) The NEUROTiQ (b) The Neurotiq Spa
[image:18.595.158.435.123.379.2](c) The Neurotiq Social Figure 3.1: The different Neurotiqs
and theta waves (Collura, 1997). These waves are part of the whole frequency spectrum of brain activity measured with an EEG. The studied frequency bands are between the 4 and 60 Hz (Ray & Oathes, 2003). This does not include the delta-band since that ranges from 0.1 — 4 Hz. Figure 3.3 shows the different frequency bands that can be deduced from a raw EEG. The Neurotiq translates those five frequency bands into different colours. Since the different frequency bands are associated with different amounts of brain activity the Neurotiqs convey the amount of brain activity.
3.3
Neurotiq Social
The Neurotiq Social is designed by Kristin Neidlinger and is, in comparison to the other two versions, more robust. The cap is knitted with optical fibres and acrylic wool. The optical fibres are mostly there to provide some stability in the cap. The knitted structure and white acrylic wool already allows the light to shine through, the optical fibres are not really used to transmit light. The cap contains an LED strip where each LED is diffused using a little plastic cylinder. The LEDs are placed at the base of the cap and are controlled using an Arduino Pro Mini.
Figure 3.2: The MUSE EEG headset
[image:19.595.191.431.420.668.2]Chapter 4
Methodology
To answer the research questions proposed in section 1 different steps need to be taken. This is due to the different nature of the two questions. The first question has a quantitative nature and the second one a more qualitative nature. This chapter will discuss the major methodology decisions, where chapters 5, 6 and 7 will describe the methodology in more detail.
The goal of this research is to show the added value of the inner-state display: the Neurotiq Social. To show this added value, the Neurotiq Social needs to be placed into a scientific setting. As mentioned in section 3, the colours that were initially chosen, were chosen based upon their relation towards the visual spectrum, however the as-sociation of those colours by the observer were not taken into account. The first step towards the goal is to gain more insight into the colour association subject. There are different ways to gain insight into such a subject, with literature research, experiments or questionnaires. In this research the subject was tested using a questionnaire, this due to the specific nature and population used in this research. There is not enough colour association research using a Dutch sample, which makes the cultural bias heav-ier. This is why this thesis creates its own baseline with a Dutch sample. The second problem is the fact that the colours are represented by the Neurotiq Social, which is nowhere comparable to the calibrated colours used in most colour research.
With the colours chosen based upon a Dutch sample and the actual colours on the Neurotiq Social, the next step is to choose a method to gain more insight into the influence of the Neurotiq Social on empathy. To conceptualize the concept of empathy different experiments mentioned in literature were reviewed (shown in appendix A). Literature shows that there are different ways to test empathy, and often the concept of altruism is used as a measurement of empathy. A commonly used experiment to test altruism is the dictator game (see section 6.1.1 for detailed information about the chosen dictator game version). To validate that the different conditions did not differ too much, personality questionnaires were used to compare the conditions.
Chapter 5
Pre-experiment: Colour
interpretation test
This section shows the pre-experiment used to determine the colours of the Neurotiq Social. This pre-experiment used a questionnaire to test colour association. Section 5.2 explains more about the experiment and 5.3 shows the results of this experiment.
5.1
Motivation
The goal of this experiment is to determine suitable colours for the Neurotiq Social to represent brain activity. The original colours used in the first two versions of the NEUROTiQ were chosen based on the wavelength of colours, the lowest frequency got the reddest colour and the highest the bluest. The colours are shown in figure 5.1. The problem noticed during the use of the first two versions was that not all the colours were distinct enough, especially the difference between the alpha and beta colours were hard to observe. Since both colours are blue tones and due to the changing intensity of the LEDs it was hard to differentiate between those two. This experiment leads to five colours to represent the five frequency bands (alpha, beta, gamma, theta and delta).
Colour interpretation has been the topic of many papers (such as Naz & Epps (2004), Silver et al. (1988), Silver & Ferrante (1995)). Since colour interpretation differs between race (Silver et al., 1988), genders (Silver et al., 1988; Silver & Ferrante, 1995), ages (Silver et al., 1988) and the way the colours are represented in this experiment, it is hard to derive the colours that fit these five bands exactly. Especially since most of the colour interpretation experiments ask for an emotional interpretation. This focus on emotional interpretation of colours is logical since it is an interpretation that is an integrated part of society. The colour red is associated with hate and with love, depending on the context. The film Inside Out (Docter & del Carmen, 2015) explicitly shows the colours associated with different emotions. However, as mentioned before the Neurotiq Social shows no emotions but frequency bands which do not correspond one on one with emotion. To make a reliable decision on the colours theactivity
Figure 5.1: Original colour scale and interpretation of the Neurotiq Social
in a questionnaire of two dimensions.
In this case the representation of the colours are the LEDs on the Neurotiq Social, as shown in figure 5.2. This leads to a LED light diffused by wool. The colours used in colour experiments are most of the time defined and reproducible, but since the Neurotiq Social cannot represent the colours in the exact same way, colours could be interpreted different. Another problem is that the colour experiments are most of the time done in another language than Dutch, which might lead to discrepancies, since the Dutch wordleukis not one on one translatable to English and vice versa.
The research questions below show the emphasis for this experiment. It is crucial to find five colours to represent the frequency bands and for further experiments it is important to establish a baseline for the emotions associated with the colours that are displayed on the Neurotiq Social.
• Which colour do Dutch students associate with certain words?
– Which colours represent the five frequency bands? – Which colours are associated withemotion-words?
5.2
Method
5.2.1
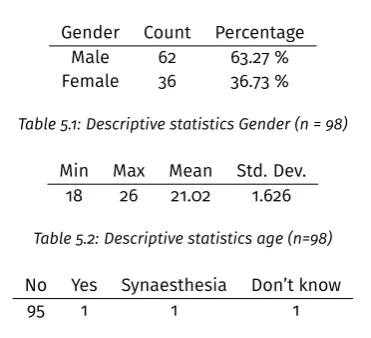
Participants
Gender Count Percentage Male 62 63.27 % Female 36 36.73 %
Table 5.1: Descriptive statistics Gender (n = 98) Min Max Mean Std. Dev.
18 26 21.02 1.626
Table 5.2: Descriptive statistics age (n=98) No Yes Synaesthesia Don’t know
95 1 1 1
Table 5.3: Descriptive statistics colours blindness (n = 98)
5.2.2
Materials
The materials used in this pre-experiment are questionnaires especially made for this experiment. The questionnaire starts with three demographic questions: age, gender and colour-blindness. This last demographic might be useful if certain participants cause outliers. After those three questions the participant completes two parts of the questionnaire with a similar lay-out, both contain the same twelve colours and a different set of words (see appendix B). To prevent the influence of biases, ten differ-ent versions of the questionnaire were distributed. The word order differed amongst these versions. The questionnaires were handed out randomly.
As mentioned in section 5.1 this questionnaire has two dimensions, the frequency dimension and the emotion dimension. The first half of the questionnaire contains
activity-words associated with the frequency bands. In the second half the
partici-pants rated a set ofemotion-words. Appendix B.2 shows the Dutch version. In this
thesis the English translation is used.
The words used to describe the different frequency bands are shown below. The words are chosen based on the work of Collura (1997) and Wikipedia for the Dutch translation (Wikipedia, 2016).
Delta: Deep sleep
Theta: Drowsiness, daydreaming & creativity Alpha: Relaxed and alert
Beta: Concentration & active thinking Gamma: Problem solving
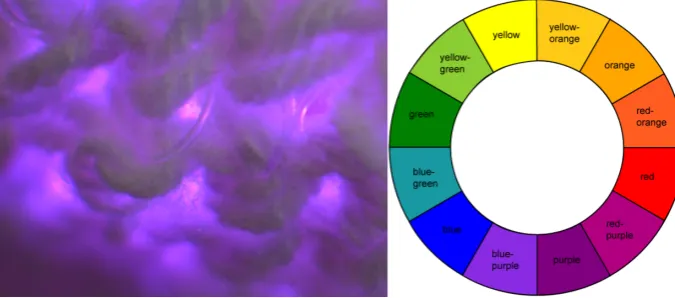
The colours shown in figure 5.2 are the actual colours on the Neurotiq Social, rep-resenting the twelve colours of a colour wheel. As shown in figure 5.2 colours differ from the colour wheel even though RGB values are the same.
Figure 5.2: The colour wheel and the LED representation of purple
The goal is to determine a baseline for the colour interpretations. The results of the first part are used as colour representation of the five different frequency bands. The second part is used to account for any biases in the main experiment. Since this is used in the main experiment the participants are not completely briefed on the meaning of the colours and experiment, especially since the colours are determined after the experiment.
5.2.3
Procedure
The participants were given a consent form which they filled in before they were given a questionnaire (see Appendix B.1). They were not given more information than in the consent form. After they completed the consent forms they were given a version of the questionnaire and once they completed the questionnaire they were finished.
5.2.4
Statistical analysis
The nature of the questionnaire is categorical; the data does not have a rank or a continuous scale. This kind of data is best analysed using a chi-squared test. Multiple chi-squared tests are used. The first test is used to verify that the responses to the different questionnaires do not differ significantly. This shows that the randomisation had no influence on the answers. The second test tests the results of all participants against a null hypothesis that says that the results are randomly distributed. To test which colour should belong to which frequency band a chi-squared test checked if a specific colour was mentioned significantly more than another, combining the re-sponses to multiple words.
5.3
Results
finally, the frequency bands are checked.
[image:26.595.147.448.269.536.2]5.3.1
Chi-squared test: questionnaire version
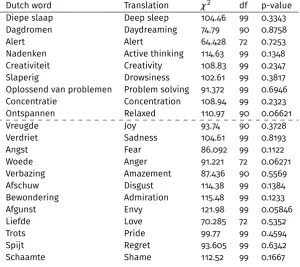
Table 5.4 shows that there exists no statistical dependence between the question-naire versions and the tested words. This shows that the order of the words did not statistically influence the chosen colour. The degrees of freedom differ due to the fact that certain colours were not mentioned with some words. The maximum number of degrees of freedom is 99: (g r oups−1)∗(col our s−1)=(10−1)∗(12−1). But in
some cases such as love only nine colours were chosen, which results in a degree of freedom of 72.
Dutch word Translation χ2 df p-value
Diepe slaap Deep sleep 104.46 99 0.3343 Dagdromen Daydreaming 74.79 90 0.8758
Alert Alert 64.428 72 0.7253
Nadenken Active thinking 114.63 99 0.1348 Creativiteit Creativity 108.83 99 0.2347
Slaperig Drowsiness 102.61 99 0.3817
Oplossend van problemen Problem solving 91.372 99 0.6946 Concentratie Concentration 108.94 99 0.2323
Ontspannen Relaxed 110.97 90 0.06621
Vreugde Joy 93.74 90 0.3728
Verdriet Sadness 104.61 99 0.8193
Angst Fear 86.092 99 0.1122
Woede Anger 91.221 72 0.06271
Verbazing Amazement 87.436 90 0.5569
Afschuw Disgust 114.38 99 0.1384
Bewondering Admiration 115.48 99 0.1233
Afgunst Envy 121.98 99 0.05846
Liefde Love 70.285 72 0.5352
Trots Pride 99.77 99 0.4594
Spijt Regret 93.605 99 0.6342
Schaamte Shame 112.52 99 0.1667
Table 5.4: Chi-squared test to validate that there was no difference between the questionnaire versions
5.3.2
Chi-squared test: goodness of fit
This section describes the results of the test to verify if the responses were divided better than random over the colours. The number of chosen colours is represented in table 5.5 in the columndf, describing the degrees of freedom of the chi-squared test.
The dashed line indicates the difference between the words associated with frequency bands and the words associated with emotion.
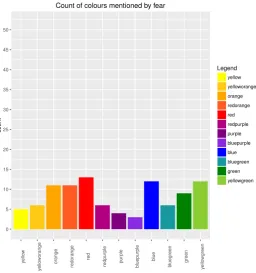
evenly distribution is deep sleep. Figure 5.4 shows that almost half of all participants (n = 45) associate deep sleep with blue. The graphs of the other concepts can be found in Appendix C.
Dutch word Translation χ2 df p-value
Diepe slaap Deep sleep 225.14 12 <2.2e-16 Dagdromen Daydreaming 38.939 10 2.602e-05
Alert Alert 177.33 8 <2.2e-16
Nadenken Active thinking 55.878 12 1.259e-07 Creativiteit Creativity 63.041 12 6.263e-09 Slaperig Drowsiness 46.735 11 2.397e-06 Oplossend van problemen Problem solving 69.939 12 3.289e-10 Concentratie Concentration 51.367 12 8.023e-07 Ontspannen Relaxed 75.755 10 3.391e-12
Vreugde Joy 51.061 10 1.702e-07
Verdriet Sadness 69.143 12 4.632e-10
Angst Fear 16.857 11 0.1122
Woede Anger 466.24 8 <2.2e-16
Verbazing Amazement 33.51 11 0.0004348
Afschuw Disgust 39.878 11 3.754e-05
Bewondering Admiration 51.367 12 8.023e-07
Afgunst Envy 36.51 12 0.0002681
Liefde Love 170.16 8 <2.2e-16
Trots Pride 42.571 11 1.289e-05
Spijt Regret 52.612 11 2.111e-07
Schaamte Shame 95.714 11 1.255e-15
Table 5.5: goodness of fit chi-squared test
5.3.3
Chi-squared test: frequency bands
The goal of the last test is to show that there is a statistical dependence between the words belonging to one frequency band. This is the case with the theta, alpha and beta waves. Table 5.6 shows that there are no significant results, which means that the words that belong to a certain frequency band do not have a common colour that significantly differs from the other colours.
Band χ2 df p-value
Theta - Drowsiness & creativity 71 63 0.2286 Theta - Drowsiness & daydreaming 81 72 0.2189 Theta - Daydreaming & creativity 69 59 0.1138
Alpha 66 63 0.3736
[image:27.595.140.452.174.440.2]Beta 52.333 48 0.3095
0 5 10 15 20 25 30 35 40 45 50 y ello w y ello w or ange or ange redor ange red redpur ple pur ple b luepur ple b lue b luegreen green y ello wgreen count Legend yellow yelloworange orange redorange red redpurple purple bluepurple blue bluegreen green yellowgreen Count of colours mentioned by fear
Figure 5.3: Graph of distribution responses to the concept of fear
5.4
Final colour selection
The goal of this experiment was to choose the colours that represent the different frequency bands: delta, theta, alpha, beta and gamma. Since theχ2-test did not show
a significant relationship for the frequency bands with multiple constructs (see table 5.6), the colours are first determined based on the most votes per colour. For the waves with multiple concepts, the votes are added to result in one majority vote (see table 5.7). Since this does not result in different colours for the bands, and the fact that the colour red is only a majority due to the fact that 51 people associated alert with red and not with relaxed, another approach needs to be taken to determine the colours for the Neurotiq Social. The colours are partially picked based on the votes: delta has the colour blue and beta the colour blue green, however delta is not visualized on the Neurotiq Social. For the other three frequency bands the colours were chosen as follows: yellow orange for theta since this was associated with creativity, green for alpha and purple for gamma, mostly since these colours were distinctive enough from the other colours. The final colours are shown in figure 5.5.
5.5
Discussion
0 5 10 15 20 25 30 35 40 45 50 y ello w y ello w or ange or ange redor ange red redpur ple pur ple b luepur ple b lue b luegreen green y ello wgreen NA count Legend yellow yelloworange orange redorange red redpurple purple bluepurple blue bluegreen green yellowgreen Count of colours mentioned by Deep sleep
Figure 5.4: Graph of distribution responses to the concept of deep sleep Band Colour Number of votes
Delta Blue 45
Theta Blue green 55
Alpha Red 51
[image:29.595.197.388.544.655.2]Beta Blue green 44 Gamma Blue green 23
Table 5.7: Colours for the Neurotiq Social based on majority vote
Figure 5.5: Final colours per frequency band represented on the Neurotiq Social
com-pared to the other colours. This has two reasons, one reason is the fact that the printer printed the blue-purple and the red-purple more purple than they are on the Neu-rotiq Social. Another reason is the fact that the colours are more purple-like on the Neurotiq Social due to the material and the LEDs. Even though this remark was made often, it does not show in the results that people were forced to pick a purple colour often.
The second comment regarded theactivity-words, the words related to the
Chapter 6
Neurotiq Social experiment
6.1
Introduction
The goal of the main experiment is to measure the influence of the inner-state display (Neurotiq Social) on social interaction. As shown in sections 1 & 2 the key-concept is empathy. The concept of empathy is conceptualized towards altruism because altru-ism is a more measurable concept. This results in the following research question: Does an inner-state display increase the level of altruism in a human-human interac-tion?
6.1.1
Dictator game
To measure the level of altruism the dictator game (DG) is used. In the original dictator game there is no contact at all between the allocator and the recipient, but Andreoni & Rao (2011) argues that this does not represent the real world since most of the time altruism does not take place in an isolated setting. Their baseline experiment (the traditional DG without interaction) showed that 15% of the funds were given away.
6.1.2
Hypothesis
Based on the previous and the notion of the need for a control group this experiment has two conditions as well. The experiment condition with the Neurotiq Social and the control condition with just the muse (more on this subject in section 6.2.2). The E-condition of Andreoni & Rao provides the numbers presented in the hypothesis below. There are two hypothesis that are tested in this experiment:
• In the condition with the muse the allocated funds will be higher than 6%
• In the condition with the Neurotiq Social the allocated funds will be higher than 6% and higher than in the condition with just the muse
6.2
Method
6.2.1
Participants
Forty students from the University of Twente (24 men and 16 women) participated in this study, ranging in age from 19 to 30 years old (M = 22.55 years, SD = 2.3637 years). These forty participants participated in couples, the participants were volunteers from the social network of the experiment leader. The couples were made based on the knowledge of the experiment leader to match as many participants with other par-ticipants they did not know. Another restriction was that all the parpar-ticipants were able to speak in their native tongue with each other, in this case Dutch. The couples were randomly divided over the two conditions and also the role of the participants was random, but chosen by the participants themselves without knowledge. Informed consent was obtained from all participants (consent form can be found in appendix D.1). There was no compensation offered except a chocolate at the end. The partici-pants are representative of the population of students at the University of Twente.
6.2.2
Conditions
The experiment has two conditions. The first condition is the condition where the participants wear the muse headsets but not the Neurotiq Social. This condition is to see if the presence of technology itself influences the outcome. The second condition is the Neurotiq Social condition. In this condition the participants wear the muse and the Neurotiq Social is fully operational. Since the Neurotiq Social is heavy, not really comfortable over a longer period of time and are not one size fits all the Neurotiq Social lies in front of the participants on the table during the DC. The set-up is such that the participants do not see their own Neurotiq Social. Separated by a panel, it is ensured that a participant can only see the Neurotiq Social of the other participant.
6.2.3
Apparatus and materials
6.2.3.1 Equipment
in such a way that the view of the cameras was mirrored but identical. The partic-ipants used an iPad to fill in the questionnaires in an individual setting, separated by the same fabric used to separate the researcher from the participants. On the ta-ble where the participants played the dictator game a 30 centimetre high cardboard screen was placed to obscure their own Neurotiq Social from them during the exper-iment. The same Neurotiq Social’s were used for all the participants, and the same Muse-headsets. The Neurotiq Social and Muse assigned to the participant depended on their role. Each participant was given a pen to sign their consent form and the dictator ballot.
Figure 6.1: Set-up Experiment in HMI lab
6.2.3.2 Materials
This section describes all the materials used in this experiment, the questionnaires and other materials that are not mechanical devices. The consent form can be found in appendix D.1. The following three questionnaires were filled in on the iPad, the complete questionnaire can be found here:http://tinyurl.com/jxxkxpt
Inclusion of Other in Self scale The Inclusion of Other in Self scale (IOSS) is used to measure the structure of closeness between the participants. Before the dictator game this scale is used to validate the requirement of limited personal connection between the participants. After the dictator game the questionnaire is used to see if the closeness between the participants has improved or decreased.
factors: neuroticism, extraversion and psychoticism. Neuroticism can be described as emotional instability, people who score high on this scale are often easily scared and worried. They often worry about what could go wrong and they tend to respond emotionally to all sorts of situations (Sanderman et al., 2012). Extraversion is a con-tinuous scale from introvert to extravert. People with a low score on this scale are relatively calm and are more focussed on themselves, they like to plan ahead and will not respond impulsive. People who score high on the extraversion scale are the oppo-site of the introverts. They value social contact, have a lot of friends, try a lot of new things and take risks and are impulsive in comparison to introvert people (Sanderman et al., 2012). The psychoticism scale measure how individualistic people are, scoring high people tend to care less about others and are often cruel, inhumane and insen-sitive. Guilt and empathy are not part of their vocabulary (Sanderman et al., 2012). This questionnaire is chosen because the factors are relevant to this research. There is a short version of the questionnaire and it has been validated in the Netherlands with different populations. Although there are three factors in the personality model of Eysenck, four scales are part of the personality test. The scale that is tested, yet not part of the personality model, is the Lie scale. This scale is used to measure how likely a person is to answer the questions in the other scales as he expects is socially desired (Sanderman et al., 2012). In this experiment the EPQ-RSS, the short version with 48 items was used. This results in a maximum score per scale of 12 points.
Dispositional Empathy To measure the dispositional empathy of the participants, the Baron-Cohen Empathy Quotient is used Baron-cohen & Wheelwright (2004). The Dutch 40-item version is used by De Corte & Uzieblo (2006). This measurement is used to rule out an eventual effect based on characteristics of the dictator.
Dictator game instructions and ballot The instructions for the dictator game were given in writing to the participants. The receiver and the dictator received different instructions in Dutch and the dictator also received a ballot to fill out with his choice and explanation which he/she had to read out loud. The instructions, ballot and trans-lations can be found in appendix D.2.
6.2.4
Procedure
the end of the experiment. After this the participants were debriefed at the centre table.
You are the distributor and your part is: You have 100 lottery tickets. With these tickets you participate in a lottery to win a 20 euro Bol.com-cheque. You can divide these tickets between you both. The receiver is not allowed to say anything. You may divide the tickets the way you want to. You write down the distribution on the ballot and the explanation why you distribute them that way. When you filled out the ballot you read the ballot out loud. The receiver is not allowed to respond on that. After that you can take your place at your iPad and continue the questionnaire.
Figure 6.2: English translation of instructions for the dictator
Ik, de verdeler geef . . . van de 100 lootjes aan de ontvanger. Ik verdeel dit zo omdat:
Figure 6.3: Dutch ballot for distributing the lottery tickets
You are the receiver and your part is: During this part 100 lottery tickets will be dis-tributed. With these tickets you participate in a lottery to win a 20 euro Bol.com-cheque. During this part of experiment you remain silent. You are not allowed to say to or ask something from the other participant. You are allowed to ask the researcher something or stop the experiment. Once the distributor explained how many lottery tickets he gave you and why you can take your place at your iPad and continue the questionnaire.
Figure 6.4: English translation of instructions for the receiver
6.3
Results
This section describes the results of the Neurotiq Social experiment. Firstly, the re-sults regarding altruism are given. After that the rere-sults of the IOSS, also regarding the benefits to society, are discussed. Lastly the results of the questionnaires used to measure the dispositional empathy and the personality are discussed. Since the sam-ple size is relatively small and a normal distribution cannot be assumed, the analysis is done with a non-parametrical test: the Mann-Whitney-Wilcoxon Test.
6.3.1
Lottery tickets and IOSS
and the dictators in the Neurotiq Social condition gave 44.5 lottery tickets away. This difference is not statistically significant: W=53.5,p=0.7655.
Besides the quantitative data of the lottery tickets, the ballot also resulted in qual-itative data. Table D.4 shows the Dutch responses on the ballots and the number of lottery tickets given away. The major theme mentioned in these explanations were fairness (in Dutch indicated by the wordeerlijk). The concept of fairness was both ex-pressed by honesty and also by equal chances. Another theme mentioned was effort, the dictator thought in several experiments that due to the fact that both participants put time and effort into the experiment they should have an equal share (see table 6.1). Only one participant indicated that he did not want to look selfish and gave the receiver more lottery tickets. In the three cases where the dictator gave all or a ma-jority of its tickets away the dictators indicated that they did not see a great value in the bol.com-cheque because they would not benefit from it.
Honesty Equal chances Effort
11 10 2
Table 6.1: Times concepts were mentioned on ballot
Another measurement of a benefit to society is the IOSS, to see if the Neurotiq Social promotes the feeling of inclusion of the other in the self. In general, the ex-periment shows a significant effect, W = 439.5,p<0.001, meaning that people include others more in the self after the experiment (see figure 6.5). However, no significant result can be found when taking in account the conditions or roles. These are tested by calculating the difference between the pre and post experiment value. The conditions are not significant, W = 185,p= 0.6741, nor are the roles, W = 253,p= 0.1278.
6.3.2
Questionnaires
This section describes the results of the questionnaires used to validate that there is no real difference between the condition groups nor between the different roles.
Table 6.2 shows the average scores and standard deviation on the Eysenck person-ality questionnaire of the participants of this experiment on the left and the results of a similar group on the right. This shows that the group students is relatively similar to the validation group used by Sanderman et al., and that makes the premise that this group is representative for the population stronger. Table 6.3 shows that there is no significant difference on any category in none of the conditions or roles. This shows that the conditions are similar enough to compare. A similar result is shown in table 6.4 for the empathy questionnaire.
scale (max. score = 12) mean SD mean SD psychotism 2.58 1.97 3.0 1.9 neuroticism 5.05 3.15 3.8 2.9 extravertism 8.00 3.70 8.4 2.9 social desirability 5.20 2.07 3.8 3.5
0.0 0.5 1.0 1.5
Pre IOS score Post IOS score
Time
Mean ISO score
[image:37.595.165.431.128.398.2]Mean IOS score pre and post experiment
Figure 6.5: Graph showing significant difference in IOS score pre and post the dictator game
Tested category W p-value
Psychotism by condition 189.5 0.784 Psychotism by role 165.5 0.3513 Neuroticism by condition 171.5 0.4462 Neuroticism by role 192 0.8383 Extravertism by condition 221 0.5757 Extravertism by role 161 0.2932 Social desirability by condition 184 0.671 Social desirability by role 260 0.103
Table 6.3: Mann-Whitney-Wilcoxon test: Eysenck personality questionnaire Tested category W p-value
EQ by condition 193 0.8603 EQ by role 185.5 0.7047
Table 6.4: Mann-Whitney-Wilcoxon test: empathy questionnaire
6.4
Discussion
con-ditions the participants gave away almost 50 %. There are a few differences between their research and this, first of all, the participants were allowed to introduce them-selves, even though they were not obliged to do so. This could already create a sense of belonging and empathy. Second of all, there are fewer participants in this research, in the research of Andreoni & Rao there were 40 participants in one condition, in this research there were half that number. It could be that by increasing the number of participants a pattern might become clear. Third of all, and the most obvious of all, the participant population differs. In this research Dutch students from the University of Twente were used as participants, in the original research Americans were used. The cultural difference between the two populations and the different atmosphere with this research using only students from the social environment of the researcher.
6.5
Future work
The discussion above already shows some points of improvement. To gain more in-sight in the benefit of the Neurotiq Social the experiment might benefit from more reg-ulations and anonymity. In this experiment all the participants knew the researcher, which lead to an informal setting which might have influenced the behaviour of the allocator. This was also confirmed by Andreoni & Rao (personal communication, 21th
of June 2016) who said: “We did a study recently where we got big differences based on which of my students was running the study. I’m not sure why, but when we put in a control variable for the experimenter it got a huge coefficient and all the other coef-ficients all shaped up. It was rather frightening to see just how important this was. So, on the one hand I’m not surprised that people will get different results in these set-tings, as I also believe that social cues or influences that we as experimenters are not aware of are at play.”. So a more regulated experiment, with an experimenter that is not acquainted with the participants and keeps to a script that is formal might create a setting in which the participants would behave more like the experiment of Andreoni & Rao (2011). This research also used only students from the University of Twente as participants, who are relatively wealthy and might have considered the chance to win twenty Euro was not enough incentive to keep the tickets to themselves.. So doing this experiment again with a bigger monetary reward could also show a difference between the two conditions. It might also be beneficial to set up a baseline exper-iment with the Dutch student population with a traditional DG. This baseline could then place the results of the following experiments in a better context.
Chapter 7
Focus Groups
7.1
Introduction
Besides the lack of quantitative data proving the use of inner-state displays there is also still a lack of qualitative data showing the attitude of people in general, and especially of Dutch students, towards IDS. There are multiple ways to gather data on attitudes, but one of the more elaborate ways is the focus group. A focus group is a technique involving the use of in-depth group interviews focused on a given topic, with participants who have something to say, rather than being representative of the population (Rabiee, 2004). The group dynamic results in deeper and richer obtained data than from normal interviews. Section 7.2 elaborates more on the used method in a focus group.
As mentioned in chapter 1 the research question for this section is: What is the attitude towards an inner-state display, focussing on the acceptance and usability? This question allows for a broad review of the concept of an inner-state display, how-ever not losing focus of the most important points, usability and acceptance of such a new technique. The first goal is to learn more about the opinion on technology that promotes extimacy and to learn more about acceptance of such technology. Since this product has not been worn a lot and has never been subject to such extensive testing the designer wants to know what the users think about the product. The second goal is to see if the designers intention for this product also corresponds with the user’s ideas.
7.2
Method
7.2.1
Participants
7.2.2
Apparatus
The focus group interviews took place in different rooms, but with a similar setting. There were two tables placed aside from the other tables with six chairs where the par-ticipants and the leader sat down. The microphone array used to record the session was placed in the middle of the table and a video recorder was placed in the corner to have a back up for sound or for situations that required a review of the video material to deduce the meaning of a quote. Furthermore, a laptop was placed at the location of the leader to monitor the audio recordings and to start the Neurotiq Social and to show the visualisations. There were two Neurotiq Socials used in the focus groups.
7.2.3
Procedure
7.2.3.1 Focus group interview
The participants were asked to prepare before the focus group interviews by reading up on the topic. The mail sent can be found in appendix E.1. The procedure can be found in appendix E.2 and the consent form can be found in appendix E.3. In general, there were three phases, the experimental phase, the discussion of the experiment and the general discussion. The experimental phase was the phase in which two of the participants volunteered to wear the Neurotiq Social and did a six-minute exercise in which they did the following:
1. Continue talking and doing what they were doing before wearing the Neurotiq Social.
2. Close their eyes and relax
3. Serially subtract 7 from 1000 (Fitzgibbon et al., 2004)
These three tasks were chosen for the following reasons: the first because it would allow the wearers and observers to get used to the Neurotiq Social and set up a base-line. The second task because it should trigger a lot of alpha activity and the last task because if should trigger a lot of gamma activity according to Fitzgibbon et al. Since the activity would change the observers should be able to distinct between the dif-ferent tasks and get a sense of the use of the Neurotiq Social. After these six minutes the wearers and observers were asked to discuss the observations (phase two) and experiences and were shown a figure in which the brain activity was shown over the whole two minute tasks rather than the livestream of the Neurotiq Social. Figure 7.1 shows an example of such a visualisation, showing a clear increase in alpha (green) in the second task and gamma (purple) in the third task.
but the main lines were: What do you think of the Neurotiq Social and what would you change? In what situations would you use the Neurotiq Social? What do you think of ISDs?
7.2.3.2 Analysis focus group interviews
The method to analyse this focus group data is based on the work of Rabiee and Krueger & Casey. Since Rabiee based his framework upon Krueger & Casey’s the focus will lie upon the framework of Rabiee.
There are some important characteristics a focus group should have before it func-tions optimally. The first is the participants, those should feel comfortable around each other, have similar characteristics and should have something to say. The op-timum size of a focus group differs, but around six people should be manageable. Rabiee (2004, p.656) describes this as large enough to gain a variety of perspectives and small enough not to become disorderly or fragmented. Also the environment, physical as well as social, should make the participants feel at home and relaxed so they feel free to talk about the subject in a personal matter (Rabiee, 2004).
Appendix E.1 shows the mail sent to the participants to inform them about the procedure and give them more information about wearables and the Neurotiq Social and the procedure that follows once the participants arrive. This procedure is based on the guidelines of Krueger & Casey (2001).
The data from the focus group is all spoken words on a recording, to analyse these recordings they needed to be transcribed. Rabiee (2004, p.657) describes the analysis process as follows: “The process of qualitative analysis aims to bring meaning to a situation rather than the search for truth focused on by quantitative research.”. There are five key stages to the analytical process: familiarization; identifying a thematic framework; indexing; charting; mapping and interpretation (Rabiee, 2004).
familiarization By reading the transcripts multiple times, watching and listening to the tapes and reading the notes from the focus group the researcher gets famil-iar with the data. This way the researcher gets a sense of the whole discussion before breaking the interview into parts (Rabiee, 2004).
identifying a thematic framework After reading the text multiple times ideas and con-cepts arise from the text, in this phase these ideas are written in the side line still following the chronological order of the questions.
indexing In this phase quotes are highlighted and sorted, based on the concept of Krueger & Casey (2001). This research used open coding to create and analyse the concepts
charting The quotes from the previous stage are lifted from their original context and placed on the formed concepts and categories. Together with the previous steps, these steps are used to reduce the data (Rabiee, 2004).