Jurre van Ruth
23-10-2015
University of Twente
Improving problem detection and focus for Root Cause
Analysis through Case-Based Reasoning and Group
Decision Support Systems
i
Jurre van Ruth
Student number s1076981
E-mail [email protected]
Master thesis
Titel Improving Problem Detection and focus for
Root-Cause Analysis through Case-Based Reasoning and Group Decision Support Systems
Study Business Administration
Date 23 October 2015
Supervisors
University of Twente
First supervisor Dr. A.B.J.M. Wijnhoven
Second supervisor Dr. M. de Visser
Unilever – Ben & Jerry’s Hellendoorn
Supervisor Tessa Meulensteen, Msc
iii
Management Summary
The demands for Ben & Jerry’s Hellendoorn are growing. The products are ordered almost more than the factory can take and therefore it produces at max capacity. To guarantee quality, data can offer a solution. This report focuses on linking outputs of different IT systems to benefit root cause analysis.
First of all a process- and data analysis is done to identify the starting point of the research. This showed that the data outputs all register in a different way which eliminates the chance of data linkage. Because of this, data analysis had to be done manually and was often skipped since it was so hard and time-consuming to do. The solution to this was to translate the data into datasets with the same characteristics or, in other words, attributes. Another problem was, that since the data was hard to read, it was also hard to communicate it to the workforce. So data had to be made readable. By integrating the data outputs into a database where data is transferred into a coherent dataset, data linkage was enabled. Then by conducting a tool that could filter and present the data, the data was made usable. A certain input can be entered into the tool and the tool then shows all the data that is related to this input. This tool gave focus for root cause analysis and it identifies problems and root causes. Also the tool can monitor what happens at the market to products that had a certain intervention.
In addition, some recommendations from this research are shown below:
Extent CRQS. The inpack results of CRQS needs to be registered in SAP, since they are linked
to quantity and texture problems, which hold the biggest share of complaints.
Standardize data registration. The data from the carelines often holds data that is not
registered correctly. For example, the batchcode, which always should end with 011, is often registered as o11. This complicates data translation and readability.
Collect all measurement data. By collecting and storing all the data, the used norms can also
be subject to critique.
Implement tools in Vispro. To have all the data analysis at one central point, the detection
tool and month report should be built in Vispro. This would also enable live data analysis for all the measurements that are registered into Vispro.
Revise Vispro. All though, Vispro is considered hard to use. The usability of Vispro is low and
it does not give a clear overview.
Extent five whys analysis registration. The current five whys analysis misses the five steps
iv
Preface
This research is performed in order to graduate from the Master Business Administration at the University of Twente. By combining my research with a working internship, managing this research project was a real challenge and opportunity to develop my educational, professional, and personal skills. Doing so, would not have been possible without the help and support of others. Therefore I would like to use this opportunity to thank everybody involved.
First of all, I would like to thank Tessa Meulensteen for hiring me for the working internship and allowing me to combine this with my research. Without the possibility and support to spend that much time on my research and the every week sparring sessions, the level of the endproduct would not have been reached. Furthermore, I would like to thank John Bestman, Leon ter Braak and Ron Strijker for their effort, support, insights and willingness to contribute to my research. During my 6 months internship, I believe to have developed myself at a professional and personal level due to their constructive feedback and guidance. But most of all I would like to thank the entire Ben & Jerry’s factory for the tremendous time I have had there, it was a pleasure which I truly enjoyed.
A second word of thanks goes to Fons Wijnhoven and Matthias de Visser, for their valuable feedback and sparring sessions. Their extensive input and recommendations was crucial in defining and executing this research and writing the report. A couple of times I got stuck, but with their theoretical insights they reassured me and got me going again.
Lastly, a special word of thanks goes to my mother for her support, listening ears and inspiration, which in the end formed the basis of my success.
vi
List of abbreviations
CBR Case-Based Reasoning
CCpMU Consumer Complaints per Million sold Units CIT Critical Incident Technique
CRQS Consumer Relevant Quality Standard DSS Decision Support System
GDSS Group Decision Support System
HACCP Hazard Analysis & Critical Control Points
IS Information System
IT Information Technology
KPI Key Performance Indicator NRFT Not Right First Time RCA Root Cause Analysis
SAP Systems, Applications & Products in data processing SNCR Supplier Non Conformance Report
SU Sourcing Unit
TPS Toyota Production System TQM Total Quality Management
QA Quality Assurance
vii
Inhoud
Management Summary ... iii
Preface ... iv
List of abbreviations ... vi
1. Introduction ... 1
1.1 Context and Problem statement ... 2
1.2 Current Root Cause Analysis method ... 3
1.3 Manufacturing process ... 5
1.4 Quality measurement reports ... 6
1.4.1 Consumer Complaints ... 8
1.4.2 Blockades ... 9
1.4.3 Hygiene ... 10
1.4.4 CRQS ... 11
1.4.5 SNCR ... 11
1.4.6 QIS ... 11
1.4.7 Metal detector... 12
1.4.8 X-ray... 12
1.4.9 Week report ... 12
1.4.10 Month report ... 12
1.5 Current performance of Root Cause Analysis ... 12
2. Theory ... 13
2.1 Root Cause Analysis ... 13
2.2 Problem detection ... 16
2.3 Learning from experiences ... 17
2.4 Group Decision Support System ... 23
2.4.1 Information system ... 23
2.4.2 Group Decision Support System ... 23
2.5 Design ... 28
3. Method ... 32
3.1 Research question ... 32
3.2 Research methods ... 33
3.3 Participants ... 37
3.4 Research scope ... 38
4. Product Design ... 38
viii
4.2 Database or Data warehouse ... 42
4.3 Month report ... 44
4.3.1 Production & Sales ... 45
4.3.2 Market incidents ... 45
4.3.3 Consumer complaints calculation ... 45
4.3.4 Blockades calculation ... 45
4.3.5. Hygiene in the factory calculation ... 46
4.3.6 CRQS calculation ... 46
4.3.7 SNCR supplier judgment ... 46
4.4 Detection tool ... 49
4.5 CBR tool ... 55
5. Results ... 59
5.1 What did the tool enable in the cases ... 59
5.2 Achievement of tool criteria... 63
6. Conclusion and Recommendations ... 66
6.1 Research question ... 66
6.2 Contributions to literature ... 68
6.3 Contributions to practice ... 69
6.4 Recommendations ... 69
6.5 Limitations and future outlook ... 70
Literature ... 72
Appendix... 80
Appendix A; Specified overview of manufacturing process at Ben & Jerry's Hellendoorn ... 81
Appendix B; Description of database attributes for each entity ... 85
1
1.
Introduction
In extensive and complicated manufacturing processes, several sensors and quality tests often register an abnormality during the process. The time taken, until the abnormality or failure in the process is identified and successively eliminated, results in lead-time or even unplanned production stoppage, which leads to loss of production and eventually loss of profit. When a problem occurs, many sensor signals and reports need to be analysed to find the cause of the problem. But only intervening of automated sensors can solve not all abnormalities. Frequently, human interaction is required (Weidl, Madsen & Israelson, 2005). The operator needs efficient detection of abnormalities and disturbances to come to educated decisions, based on both artificial intelligence and human experience, to identify probable root causes.
A Root Cause Analysis (RCA) is an analysis, which focuses on finding root causes of problems. According to Rooney & Vanden Heuvel (2004), analysing a root cause helps discover what, how and why a certain event occurred and results into the possibility to prevent the event from reoccurring. So in other words, a company must learn from its faults and especially the root cause of these faults. When looking at multiple of these root causes, sometimes trends can be discovered (Rooney & Vanden Heuvel, 2004). To learn from these trends, organizations should extract the right intelligence from multiple sources and transform it into useful knowledge (Smith, 2001). The approach of Case-Based Reasoning (CBR) is a problem-solving paradigm that, instead of re-lying only on general knowledge of a problem, utilizes the explicit knowledge of previous related experiences (Aamodt & Plaza, 1994). A Decision Support System (DSS) can facilitate these processes by its capability to retrieve information elements and files, create reports of these various files, and represent this data through modelling (Mcleod & Schell, 2001).
The purpose of this research is to explore how RCA can benefit from the use of a DSS to optimize finding of and learning from root causes. The goal is to come up with the best way to design and implement a DSS in RCA, in such a way that the RCA benefits the most.
2
1.1 Context and Problem statement
In the food industry there are high standards on the quality of the product and production, because a minor mistake can lead to huge problems (Choi & Lin, 2009). For example, a label in a different language could lead to peanut-allergists being unable to read whether there are traces of peanuts in the product. This could lead to severe injuries or even death. That is a packaging problem, but also when the product is produced at the same line where products holding peanuts are made, this could lead to traces and this of course must be noted. But there are also problems that could harm the brand itself. For example, when there is always more ice cream in the cup than mentioned on the cup, the manufacturer is practically giving away free ice cream. Reputation wise, damaged packaging could lead to consumer complaints, which then again harms the reputation of the manufacturer (Choi & Lin, 2009). These are just some of the great amounts of consequences the production process could have.
To guarantee optimal quality and food safety, Ben & Jerry’s Hellendoorn has several quality measurements and wields strict regulations on hygiene. Quality Assurance (QA) facilitates these quality checks and strives to keep the factory and the manufacturing process at the quality that is required for food standards. Then the Quality Control team checks whether quality is actually reached conform the regulations. Several teams at Unilever’s HQ are in collaboration with the local QA team always searching and evolving to find the best possible measurements to guarantee the product’s safety and quality. These measurements become quality measurements that are performed through the entire manufacturing process of ice cream at Ben & Jerry’s Hellendoorn. Some of these measurements turn into Key Performance Indicator’s (KPI’s), which are indicators that tell an organization what to do to stimulate performance drastically (Parmenter, 2007).
3
To improve the RCA at Ben & Jerry’s, QA wants to integrate the documentations into one system where all the information can be found so efficiency and effectiveness of the RCA improves. The resulting question from Ben & Jerry’s Hellendoorn is: How can multiple IT system outcomes be integrated so relations can be identified, resulting in higher RCA efficiency and effectiveness?.
The separate IT system outcomes will serve as the basis for a new to be conducted system. A system that enables higher efficiency and effectiveness of decisions is a DSS (Power & Sharda, 2007). Since a group of multiple users must have access and use the system, a GDSS is applicable. How must this integration be done so the best possible RCA for Ben & Jerry’s is conducted?
RCA literature shows that a RCA can majorly benefit from access to extensive data sets (Rooney & Vanden Heuvel, 2004; Wu, Lipshutz & Pronovost, 2008; Taitz, et al. 2010). However some authors indicate that combining documentations can also lead to information overload (Chervany & Dickson, 1974; Eppler & Mengis, 2003; Bawden & Robinson, 2009). Some researchers in the field of DSS say that combining documentations minimizes the effort expenditure put into the decision-making, but that it does not influence the quality of the decision (Payne, Bettman & Johnson, 1988; Todd & Benbasat, 1992). Nonetheless, several authors do mention that DSS does enable effectiveness, so also quality is increased (Sharda, Barr & McDonnell, 1988; Leidner & Elam, 1994; Radermacher, 1994; Power & Sharda, 2007). Some authors discussed DSS for RCA (Weidl et al., 2002; 2005).
1.2 Current Root Cause Analysis method
4
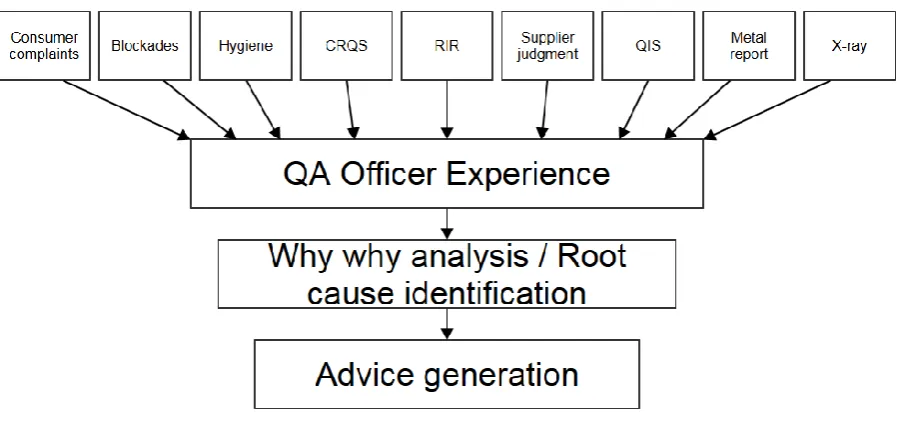
[image:13.595.74.525.83.296.2]As can be seen in figure 1, a why why analysis is done as a method of RCA. The why why analysis, also known as the five whys analysis, is a RCA method comparable to flowcharting but five whys starts at the final output and by asking “why questions” works back revisiting the results of processes and investigating the actions that preceded them (Robitaille, 2004). The five whys method has its origin in the world famous Toyota Production System (TPS). It is even opted that TPS is the world’s most important intervention in production since Henry Ford’s production line contributions (Staats & Upton, 2011). In short, TPS is about increasing production efficiency by consistently and thoroughly eliminating waste, it does so by implementing several methods including Just-in-Time manufacturing, Kanban, Kaizen and several others (Ohno, 1988). All these methods are about eliminating waste. Taiichi Ohno, one of the originators of TPS, proposed the five whys method to root out problems and fix problems for good and so reoccurrence of the problem is eliminated (Alukal, 2007). The five whys method, also when not applied to a problem, starts with the assumption that instead of thinking that an approach for a process is right, it is wrong (Staats & Upton, 2011). With this way of thinking also waste that is not obvious, since it has been part of the operation for a long time, can be tracked down. Literature also shows that the five whys method is often used as a tool for root cause problem solving to solve quality problems (Pylipow & Royall, 2001; Nelsen, 2003). The found root causes are normally deep and corrective actions at those deep levels are broadly based and long lasting. Benjamin, Marathamuthu & Muhaiyah (2009) state that even though the five whys is based on corrective action, it can be viewed as both corrective as well as preventive since it aims at deep nestled causes that, if not eliminate, would likely cause new problems. Although the name states five whys it is not necessarily five times that why needs to be asked to discover the relationship between cause and effect (Fantin, 2014).
5
Robitaille (2004) formulated some advantages and drawbacks for the five whys analysis. The advantage of a five whys analysis is that it is informal and easy to execute, and it uncovers causes that could easily be overseen or ignored. However, the drawbacks are that the analysis relies on other tools to validate the actual cause with facts and it is of limited value of there are multiple causes contributing to the problem. This last drawback can cause a wrong focus on merely attention is given to one cause where actually multiple are contributing to the problem, this is why it is important to store results and check whether the wanted effect occurred and learn from it. The last drawback can also be overcome by not drawing out a singular five whys line but also highlight multiple causes if applicable (Robitaille, 2004).
Then the second type of RCA that is applied focuses on data analysis. A QA officer dives into the measurements and data available at the factory and searches for certain trends. However, due to the fact that measurements cannot be linked to each other, these trends are only searched for within a certain measurement type and not between different types.
It is strived that these two RCA types are utilized together and therefore coexist. However, since the data cannot be linked to each other and data is found in different systems, the data analysis is highly time consuming and therefore is often left out.
1.3 Manufacturing process
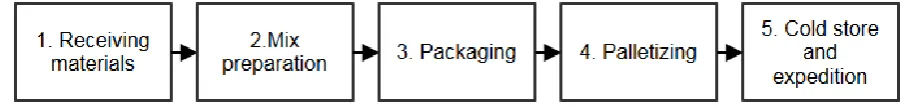
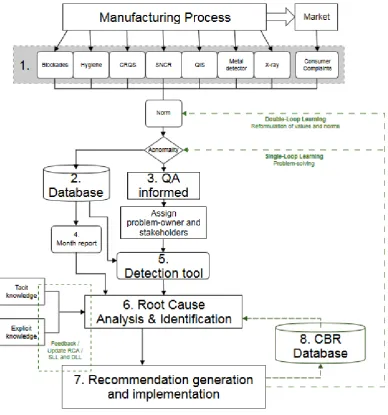
To really understand the origin of the extracted information, it is beneficial to take a look at the entire process of ice cream making at Ben & Jerry’s Hellendoorn. The outline of the manufacturing process is given in figure 2 and consists of five steps. These five steps are specified and expanded in appendix A.
[image:14.595.69.524.575.631.2]The first step in the ice cream manufacturing process is the receiving of raw materials. Those received raw materials are then judged and prepared for manufacturing which consists of repackaging, labelling and storing the materials at the right place and temperature.
6
The second step is mix preparation. At the basis of every ice cream of Ben & Jerry’s lay the same basic mixes. These mixes basically contain cocoa, condensed skim milk, cream, egg yolk, stabilizers, sugar, and water. The exact compositions of these products depend on the type of ice cream. The ingredients then are mixed, homogenized, pasteurized and cooled. Next, the mix will be flavoured accordingly. The mix is then stored in a flavour tank until further use is demanded.
After that, the mix is processed further on the production lines. At Ben & Jerry’s Hellendoorn there are three lines that produce Ben & Jerry’s ice cream, being B&J 1K, B&J 2L, and B&J 3M. First the kept stored mix is transferred from the flavour tank to the ice cream freezer. After freezing, the chunks and sauces are adjoined and the ice cream is injected into cups. Subsequently, lids are placed on the cup. To check whether the cups are added conformal, the cups are weighted. After this the cups immediately receive a tracing code called lot code, and shelf life-date at the bottom of the cup. Next the cups are put on a vibrating table which checks whether the lid is placed firm enough on the cup. The cup then goes into the hardening tunnel; this tunnel lowers the temperature to such an extent that the ice cream gets the right structure. When the product is hardened, the cup gets a seal on its lid to secure and guarantee integrity of the product. Then the metal detector assures that there is no metal in the final product, so consumer safety is guaranteed. At the last step op phase 3, the cups are wrapped in plastic foil and labelled in dependent compositions.
Once the cups are labelled, they move on towards the palletizing department. Palletizing is also done automatically. A robot stacks the bundles of cups on a pallet and the pallets are then wrapped and labelled.
After palletizing the pallets are moved to the right location in the cold automated storage, the warehouse where the product is kept until they are ordered and picked for distribution. The pallet is then loaded into a truck and the ice cream moves to its next destination.
1.4 Quality measurement reports
7
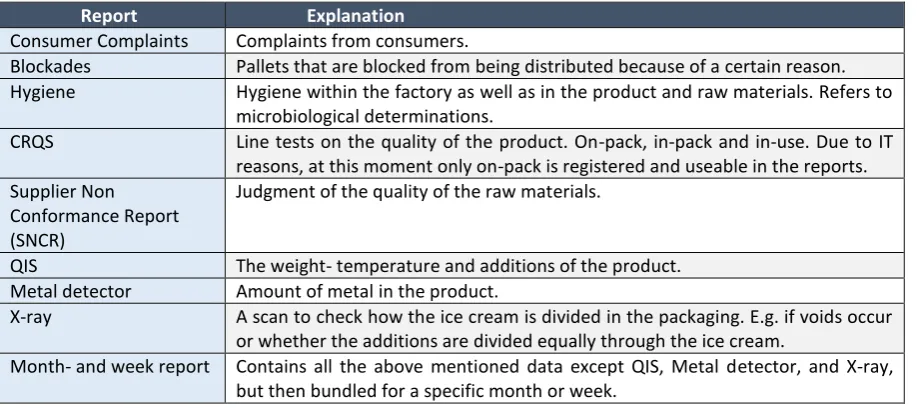
Table 1; Measurement reports and explanation of Ben & Jerry's Hellendoorn
Report Explanation
Consumer Complaints Complaints from consumers.
Blockades Pallets that are blocked from being distributed because of a certain reason. Hygiene Hygiene within the factory as well as in the product and raw materials. Refers to
microbiological determinations.
CRQS Line tests on the quality of the product. On-pack, in-pack and in-use. Due to IT reasons, at this moment only on-pack is registered and useable in the reports. Supplier Non
Conformance Report (SNCR)
Judgment of the quality of the raw materials.
QIS The weight- temperature and additions of the product. Metal detector Amount of metal in the product.
X-ray A scan to check how the ice cream is divided in the packaging. E.g. if voids occur or whether the additions are divided equally through the ice cream.
Month- and week report Contains all the above mentioned data except QIS, Metal detector, and X-ray, but then bundled for a specific month or week.
Almost all the reports are in excel, but they originate in several different programs. The programs that are used are SAP, Vispro, QIS and LIMS.
8
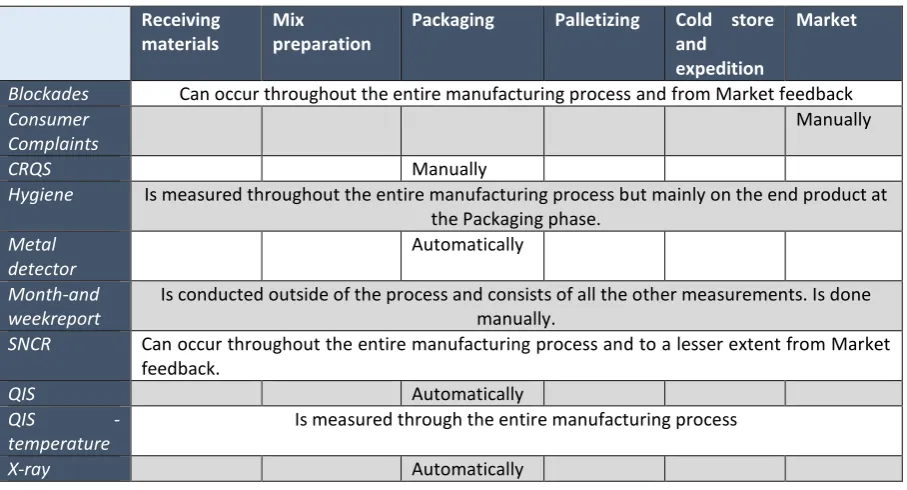
Table 2; Placement of measurements in manufacturing process
Receiving materials
Mix
preparation
Packaging Palletizing Cold store and expedition
Market
Blockades Can occur throughout the entire manufacturing process and from Market feedback
Consumer Complaints
Manually
CRQS Manually
Hygiene Is measured throughout the entire manufacturing process but mainly on the end product at
the Packaging phase.
Metal detector
Automatically
Month-and weekreport
Is conducted outside of the process and consists of all the other measurements. Is done manually.
SNCR Can occur throughout the entire manufacturing process and to a lesser extent from Market
feedback.
QIS Automatically
QIS -
temperature
Is measured through the entire manufacturing process
X-ray Automatically
Of these reports some are done automatically and some are done manually. The ones that are done automatically are QIS, metal detector and the X-ray. The manual measurements are Consumer Complaints, since the complaints from the market are received and registered at a complaint centre. The CRQS is done by line operators and is filled in manually.
A couple of the measurements also feature a signal system that pushes out a product that does not meet the requirements for that test. The measurements that wield such signal systems are, the metal detector, X-ray, and the weight-, and temperature measurement, which can be found in QIS.
1.4.1 Consumer Complaints
9
When the data is received at Ben & Jerry’s Hellendoorn, a QA officer then checks whether the list contains consumer complaints that addresses ice cream originating from the factory at Hellendoorn. When this check is done, the data list is shared with the rest of the QA team. To sum the valuable data up, it contains a caseID, the date, the factory, the product type, the complaint type, the production code, and the real complaint.
The consumer complaint report is often the problem on which a RCA is then set up. But the report is also addressed for information to look for example whether more complaints on the same product came in etcetera.
1.4.2 Blockades
The report on blockades is a report that defines the blockades that have been applied. Blockades are applied because something was wrong with a certain product. For example, a differentiating ice cream cup has been detected during the production of a certain ice cream type. This could eventually lead to a consumer buying a cup of ice cream flavour A, but when he or she opens the cup it contains flavour B. This can lead to complaints and therefore the pallets that contain such a wrong cup are blockaded from being distributed. This is always done by a QA officer. How such a blockade can be abrogated depends on the type of problem that could be a widespread of things.
The QA officer registers a blockade in SAP. Then the blockades are extracted from SAP and placed into a list, which contains all the blockades. The data that this list contains is, a follow-up number, product code, product type, blockade type, production date, production line, production code and the blockade definition.
10
A blockade is indicated as a B-incident when a product is in the market place which is safe, but does not meet specification in terms of any or all of the following; performance, composition, functionality, appearance, taste, smell, durability, integrity, legality, or regulatory. All of this to the extent that the product poses a high level of risk to Unilever corporate or brand reputation.
A C-incident occurs when the product in the market place is safe but is substandard. The product can be used by consumers without difficulty throughout shelf life and it poses a very low level of risk to Unilever corporate or brand reputation.
Then a D-incident is still at the factory or in a distribution centre. It refers to finished formulas or finished products that do not meet agreed specifications, HACCP requirements or consumer/customer standards, resulting in finished products or formulas being placed on hold for further evaluation.
A complaint turns into an incident and eventually a blockade if any or all of the following identifications are found during the investigation of the complaint.
1. Retain/reference samples show the same defect as a complaint of the same lot code. 2. A systemic loss of control in the manufacturing process is identified.
3. Operating procedures and work instructions can be shown to not been followed.
4. Missing documentation from SU records for the affected lot(s) & therefore it is unable to verify product quality.
5. A systemic loss of control at suppliers is reported/identified. 6. Blocked product has been released inadvertently
7. Product abuse in Unilever controlled warehousing and distribution centres is identified. 8. A new product design is causing significant adverse consumer feedback above the norm
expected for a new product launch. Investigation verifies that product use is problematic and causes difficulty for consumers.
1.4.3 Hygiene
11
information on the results from the microbiological tests that are done in the laboratory. The microbiological bacteria’s that are tested are all in a certain way catalyst of sickness, so to prevent people from getting sick of the product; these bacteria’s are constantly measured.
1.4.4 CRQS
CRQS is a visual measurement on product quality. Several tests are done at the production line on on-pack and in-pack matters. On-pack refers to tests that are done on the outside of the product, for example dents in the package or seal malfunction of the lid. In-pack addresses tests that are done when the product is opened. This could be for example a void in the ice cream and division of chunks and sauce. The results of these tests are then logged into a program called Vispro. The tests can be scored in this program into green, amber or red. A test is green when it past the requirements, amber when it past the requirements but is still okay to be moved onto the market and a test is red when it failed the requirements and the product therefore is not allowed to be distributed.
A QA officer then transfers the data from Vispro to SAP. Unfortunately, the current functionalities of the used SAP transaction only allow in-pack results to be registered. This will be changed, but when is not yet determined, so in-pack CRQS results will not be addressed in this research. The data which is placed in SAP is then exported to an excel sheet and this excel sheet is the CRQS report. The data contains information on the material type, the problem category and definition, the production code and the lot code.
1.4.5 SNCR
The SNCR is a report on the assessment of the suppliers. Each supplier and its deliverables are constantly evaluated so Ben & Jerry’s can guarantee what it promises and can guarantee a certain quality standard. All of the supplied goods are evaluated and from these evaluations sometimes come complaints that a certain standard is not met. Therefore this complaint is communicated towards the supplier. All of these complaints are documented into SAP. Also when production had already been started with the raw material, the amount that have been produced is blockaded from being distributed and so the SNCR cases that are applicable to the end product will show up in the Blockades report described in 1.4.2.
1.4.6 QIS
12
report. For this reason the temperature and weight measurements will be extracted from the blockades report.
1.4.7 Metal detector
The metal detector shows whether there is metal present in the product. All the products containing metal are expelled from the production line. The report of this measurement shows for which time periods there was a high amount of metal traced. Products that have been manufactured in that time period will be checked whether the repel mechanism did its job and excluded all the products containing metal from the process.
1.4.8 X-ray
The X-ray scans the content of products and composition. Ben & Jerry’s has certain standards on how the division of the contents of the ice cream should be. For example, chunks must be placed all through the product and not all of them at the bottom. And every sauce-holding product has a different way that the sauce should be placed in it, for instance swirled or cored. The X-ray report shows how much abnormalities have been detected and how much of them are rejected from pursuing the production line.
1.4.9 Week report
Every week a report is conducted that addresses week-to-week results on complaints, SNCR, CRQS, and blockades. This report is the week report. Besides quantitative information this also contains qualitative data being information from management on what happened during that week and some extra notes.
1.4.10 Month report
The month report contains several quality measurement results and how they scored over a month. Indicators that are used in the month report are recall, consumer complaints, production, blockades, sales, hygiene, CRQS, and SNCR. For almost all these reports there are KPIs to which they must comply. A clear line can be seen in this month-to-month data on how the factory performs on quality. If possible the reports are divided into factory- and production line score. The month report only contains quantitative data.
1.5 Current performance of Root Cause Analysis
13
at this moment according to the QA manager, the factory misses out on problem and root cause detection in the measurements, since measurements cannot be linked to each other. Because the RCA and data analysis lacks structure, it takes a lot of time to conduct one and the process is even more delayed due to the gathering of all different reports. Also since several measurements cannot be linked to each other, cohesion between reports can hardly be illustrated and therefore the identification of root causes and problems itself is hindered.
2.
Theory
2.1 Root Cause Analysis
Every problem has an origin, which is the cause of the problem. When battling a problem where the cause is not identified, it is highly likely that only the symptoms are eliminated which does not stop the problem from happening again. Because of this, it is crucial to identify the root causes of the problem and eliminate them (Wilson, Dell & Anderson, 1993; Andersen & Fagerhaug, 2000). A root cause therefore is identified as the most fundamental instigator of a problem.
A tool that helps identify possible root causes of problems is the RCA (Doggett, 2005). The origin of the RCA according to Andersen & Fagerhaug (2000) lies in Total Quality Management (TQM). They identify RCA as a problem-solving process and one of the fundamental building blocks of continuous improvement. RCA is often used across the supply chain of medical care and software development (Siekkinen, Urvoy-Keller, Biersack & Collange, 2008; Wu, Lipschutz & Pronovost, 2009; Lynn & Curry, 2011). The work by Rooney & Vanden Heuvel (2004) also states that RCA can be used in a high variety of contexts with a problem that has impact on elements like environment, health, production, safety, quality, and reliability.
14
causes of a problem and the components that these root causes affect using a structured approach and come up with ways to prevent the problem from reoccurring. So a RCA exists out of 1) identifying root causes and 2) how they influence other factors, and 3) preventing a problem from reoccurrence by tackling the root causes.
When doing a RCA it is important, according to Rooney & Vanden Heuvel (2004), to search for root causes that management can control. This means for example that operator error is not sufficient enough, but the root cause could be that the operator made the error because of inadequate instructions and even then the question can be asked why the instructions are inadequate. Then management can control these instructions. Management should decide when a root cause is deep and sufficient enough, otherwise it is possible to keep asking yourself why something happened. Taitz, Genn, Brooks, Ross, Ryan & Shumack (2010) elaborate on this statement. They argue that the propensity of humans to make errors cannot be exterminated, and instead of pointing the finger towards the individual, it is needed to discover and resolve the underlying system vulnerabilities that allowed the human error to happen. So the authors put emphasis on the fact that it is important to search for the deeper underlying root cause and that the recommendation should be complete and be learned from.
15
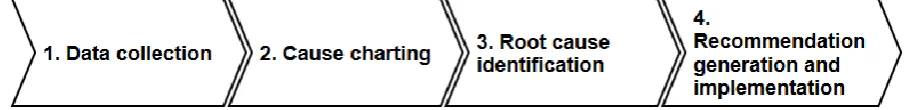
Like mentioned before, RCA is a structured investigation to find the root causes of a particular event to prevent the event from reoccurring. There are three questions underlying RCA; 1) What happened?, 2) Why did it happen?, and 3) What can be done to prevent it from happening again? (Wu et al., 2008; Taitz et al., 2010). Since these three questions focus on the discovery of root causes and how to prevent a problem from reoccurring, Wu et al. (2008) added an extra question to facilitate aftercare; 4) Has the risk of reoccurrence actually been reduced?. This fourth question requires recommended corrective actions and a blueprint to verify that the corrective action has the intended outcome. Then Rooney & Vanden Heuvel (2004) arrange RCA into four steps: 1) Data collection, 2) Cause charting, 3) Root cause identification, 4) Recommendation generation and implementation (figure 3).
When employing a RCA, Anderson & Fagerhaug (2006) strongly suggest to use multiple tools to come to the root causes to guarantee reliability of the outcomes. Every tool has a single or multiple principles that it serves best, an organization should strive for the best combination so the tools complete each other. Gano (2007) underlines the use of multiple RCA tools to serve one goal to optimize the capacity and improve the RCA outcomes. Taitz et al. (2010) even suggest that recommendations should be removed from the RCA if using merely one RCA tool does the RCA. So RCA should always be done by implementing multiple tools.
Just like multiple RCA tools should be used, a problem could also have multiple root causes. Wu et al. (2008) strongly recommend keeping an eye on the greater picture. Meaning that the problem-solver should check the found singular path, but also compare it to previously similar found paths, and to not eliminate the chance of a problem having two or more root causes, meaning it is a combination. Leszak et al. (2000) agree on this matter and conclude that the final RCA result should be multiple dimensional and not just focuses on one facet of the root cause.
[image:24.595.70.526.284.339.2]While the power of RCA is high, the RCA tool or tools themselves do not generate results. One of the most important aspects of RCA is the mind-set of the people engaging in the RCA. This mind-set should be a conscious attitude that comprises a relentless pursuit of improvement at every department-, or level-, or process of a firm (Anderson & Fagerhaug, 2006). Also according to Leszak
16
et al. (2000), RCA is a never ending process that should be collaborative, continuous, and the improvement capacity of a firm should be sufficiently facilitated otherwise results will get lost.
Carrol et al. (2002) and Kumar & Schmitz (2010) emphasize that the RCA process should embody a historical timeline of events so trends can be discovered. Carrol et al. (2002) conclude that it is very important to indicate differences between similar events to check what happened last time and which countermeasures were applied, so similar ones could be applied or the countermeasure could be adjusted if the last time did not reach the envisioned results.
2.2 Problem detection
17
2.3 Learning from experiences
Like previously mentioned, RCA can be optimally utilized when a learning element is exploited. This learning element means that the users learn from the found root causes and use them to prevent future reoccurrence. The concept of single- and double loop gives great possibilities for this way of learning; these two concepts are often discussed in combination with the concept of deutero learning (Argyris & Schön, 1978). These are all forms of organizational learning. Organizational learning can be described as the ways organizations build, complement and organize knowledge and routines around their activities and within their organizational cultures, and adjust and develop organizational efficiency by improving the utilization of the skills of the employees (Dodgson, 1993). Crossan, Lane & White (1999) then assign four processes of organizational learning; intuiting, interpreting, integrating, and institutionalizing, also known as the 4Is. It is presumed that 1) learning always has positive consequences, since organizations can also learn from mistakes, 2) learning influences the knowledge of the entire workforce, and 3) learning occurs in all the elements and activities of a firm, motivating and organizing learning is an essential task of an organization in this process (Dodgson, 1993).
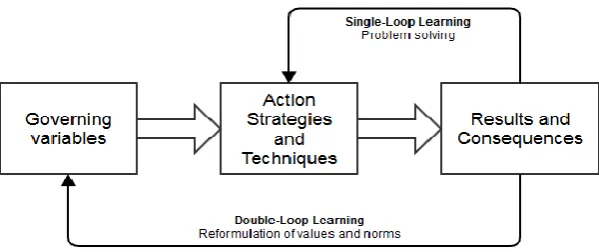
Deutero learning includes Single-loop learning (SLL) and Double-loop learning (DLL). SLL is the learning process where an organization adapts to changing inputs, but does this without changing the existing pre-set norms (Wijnhoven, 1995). In the context of RCA this could for example be that a certain root cause is found for the problem that the right temperature is not met, and the suggested action is to buy a new freezer. This is single-loop since it solely focusses on problem solving without adjusting the predefined norms. DLL is where an organization changes a norm. So for example that an organization changes the norm for the temperature that must be met. This results in a continuous change in a process. Wijnhoven (1995) describes this as DLL being about changing the pre-set norms due to the ineffectiveness of the existing norms. DLL is often not required when the context of an organization is stable and has low complexity, since low risk environments often discourage the search for innovation (Wijnhoven, 2001). The need to retain existing knowledge, which is done in SLL, can hinder the process of DLL, since the unlearning of old knowledge and the learning of new knowledge is required in DLL (Levinthal & March, 1993).
18
cognitive rethinking and critical reflection on an organization’s core assumptions. And on the other side, deutero learning is conceived as the institutionalization of learning processes, which is in this case the establishment of appropriate structures, capabilities, processes, and strategies to facilitate learning at the organizational level (Huysman, 2000; Geppert, 2000). However, since the article by Wijnhoven (2001), deutero learning is seen as the institutionalization of SLL and DLL.
DLL focuses mainly on reflecting on current knowledge, which can be divided into tacit- and explicit knowledge (Aamodt & Plaza, 1994). Dhanaraji, Lyles, Steensma & Tihanyi (2004) even state that when conducting research about knowledge, it is critically important to differentiate between the tacit and explicit form. To summarize the definition of tacit- and explicit knowledge like mentioned in the introduction, tacit knowledge is ‘know-how’ and is often reflected in personal experience and is regularly referred to as intuition or expertise, explicit knowledge is ‘know-what’ which is formally described in some sort of organizational documentation (Smith, 2001). Nonaka & Takeuchi (1995) opt that tacit knowledge is abstract and can only be transmitted through active involvement of the knowledge owner, but explicit knowledge is highly standardized and is therefore suitable to be communicated by the use of formal and systematic language. While an organization is built upon explicit knowledge that can be seen as building blocks, the organization cannot survive without tacit knowledge, which resembles the glue that keeps the building blocks together (Dhanaraj et al., 2004).
19
important to make use of organizational documentation like manuals and methods to exclude misinterpretation (Jasimuddin et al., 2005).
Explicit knowledge according to the research by Eraut (2000) always originates from tacit knowledge. Tacit knowledge regularly stems from implicit learning, which is a learning process that focuses on the development of intuitive knowledge (Reber, 1989).Tacit knowledge then can be made explicit by reflecting on the actions taken from tacit knowledge (Schön, 1987). However, it is important to acknowledge that tacit knowledge does not always have the goal of being turned into explicit knowledge, it are not two ends of a continuum, but rather two sides of a coin (Tsoukas, 2002). The 4Is by Crossan et al. (1999) can further clarify the process from tacit knowledge towards explicit. The first phase, intuiting, refers to the creation of experiences, images, and metaphors; this intuitive knowledge can be seen as tacit knowledge. The intuiting process is often a preconscious recognition of patterns and possibilities. Intuiting affects the individual owning the intuitive knowledge and it only affects others when interaction is established between the knowledge owner and others. In the next phase, interpreting, the preconscious knowledge is transferred to words and interpreted, which often leads to the development of language, which starts the way of tacit knowledge becoming explicit. Integration, is the penultimate phase, here it is strived to develop shared understanding of the knowledge among individuals. The output is that coordinated action must be taken through mutual adjustment. Lastly, institutionalizing is the process to ensure that routinized actions occur, which makes the knowledge fully explicit. Reoccurrence is reached through defining tasks, specification of actions, and organizational mechanisms that are placed in the right way. Institutionalizing embeds learning that occurred by individuals into the organization.
20
In short, the governing variables refer to why an organization does what it does. The action strategies and techniques can be explained to what an organization does. And the results and consequences are the outcomes and therefore can be defined as what the organization obtains. So SLL is where the results lead to adjustments in the actions taken, and DLL leads to adjustments of the standards wielded by an organization.
A concept where learning loops are constantly applied is CBR. CBR looks at past cases and the solutions that have been formed for a certain case and later on evaluates whether these cases have reached the intended goal and if the solution is also applicable to new cases. Kolodner (2014) writes that in CBR, new problems are approached by comparing and contrasting them with previous similar events. So CBR utilizes previous experiences on a topic to help solve new problems or even prevent problems from happening in the first place. By reusing solutions to similar problems CBR is an approach to sustained learning, since a new experience is collected each time a problem has been answered, making it available for future problems right away (Aamodt & Plaza, 1994). So past experiences are used for future problems, this can be seen as SLL. If the previous solution does not work, then the solution is adapted and tested, if this solves the problem, then the new experience is stored and retained to use in the future (Jonassen, Strobel & Lee, 2006), this process can be seen as DLL.
Kolodner (2014) states that CBR is not that difficult to carry out, but the difficulty lays in collecting and storing the information in the right way. People in their day-to-day lives already apply CBR, in short an example:
Jane plans to have a nice day off with Marc. She remembers seeing Marc ride his bicycle at a
Sunday. She wonders whether he likes to ride his bike for recreational purposes or merely
functional. Marc did seem relaxed on his bike and he was not in a hurry, Jane remembers.
[image:29.595.147.447.70.196.2]Jane is wondering whether a nice bike ride would be fun to do during their day off. She thinks
21
that a more relaxed type of bike ride would be appreciated more than an off-road mountain
bike trip. Perhaps a bike ride on the country side would be nice. The bike ride goes past lakes,
and Jane knows that Marc likes lakes.
In this example, Jane is using examples and counterexamples of an idea to try and obtain an understanding of Marc’s preferences. Jane is employing CBR to plan a day trip. In CBR the exploiter is remembering previous situations that are in agreement with the current situation and uses them to help solve the dilemma. So besides just remembering past experiences, CBR also is about adjusting old solutions to meet new demands, using old cases to interpret a new situation, or create an satisfying solution to a new problem, or using old cases to explain new situations, or using old cases to reflect on new solutions (Kolodner, 2014). So two of the main concepts of CBR are experience and knowledge (Jonassen et al. 2006). Knowledge in the light of learning is often divided into tacit- and explicit knowledge (Smith, 2001). Tacit knowledge is described by Smith (2001) as “practical, action-oriented knowledge or ‘know-how’ based on practice, acquired by personal experience, seldom
expressed openly, often resembles intuition” (Smith, 2001, p. 314). And explicit knowledge is defined as “Academic knowledge or “know-what” that is described in formal language, print or electronic media, often based on established work processes, use people-to-documents approach” (Smith, 2001, p. 314). To optimize the management of knowledge and learning from knowledge, tacit knowledge should be turned into explicit knowledge to make the knowledge become part of a firm’s knowledge network (Herschel, Nemati & Steiger, 2001). Linking tacit- and explicit knowledge to CBR means that this process of tacit knowledge to explicit knowledge helps store the information used for CBR and makes the knowledge for CBR more accessible.
22
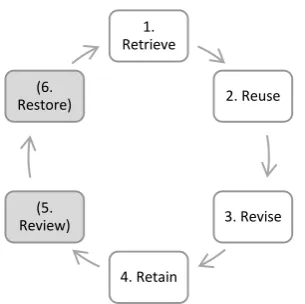
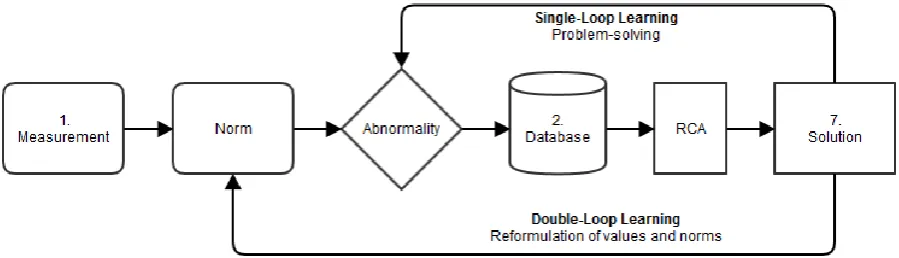
Iglezakis, Reinartz & Roth-Berghoffer (2004) added two stages to the 4-stage CBR model, being 5) Review, and 6) Restore. After the retaining phase, Iglezakis et al. (2004) state that the retained experience should be 5) reviewed and subsequently 6) restored so it can be 1) retrieved again for future usage (figure 5). Arguably, phase two where reusing is strived for, can be seen as SLL since inputs for that case are changed, but the norms stay the same. In phases three till six it is all DLL, since standards are revised, adjusted and restored, so norms are changed.
CBR can also be very helpful when applied to problems that have not occurred before or are not similar to previous problems. According to Leake (1996), the use of CBR enables more creative problem solving. It makes the problem-solver think and lay linkages between certain actions and outcomes; this makes the problem-solver more aware of the impact of actions, which helps to discover the solution. Leake (1996) then identifies five main elements that can be reached through the use of CBR; 1) knowledge acquisition, 2) knowledge maintenance, 3) Increasing problem-solving efficiency, 4) Increasing quality of solutions, and 5) User acceptance.
[image:31.595.223.376.191.343.2]A RCA can be maximally exploited when the users learn from the results from past performances; this is where the functionalities of CBR are applicable. In the concept of CBR it is important to look at past results. The tasks of CBR are often characterized into two classes; 1) interpretive CBR, and 2) problem-solving CBR (Kolodner, 2014). Interpretive CBR utilizes previous cases as a reference for organizing or distinguishing new situations. The goal is to form a decision about or classification of a new situation, by comparing and distinguishing it with cases that already have been classified (Ashley & Rissland, 1987; Leake, 1996). Problem-solving CBR uses previous cases to propose solutions that might be applicable to new situations. The goal is to employ a previous solution to produce the solution to a new problem (Leake, 1996). A situation that a user however must be wary of is that by emphasizing the previous cases, the user can miss out on slight differences (Wachter, Shojania, Saint, Markowitz & Smith, 2002).
Figure 5; Stages of Case-Based Reasoning based on Aamodt & Plaza (1994) and Iglezakis et al. (2004)
1. Retrieve
2. Reuse
3. Revise
4. Retain (5.
23
2.4 Group Decision Support System
CBR is a methodology that needs storing of knowledge and analysis of this data, DSSs are appropriate for this. DSSs are systems that “…make advanced quantitative analyses of data and simulations of possible events and consequences of decisions.” (Wijnhoven, 1995, p. 10). To get a clear view of what a DSS is, it is important to first take a step back, since a DSS is a type of information system (IS). This subchapter first, addresses IS and after that goes more specific towards the concept of DSS, and the problem-solving power of a DSS.
2.4.1 Information system
According to Boddy, Boonstra & Kennedy (2009), an IS is a set of people, procedures and resources that gathers data which it disseminates and converts. Computers enabled IS to become both cheaper and faster because of the data- and information processing capability of computers. However, it is important to acknowledge that an IS does need both people and technology.
Boddy et al. (2009) classify ISs into four main purposes: communication, decision support, monitoring, and operational. Communication systems enable easier exchange of information between and around organizations. They overcome barriers of distance and time. Decision support systems also known as knowledge systems, empower managers to calculate consequences of certain actions. A monitoring system assesses the performance of activities, processes or functions. Operational systems focus on process routine transactions and enable the exchange of data between organizations.
2.4.2 Group Decision Support System
24
solution for a group of members (DeSanctis & Gallupe, 1987). This definition is similar to the one by Mcleod & Schell (2001) only does the definition by DeSanctis & Gallupe (1987) specify to a group of members. Bui & Sivasankaran (1989) state that the higher the task complexity, the higher efficiency and effectiveness GDSS will achieve. However, for low task complexity they found that efficiency decreased and satisfaction of usage is decreased.
[image:33.595.70.519.181.366.2]
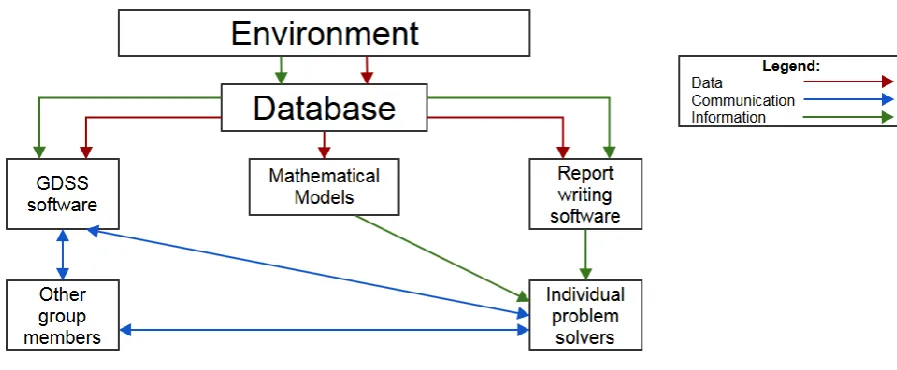
Figure 6; Descriptive model GDSS (Mcleod & Schell, 2001)
The purport of the explanation by Mcleod & Schell (2001) is as followed. First they distinguish three types of exchange that operate in their model, being data, communication and information, which can be found in the legend. The difference between data and information sounds vague but data refers to measurements etcetera and information refers to extra non-registered information. So information could for example be that a QA officer asks some extra questions to a production operator. Then to start, the GDSS always operates in a certain context, which in this model is identified as environment. Data and information is gathered from this environment and placed into a database. A division between data and information has been made to indicate data measured from systems and extra information that is gathered manually. The information from this database then goes to report writing software and a communication method being the GDSS software. Besides that, the data from the database then is used for the GDSS- and report writing software, and towards mathematical models. The data is processed in these three components and then the problem-solver or decision maker extracts the outcomes from this. The problem-solver can get the help of other group members by communicating directly with them or through GDSS software. The individual problem-solver then decides on the final recommendation and decision.
25
GDSS tend to be focused at semi-structured and unstructured, underspecified problems that upper level managers face, 2) GDSS attempt to conjoin the exploitation of models or analytic techniques with traditional data access and retrieval functions, 3) GDSS specifically focus on properties which make them easy to use by non-experienced people in an interactive mode, and 4) GDSS emphasize adaptability and flexibility to facilitate changes in the environment and the user’s decision making approach.
McLeod & Schell (2001) discuss GDSS extensively in their book. They outline the power of GDSS in solving problems with powerful algorithms and decision rules. GDSS helps in this process by 1) retrieval of information elements, 2) retrieval of information files, 3) Creation of reports from multiple files, 4) estimation of decision consequences, 5) propose decisions, and 6) Make decisions. So it is a great facilitator of the management of knowledge. According to the research by Hosack , Hall, Paradice & Courtney (2012), GDSS enable better understanding of large amounts of data because of the interactive possibilities that a GDSS gives. This interactivity is for example the processing of algorithms with different datasets filled in. The enablement of interactivity makes it possible for the user to experiment with different datasets and see what the outcomes are, without actually applying adjustments to reality (Hosack et al., 2012).
Through recent years the availability of business intelligence and analytics systems has extended the capabilities of GDSSs to data-driven forecasting, real-time analytics, and performance management (Watson, 2005). The interactivity that these analytical systems give, according to Sprague & Carlson (1982), enabled faster analyses and interpretation of results. The use of modelling and algebraic calculations in DSS, referred to by Power & Sharda (2007) as model-driven DSS, gives great possibilities for doing analysis of a situation.
By implementing powerful quantitative models and calculations, various decision analyses can be conducted (Wang, 1997; Power & Sharda, 2007). One of such a decision analysis is comparing of different outcomes, which allows discovering, differences and weaknesses and strengths, which subsequently will lead to better inputs for future usage (Sharda et al., 1988).
26
user is also likely to change, since the GDSS gives new insights and helps to think creatively, so again it is important to learn from past processes.
Now a closer look is taken at the components of GDSS. Mcleod & Schell (2001) opt that a GDSS contributes to problem solving by improving communications, improving discussion focus and wasting less time. Improving communications does not mean that a GDSS actually has a communication component; it can simply be to enable the option to communicate. Power & Sharda (2007) also say that it is not necessary to build a communication component into the GDSS, when managers find such a channel unnecessary. Alternatively they can choose to communicate directly through portals or communication channels that are already at hand. According to Turban (1995) and Power (2002), GDSS consists out of four main components: 1) Model base, 2) Database, 3) User interface, and 4) architecture and network. The model base refers to the way the data from the database is processed and analysed. The data could be subject to for example algorithms or modelling. The database refers to the collection of data that is used for the decision-making. The user interface is the way the usage is presented to the members. This user interface includes both the way the data and models are presented and the way the communication is presented. The last component, architecture and network refer to the way that the network is used, so what is the communication and GDSS process used for the decision-making (Power, 2002).
Now that the GDSS components are clear, a focus can be taken on what the GDSS process looks like. So what happens at which time and how is the final decision reached. However, according to DeSanctis & Gallupe (1987) it is rather difficult to come up with a general process since every situation can vary in such a way that a process would be less applicable to a certain situation as opposed to another one. To overcome this problem DeSanctis & Gallupe (1987) took a step back and made a more general process description on how to setup a GDSS. The process can be found in figure 7.
The GDSS shell can be seen as the basis for GDSS. The shell provides a selection of features possibly useful to a variety of decision-making members. So the first three out of four GDSS components are defined and chosen in this phase. Then the second phase is the taxonomy of systems, this phase can be defined as the accommodation of the needs and dynamics of special group situations. Group size
27
and member proximity is important to deal with in this phase, can the members interact phase-to-phase or are they dispersed. And whether the group is of small or large size. So during the second phase it must be decided and defined how the members are able to communicate and how much members are involved. The last phase is the role of task. This phase defines the particular task that confronts a group. The particular task also influences all the GDSS components since it is the primary reason why the group is together working on a certain case. A group’s task can be characterized by its, criteria for success, goals, imposed time, rules, roles, and consequences of success or failure (McGrath, 1984). The role of task then also consists out of three different phases, which are found in figure 8. The phases generate, choose, and negotiate define the goals that a group must accomplish and all the phases consist out of two tasks. The first phase is about generating ideas and actions; the group should come up with action-oriented plans. And the creativity task refers to that the group needs generation of novel ideas. Then in the choose phase, the group must orientate on alternative ideas, and then the intellective task makes the group select a selection of corrective alternatives. And in the preference task, the group must come up with the best ideas. In the negotiating phase the group negotiates the residuary ideas. The cognitive conflict task involves resolution of conflicting viewpoints, and the mixed-motive tasks involve resolution of conflicting motives or interests. A GDSS should be able to provide the members during these phases with data and models to make the members able to select ideas or guide the members towards ideas (DeSanctis & Gallupe, 1987). So also in this situation, the entire group of members should have access to this system.
Shih, Wang & Lee (2004) conclude in their research that by making use of a GDSS the decision quality increases, which is also found in the experimental study by Limayem, Banerjee & Ma (2006). Limayem et al. (2006) found that when a GDSS did not have a positive influence on decisional outcomes, this could be attributed to ironic appropriation of the GDSS. This means that the GDSS did not serve the group task and was utilized in differing way than the purport of the GDSS. The most remarkable conclusion in the research by Shih et al. (2004) is not the decision quality, but that also the qualitative consensus of a group increases when a group makes use of GDSS, since the GDSS provided the members with better understanding of the motives and reasoning of others. Shih et al. (2004) also state that data collection and processing is the most time-consuming element in the decision-making process, however by making use of a specified GDSS that provides analytical processing, the GDSS can greatly limit the invested time for data collection and processing. Excel is a
28
great and efficient tool to build such a customized GDSS, nevertheless, its inflexibility and adjustability makes Excel vulnerable, thus Shih et al. (2004) suggest to make use of a fully executed program if this is possible.
When starting to use a GDSS it is important to consider the way it is implemented. According to Dickson, Partridge & Robinson (1993), a facilitator should chauffeur the members through the GDSS to make the members comfortable with the system. Building up experience through repeated use following the work of Dickson et al. (1993) is the best way to get the members familiar with a GDSS. Therefore it is important to assign a lead user of the GDSS that will serve as the facilitator.
2.5 Design
Like is stated by Turban (1995) and Power (2002), GDSSs possesses a user interface element where data is presented. Smith & Mosier (1986) outlines that a poor designed user interface often needs to be compensated by extra user effort and that therefore a good user interface is critical for effective system performance. However, a design flaw, in itself, of user interface will not cause system failure, but users can only adapt to a certain extent to poorly designed interfaces (Smith & Moser, 1986). A dashboard is a tool that is utilized by management to clarify and assign accountability of data, such as KPI’s, key objectives, and projects to steer the organization towards its mission statement (Gitlow, 2005). In this case, the month report will represent KPIs, but the detection tool is about representing data. The increased use of support business operations and advances in business intelligence, lets organizations monitor and analyse processes to help a firm understand where it is falling behind and how to improve (Rodriguez, Daniel, Casati & Capiello, 2010). However, data alone will not lead to better understanding, data is necessary but not sufficient, data should be presented in such a way that it becomes understandable to the user (Marcus, 2006). Besides just presenting data to measure performance, visuals can help managers access and analyse their KPIs more easily, saving time and confusion (Wyatt, 2004). The concept of dashboards has the ability to make data more understandable if it provides significant patterns of data (Marcus, 2006). How must this dashboard or user interface be designed and how can this user interface be appointed so it enables the GDSS contributions described by Mcleod & Schell (2001), being; better communication, improve discussion focus and it limits the waste of time.
29
30
the user on this matter to optimize dashboard usability. To ensure optimal acceptation and adaptation of the user it is wise to obtain early input and feedback from the group of users. The last area of focus for dashboard design is 3) dashboard navigation. Navigation includes deciding how the total information will be divided across the various dashboard elements and linking charts and reports to allow user drill-down for greater details of data. The key elements for dashboard navigation are; information grouping and hierarchy, tabs and pivots, and context drill-down. Information grouping and hierarchy refers to the fabrication of information in different dashboard groupings. Subsequently these groupings also help decide what group is at which hierarchical level, given the importance and priority of the content. Commonly dashboards consist out of two levels, where on the main page the parent level has links or tabs that link to the drill-down information. Tabs and pivots refer to the way of navigating through different windows. Tabs are common tabs that the user can click on to navigate to a different window. A pivot refers to a drop-down list that makes the user able to choose from several options. Preferably tabs are used, but when there are a lot of windows pivots can give outcome since it takes up less space. Context drill-down is very important for the navigational experience of the user. It provides to possibility to obtain additional levels of informational details when a user clicks on a specific element of the dashboard. It is important to have a relevant destination to the source, or in other words, the user must be navigated to expected data when clicking on a certain source.
31
32
stable system. Data must be protected from unauthorized access and data must be protected from errors by users, in effect to protect users from their own mistakes.
However, merely focusing on guidelines is not enough according to Van Welie, Van der Veer & Eliëns (2001). They conclude in their research that guidelines can lack in applicability. Therefore design of user interface should focus on the context of a problem and solution, this way the user interface guides the user towards its goals. To a small extent, this can also be found in the above described guidelines by Smith & Mosier (1986) where focus on the user’s task is advised.
To summarize, improvement of communication and discussion focus and reducing of wasted time can be achieved by having a good data entry and display, and by enabling sequence control, user guidance, data transmission, and data protection, the chance of design flaws are minimized and a high system performance is reached. Also the data should represent reality and trigger the user to think about the substance. Besides just the presentation of the data, also navigability is important to keep in mind. This must be to the point and be coherent to the expectations of the user.
3.
Method
Now that the theoretical background is clear, a look is taken at how this will shape the research and what the research will look like.
3.1 Research question
Elaborating on the problem statement, the theory and the question of Ben & Jerry’s Hellendoorn, the following research question is formulated:
How can integrating Case-Based Reasoning and Root Cause Analysis into a Group Decision Support
System benefit Root Cause Analysis?