Health-seeking behaviour and student perception of
health care services in a university community in
Nigeria
M. O. Afolabi1*, V. O. Daropale1, A. I. Irinoye2, A. A. Adegoke3
1
Department of Clinical Pharmacy & Pharmacy Administration, Faculty of Pharmacy, Obafemi Awolowo University, Ile-Ife, Nigeria;
*
Corresponding Author: bunmafol@oauife.edu.ng, bunmafol@yahoo.com 2
Medical & Health Services, Obafemi Awolowo University, Ile-Ife, Nigeria
3
Faculty of Social Sciences, Obafemi Awolowo University, Ile-Ife, Nigeria Received 20 February 2013; revised 30 March 2013; accepted 16 April 2013
Copyright © 2013 M. O. Afolabi et al. This is an open access article distributed under the Creative Commons Attribution License, which permits unrestricted use, distribution, and reproduction in any medium, provided the original work is properly cited.
ABSTRACT
Objectives: Examining consumers’ healthcare behavior can help in the design of ways to en-sure better access to health and the quality of care. Health-seeking behavior is viewed as the varied response of individuals to states of ill- health, depending on their knowledge and per- ceptions of health, socioeconomic constraints, adequacy of available health services and atti- tude of healthcare providers. This study exam- ines health-seeking behavior of university stu- dents, their use of healthcare services in the com- munity and barriers to seeking help at the uni- versity health centre. Method: Structured ques- tionnaires were validated and administered on a random sample of university students spread over different academic disciplines in a large in- stitution. The sample consisted of 1608 under- graduate students attending the public univer- sity in southwestern Nigeria. The demographic profile reflects the national university student population. Relevant information was collected on preferred health services consulted by the undergraduates such as barriers to seeking ade- quate medical attention and their experiences with salient aspects of service delivery. Respon- ses were weighted and the average was taken to be representative. Results: Students consulted their peers (37.5%) in health related academic disciplines rather than seek treatment at the university health centre. Some students (24.7%) preferred community pharmacies while others took personal responsibilities for their health or abstained from medical care for religious rea-
sons (16.8%). Significant barriers to seeking me- dical attention at the health centre were cost of care, protracted waiting time, inadequate health information, unfriendly attitude of healthcare workers and drug shortage. Conclusions: Stu- dents sought help from community pharmacies (ease of access) and from peers in health related academic programmes rather than from physi-cians at the health centre. Health-seeking be-havior of the students was influenced, essen-tially, by the nature of ailment, waiting time in the health facility and attitude of healthcare professionals. Implications for policy, practice or delivery: The findings of this research identi-fied the relative use of available health services within the university. Initiatives to improve stu-dent access to the university health centre should address significant barriers of patient delays, the need for attitudinal change and continuing professional development of relevant workers in the health facility. Promotional activities may be necessary to inform and educate students on ra- tional use of medicines and access to treatment at the health centre.
Keywords:
Health-Seeking Behaviour; Healthcare
Services; University Health Centre1. INTRODUCTION
has important policy implications in health system de-velopment. People seek help on health issues based on several reasons and the factors which influence the choice of treatment sources when symptoms occur in-clude socio-cultural factors, social networks, gender and economic status. Access to healthcare facilities in terms of cost of treatment and healthcare provider attitude are also determinants of health seeking behaviour. There are indications that cost of prescribed medicines, poor access to facilities and patient delays affect the patronage and utilisation of public health services which increase the use of other treatment sources such as community phar-macies, drug peddlers, herbal medicine, religious or spiritual care organizations and students in health related academic disciplines [2].
Ill health is a major life event which may cause people to question their existence as this condition disrupts basic activities which are essential to a healthy living. Spiritu-ality has been found to play a critical role in mitigating the pains and sufferings of ill-health because the rela-tionship with a transcendent being or concept can give meaning and purpose to people’s lives and sufferings. Several studies and surveys have demonstrated the rele-vance of spirituality in the health of patients [3,4].
Individuals differ in their choice of treatment sources depending on the type and perceived intensity of sick-ness; accessibility to the public health facility and demo-graphic characteristics [5]. What people do when they have symptoms of illness has major implications for morbidity and progression of the illness and conse-quences for creating a healthy community. Delays or refusal in seeking and obtaining proper diagnosis and treatment can allow for a greater probability of adverse sequelae. Some studies have examined health-seeking behaviour in rural communities [6-9] but there has been no similar survey of healthcare preferences among stu-dent population in Nigeria. An understanding of health- seeking behavior of students in the university community is important if a healthy community is to be maintained. Apparently there are barriers to seeking appropriate healthcare at the university health centre for a number of reasons. Currently, there is neither empirical data on the level of patronage of alternative sources of healthcare in the university community nor the impact of service de-livery on the utilisation of the organised healthcare facil-ity. It is believed that such knowledge would assist the university authority in the management and development of accessible and effective healthcare services. The ob-jectives of this study are to determine the level of pa-tronage of healthcare facilities within the university community and to assess students’ views of the services at the university health centre with a view to identifying possible barriers to effective utilisation of the institu-tion’s health facility. In this study, health-seeking behav-iour is viewed as a tool for describing how individuals
engaged with healthcare facilities within the university community.
2. METHOD OF STUDY
A sample of 1740 undergraduate students was selected by stratified random sampling from a population of 30,000 students in a large public university in Nigeria. A structured questionnaire was administered on the stu-dents at different times when they came for their classes. All the students who were present at the selected largely attended lecture periods were eligible to participate in the study, but only those who gave their consents constituted the sample. A total of 1608 duly completed questionnaire were returned representing 92.4% response rate. The questionnaire elicited information on the type of health services consulted by the undergraduate students, barri-ers to seeking medical attention at the univbarri-ersity health centre and their perceptions of services at the delivery points. Collected data were analysed using descriptive statistics and SPSS (v.14). Due ethical approval was ob-tained from the Ethics and Research Committee of Obafemi Awolowo University Teaching Hospitals Com-plex, Ile-Ife.
3. STUDY AREA
The survey was conducted in Obafemi Awolowo Uni-versity (OAU) Ile-Ife, one of the first generation univer-sities in Nigeria. OAU, Ile-Ife was founded in 1962 and the university has a student population of about 30,000 students with nearly 24,000 as undergraduates. About 25% of students reside in the university hostels within the university community as at the time of this study. The university has a health centre located centrally on the campus and this primary healthcare centre has facilities for routine laboratory diagnosis, x-ray, physician con-sulting unit, pharmacy dept, nursing services, records department, wound dressing room and in-patient bed facilities for short term admissions. Other healthcare facilities within the university environment included a community pharmacy, patent medicine stores, religious organisations for spiritual care and alternative medicine itinerant sellers, all these were located in close proximity to the students’ residential area.
4. CONCEPTUAL FRAMEWORK
of the peculiar settings before data collection. The re-search instrument was then administered on consenting students across the sampled faculties. The final ques-tionnaire consisted of both structured and open ended items to elicit information on relevant determinants of health-seeking behavior and perceptions of healthcare services in the institution. The focal indicators relevant to the purpose of this study included access to healthcare personnel, perceived quality of service, economic and socio-demographic factors. The socio-demographic data collected on the characteristics of respondents included sex, academic programme and religious belief. Data ga- thered on the physical access and quality of service in- cluded sources of healthcare in the university community and perceived quality of service at the university health centre, with emphasis on the availability of prescribed medicines, perceived competence of staff and their atti-tude and possible barriers to patronage of healthcare ser- vices at the health centre.
5. STUDY DESIGN AND RESEARCH
INSTRUMENT
Questionnaire survey of a cross section of students in different academic programmes was carried out and fo-cus group interviews conducted with purposively se-lected students accessing healthcare at the health centre. Structured multiple choice items were designed to yield scaled responses to the study items. Health-seeking be-havior was measured by listing the questionnaire items and asking respondents to indicate level of agreement to perceived quality of care received from the health per-sonnel, adequacy of infrastructure and access to the fa-cility, using 5-point Likert scales (Strongly agree, Agree, Disagree, Strongly disagree and Can’t say; (with scores of 4, 3, 2, 1 and 0 respectively). Furthermore, in an at-tempt to identify preferred sources of healthcare, re-spondents were asked to indicate the frequency of pa-tronage from a list of some types of health facilities available in the university community. Similarly, the fre-quency of use was indicated on 5-point Likert scales (Every time, Very often, Often, Rarely and Never with values of 4, 3, 2, 1 and 0 respectively). Perceived barriers to the use of the health centre were measured using such indicators as waiting time, adequacy of health informa-tion, staff attitude, access to healthcare personnel and availability of prescribed medicines. Respondents were asked to indicate the extent to which some perceived barriers limited their utilisation of the institution’s health centre (Every time, Very often, Often, Rarely, Never with values of 4, 3, 2, 1 and 0 respectively). The questionnaire solicited information on socio-demographic status, aca-demic programme and religious beliefs of the students. Essentially, the questionnaire items were structured to determine the pattern of utilisation of available
health-care services in the university; preferred sources of healthcare consulted by the students and possible barriers to effective utilisation of the health centre.
6. SAMPLING AND DATA COLLECTION
TECHNIQUES
Undergraduate students of the university are required to take general elective courses in academic faculties other than their own and the classes for such electives are usually large and representative of students from differ-ent academic programmes. Three of such classes were targeted for the survey. Every student was eligible to be a part of the study. However, only those students who agreed to participate were enlisted to complete an ano- nymous, self-administered, structured item questionnaire conducted within a classroom setting and overseen by a research coordinator who had been trained on the ques-tionnaire contents and administration. The quesques-tionnaire was administered on 1740 students in three major aca-demic programmes of the university: Science and Tech-nology, Humanities and Health Sciences.
7. DATA ANALYSIS
The collected data were analysed using SPSS v 14.0 software. Descriptive statistics were used to examine relative influence of the determinants of health-seeking behavior and utilisation of healthcare facilities in the community. Selected factors affecting health-seeking behaviour were ranked in order of importance and the weighted averages (WA) of the responses were computed to determine the level of agreement with the question-naire items. Using the scoring of 0 to 4 on a 5-point Likert scale response mode, the deciding rule for the level of agreement was that any weighted average up to 2.50 or more was considered to be an agreement (A) with the questionnaire item while a value less than 2.50 was considered as a disagreement (D). Availability of health services was assessed by the degree of satisfaction with doctor’s consultation and medicine supply in the phar-macy while the accessibility of service was determined by their perception of the attitude of health workers, op-erating hours and waiting time at the health facility.
8. RESULTS
ex-penses on healthcare, up to 60% of respondents spent less than 10 USD on medication in 4 months while only 3.9% spent more than 30 USD. The study showed that self treatment was the commonest form of care by re-spondents. The initial choice of care in ill health was self medication with medicines purchased over the counter or obtained through friends or neighbours. This was fol-lowed by visits to the health centre, patent medicine dealers, the community pharmacy, consultation with stu-dents in health related academic programmes and use of herbal remedies (Figure 1). Focus group interview indi-cated that the private health facilities were the initial choice of treatment for majority of students and the utilisation of university health centre was usually the last choice of care for reasons of excessive waiting time.
[image:4.595.59.286.424.540.2]Table 2 shows the frequency of patronage of health-care services available in the university community. A ranking of the responses based on the weighted average showed the community pharmacy as the most patronised followed by the doctor’s clinic, while traditional healer was least patronised.
Table 3 shows the responses to salient aspects of healthcare services at the health centre and perceived barriers to utilisation of the facility. Based on the weighted average, the ranking showed that cost of care posed the highest barrier followed by protracted waiting time in the health facility but accessibility in terms of
0 0.5 1 1.5 2 2.5 3
Patronage of Health Care Providers
[image:4.595.57.287.584.736.2]level
Figure 1. Patronage of health care providers.
Table 1. Demographic distribution of respondents.
Variables No %
Gender
Male Female
Total
827 781 1608
51.4% 48.6%
Religious belief
Christianity Islam Other religions
Total
1393 164
52 1608
86.6% 10.2% 3.2%
Academic discipline
Health sciences Science & Technology
Humanities Total
282 286 1040 1608
17.5% 17.8% 64.7%
location was not considered a barrier to patronage by the respondents.
Table 4 shows delay experiences at service delivery points in the health facility. The respondents experienced considerable delay at the doctor’s clinic followed by de-lay period at the medical records but the nursing unit was considered to be relatively prompt in service delivery.
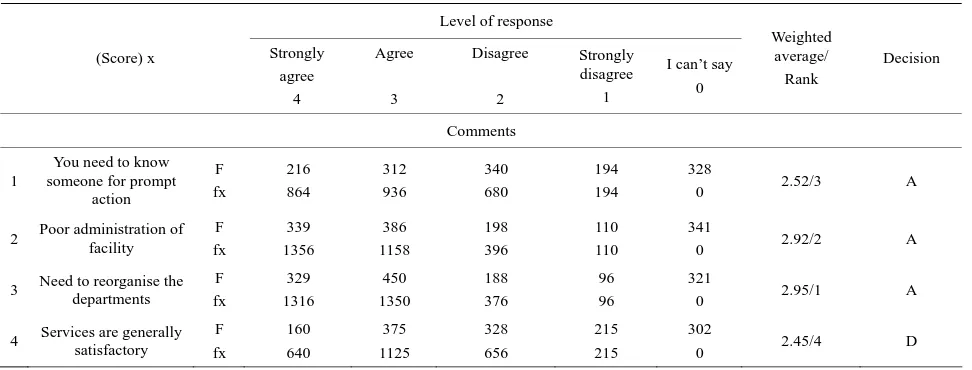
Respondents’ perceptions of salient aspects of relevant services in different units of the university health centre are shown in Table 5. In the clinical services unit, ap-propriateness of diagnosis, patient waiting time, need for continuing professional development of the doctors and requirement for more experienced hands were ranked high, while in the pharmacy unit the 24-hour daily ser-vice was a welcome development but medicine supply appeared inadequate to meet patient needs. In the nursing unit, promptness of service delivery was recognised while services at the medical laboratory unit were in-adequate. The survey showed that services at the medical records unit were not adequate and focus group interview agreed with this assertion. The file retrieval system was poor with excessive patient waiting time. Table 6 indi-cates the need to ease administrative bottleneck in each unit and for a re-organisation of the healthcare facility. Overall, submission of focus group interview was that patients were not satisfied with services rendered in the healthcare facility but these could be improved upon. This was also the submission of respondents from the questionnaire survey.
9. DISCUSSION
Table 2. Frequency of patronage of different types of healthcare services in the university.
Frequency of patronage Types of health care
services (score) x
Every time
4
Very often 3
Often
2
Rarely
1
Never
0
Weighted average
Doctor’s f Clinic fx
184 736
384 1152
510 1020
346 346
44 0
2.29
Pharmacy f Shop fx
265 1060
525 1575
404 808
170 170
70 0
2.65
Patent f Medicine fx vendor
69 276
110 330
214 428
545 545
408 0
1.68
Traditional f Healer fx
56 224
92 276
211 422
613 613
390 0
1.58
Spiritual care (religious) f fx
92 368
179 537
292 584
545 545
244
0 1.84
Medical/Pharmacy f Students fx
76 304
131 393
357 714
478 478
264
0 1.81
Others f fx
34 136
21 63
98 196
249 249
384 0
1.60
Key: f = frequency of response; x = score of response.
Table 3. Perceived barriers to healthcare seeking at the University Health Centre.
Perceived barriers (score) x
Every time
4
Very often 3
Often
2
Rarely
1
Never
0
Weighted average
Cost of care f fx
274 1096
406 1218
303 606
269 269
162
0 2.55
Waiting time f fx
278 1112
386 1158
364 728
258 258
108
0 2.53
Lack sufficient Information f fx
174 696
320 960
403 806
269 269
186
0 2.34
Accessibility (distance) f fx
138 552
210 630
399 798
393 393
214
0 2.08
Attitude f (of workers) fx
290 1160
288 864
341 682
317 317
126
0 2.45
Medicines out of stock f fx
164 656
322 966
391 782
317 317
156
0 2.28
Key: f = frequency of response; x = score of response.
helped by integrating religious practices or rituals in their care plan. [4] A few (3.55%) of the respondents con-sulted traditional healers or sought herbal remedies for
their ailments, while a few students (2.7%) had never visited the health centre but would prefer to use over the
[image:5.595.63.538.440.677.2]Table 4. Delay experiences at service delivery points in the University Health Centre.
Delay experiences
Service delivery points (score) x
Every time
4
Very often 3
Often
2
Rarely
1
Never
0
Weighted average
Medical records f fx
397 1588
214 642
238 476
178 178
215
0 2.81
Doctor’s clinic f fx
391 1564
312 936
250 500
171 171
156
0 2.82
Pharmacy f fx
172 688
204 612
232 464
346 346
262
0 2.21
Diagnostic Lab. f fx
148 592
202 606
220 440
296 296
284
0 2.23
Nursing unit f fx
96 384
168 504
184 368
379 379
353
0 2.0
Key: f = frequency of response; x = score of response.
was probably borne out of delay experiences at the health centre and moreover, the alternative health care facilities appeared to be more accessible in terms of prompt ser-vice, friendly atmosphere and provision of required health information. Apparently, the students preferred the alternative sources of care with initial treatment options in a bid to minimise cost of care and to avoid delay ex-periences in the health facility.
Perceived barriers to adequate patronage of the health facility as highlighted by respondents were cost of care (25.2%), excessive waiting time (24%), lack of sufficient information on medicine use (19.9%), poor attitude of health personnel (17.9%) and shortage of prescribed medicines (20%). These results agree with the findings of a previous study on possible barriers limiting patient access to healthcare services [8].
Patients experienced considerable delays at service de-livery points of the health care facility, with long waits in doctors’ consulting room and at the medical records unit. The promptness of nursing services was appreciated by a few respondents (34.4%) and the file retrieval system at the medical records unit was considered inadequate (42.6%), with the suggestions for a re-organisation or possible computerisation of processes in the unit. Ap-parently, patients were attended to in various units of the health facility with excessive waiting time and this re-sulted in dissatisfaction with the services. Previous stud-ies have demonstrated that a patient’s experience of waiting in a health system can radically influence his/her perceptions of service quality [11,12]. In fact, protracted waiting time has been given as a reason for not seeking care in some conventional health facilities [11].
Patient evaluation of the clinical services suggested a need for more experienced doctors (59%) along with updates on continuing education for these healthcare professionals (51%). On the other hand, respondents re- cognised the 24-hour daily services at the pharmacy unit (46.5%) while the quality of medicine dispensed was appreciated (43.7%). These observations are relevant in view of the literacy level of patrons of health services in the university community. The patients are probably bet-ter informed about their therapy and should be able to judge the technical quality of the care they receive. The findings in a previous study illustrated the importance of the level of patient education on perception of healthcare services and showed that patients with higher education could assess the competence of physicians and other health personnel more critically [13].
10. CONCLUSION
Table 5. Respondents’ perception of service delivery points at the University Health Centre.
Level of response Service units (score) x Strongly agree 4 Agree 3 Disagree 2 Strongly disagree 1
I can’t say 0 Weighted average/ Rank Decision Clinical Services
1. Appropriate diagnosis of illness f fx 226 904 693 2074 138 276 54 54 376
0 2.98/4 A
2. Personal choice of doctor to consult f fx 92 368 244 732 532 1064 155 155 451
0 2.27/11 D
3. Consulting time with doctor is adequate f fx 140 560 408 1224 348 696 156 156 402
0 2.51/10 A
4. Doctors need continuing education f fx 391 1564 428 1284 192 384 64 64 387
0 3.07/2 A
5. Need more experienced doctors f fx 503 2012 446 1338 106 212 78 78 317
0 3.21/1 A
6. You can almost predict what the doctor will prescription f fx 312 1248 556 1668 222 444 90 90 262
0 2.92/5 A
7. Doctors’ clinical judgment can be trusted f fx 168 672 591 1773 217 434 106 106 368
0 2.76/7 A
8. Doctors are approachable f
fx 172 688 601 1803 220 440 127 127 320
0 2.73/8 A
9. Excessive waiting time to see the doctor f fx 389 1556 520 1560 179 358 108 108 256
0 2.99/ 3 A
10. Doctors consulting hours of service Acceptable f fx 196 784 505 1515 248 496 158 158 329
0 2.67/9 A
11. Difficult to see doctor at off peak period f fx 264 1056 410 1230 213 426 144 144 379
0 2.77/6 A
Pharmacy Services
1. My medicine needs are met f
fx 152 608 402 1206 305 610 221 221 326
0 2.45/6 D
2. Quality medicine dispensed f
fx 212 848 491 1473 201 402 172 172 332
0 2.69/3 A
3. 24-hour service is welcome f
fx 290 1160 458 1374 150 300 182 182 324
0 2.79/1 A
4. Pharmacy staff are courteous f fx 176 704 510 1530 182 364 144 144 380
0 2.71/2 A
5. Waiting area at the pharmacy is convenient f fx 162 648 466 1398 239 478 132 132 393
0 2.66/4 A
6. Pharmacy staff demonstrate competence f fx 130 520 494 1482 230 460 168 168 360
0 2.57/5 A
Nursing Services
1. Promptness of service f
fx 128 512 425 1275 239 478 206 206 402
0 2.48/3 D
2. Delay in administering injections f fx 158 632 317 951 249 498 178 178 482
0 2.50/2 A
3. Courteous f
fx 134 536 441 1323 232 464 191 191 386
0 2.52/1 A
Medical Laboratory Services
Service is adequate f
fx 176 704 326 978 274 548 210 210 400
0 2.47/1 D
Medical Records Department
Excessive waiting time f fx 298 1192 393 1179 228 456 114 114 357
0 2.85/1 A
Retrieval (filing) system is not adequate f fx 282 1128 403 1209 196 392 116 116 387
0 2.85/1 A
Table 6. Respondents’ general perception of service delivery points at the University Health Centre.
Level of response
(Score) x Strongly
agree 4
Agree
3
Disagree
2
Strongly disagree
1
I can’t say 0
Weighted average/
Rank
Decision
Comments
1
You need to know someone for prompt
action
F fx
216 864
312 936
340 680
194 194
328
0 2.52/3 A
2 Poor administration of facility F fx
339 1356
386 1158
198 396
110 110
341
0 2.92/2 A
3 Need to reorganise the departments
F fx
329 1316
450 1350
188 376
96 96
321
0 2.95/1 A
4 Services are generally satisfactory
F fx
160 640
375 1125
328 656
215 215
302
0 2.45/4 D
Key: f = frequency of responses; x = score of responses; Respondents’ decision: A = agreement; D = disagreement.
prompt and efficient services. This will enhance patron-age, reduce morbidity and time loss from studies in ill- ness, and enhance students’ performance academically and physically. On the long run, prompt consultation at the onset of ill health will save costs in terms of reduced morbidity and mortality. In addition, computerisation of students’ healthcare information will ease access to the records for further consultation and necessary follow-up. If these recommendations for restructuring and attitudi-nal change are effected, it is hoped that student patronage of the health centre facilities would improve.
REFERENCES
[1] MacKian, S. (2003) A review of health-seeking behaviour: Problems and prospects. Health Systems Development Programme, University of Manchester, Manchester. [2] Ward, H., Mertens, T.E. and Thomas, C. (1997) Health-
seeking behaviour and the control of sexually transmitted diseases. Health Policy and Planning, 12, 19-28.
doi:10.1093/heapol/12.1.19
[3] Puchalski, C. and Sandoval, C. (2003) Spiritual care. In: O’Neill, J.F, Selwyn, P.A. and Schietinger, H.A., Eds., Clincal Guide to Supportive and Palliative Care for HIV/ AIDS Health Resources and Services Administration, US Department of Health and Human Services, 289-299. [4] Puchalski, C.M. and Romer, A.L. (2000) Taking a spiri-
tual history allows clinicians to understand patients more fully. Journal of Palliative Medicine, 3, 129-137.
doi:10.1089/jpm.2000.3.129
[5] Haddad, S. and Fournier, P. (1995) Quality, cost and utili- sation of health services in developing countries: A lon- gitudinal study in Zaire. Social Science & Medicine, 40,
743-753. doi:10.1016/0277-9536(94)00134-F
[6] Tones, K. (2004) Health promotion, health education and the public health. 4th Edition, Oxford Textbook of Public Health, Oxford University Press, Oxford, 82.
[7] Nyamonogo, I.K. (2002) Health care switching behaviour of malaria patients in a Kenyan rural community. Social Science & Medicine, 54, 377-386.
doi:10.1016/S0277-9536(01)00036-3
[8] Lasker, J.N. (1981) Choosing among therapies—Illness behaviour in the ivory coast. Social Science & Medicine,
15A, 157-168.
[9] Jain, M., Nandan, D. and Misra, S.K. (2006) Qualitative assessment of health-seeking behaviour and perceptions regarding quality of health care services among rural com- munity of district Agra. Indian Journal of Community Me- dicine, 31, 140-144.
[10] Uzochukwu, B.S. and Onwujekwe, O.E. (2004) Socio- economic differences and health-seeking behavior for the diagnosis and treatment of malaria: A case study of four local government areas operating the Bamako initiative programme in south eastern Nigeria. International Jour- nal for Equity in Health, 3, 6-20.
doi:10.1186/1475-9276-3-6
[11] Afolabi, M.O. and Erhun, W.O. (2003) Patients response to waiting time in an out-patient pharmacy in Nigeria.
Tropical Journal of Pharmaceutical Research, 2, 207-214. [12] Dansky, K. and Miles, J. (1997) Patient satisfaction with
ambulatory health care services: Waiting time and filling time. Hospital & Health Services Administration, 42, 165- 177.
[13] Miseviciene, I. and Milasauskiene, Z. (2002) Patient sat- isfaction with the work of the hospital medical personnel.