Munich Personal RePEc Archive
Improved Targeting of Social Programs:
An Application to a State Job Coaching
Program for Adults with Intellectual
Disabilities
McInnes, Melayne and Ozturk, Orgul and McDermott,
Suzanne and Mann, Joshua
Department of Economics, University of South Carolina,
Department of Family and Preventive Medicine
2013
Improved Targeting of Social Programs: An
Application to a State Job Coaching Program for
Adults with Intellectual Disabilities
Melayne Morgan McInnes
Orgul Demet Ozturk
ySuzanne McDermott
zJoshua Mann
x{November 11, 2013
Abstract
In a climate of ‡at or shrinking budgets, can programs reallocate existing resources to improve e¢ciency? We illustrate the potential for gains from redirecting resources us-ing data from a state job coachus-ing program that is designed to increase employment among adults with intellectual disabilities (ID). We model selection into the program and employment outcomes for participants and non-participants allowing for potentially heterogeneous response among observationally equivalent individuals. In our simulations, we …nd that state ID population employment can be increased from 10.7 percent to an upper bound of 16.7 percent by a program administrator who can allocate the job coaches to those with the most to gain. This is a 56 percent increase in the overall employment rate. While we assume that program administrators know more about individual program participants than we do, we can consider an administrator who has only the information available to the econometrician. In this case, targeting gains based only on observable characteristics would lead to 11.8 percent employment, which is an 11 percent increase in the overall employment rate. Surprisingly, a simple rule that only requires administrators to predict employment success when treated (based on observables) will achieve almost the same results.
JEL Classi…cation: C50; H43; J24
Department of Economics, University of South Carolina
yDepartment of Economics, University of South Carolina.
zDepartment of Family and Preventive Medicine, University of South Carolina xDepartment of Family and Preventive Medicine, University of South Carolina.
{The information provided in this manuscript was supported in part by Grant/Cooperative
1
Introduction
Social programs are increasingly asked to …nd more e¢cient ways to allocate resources,
but, practically speaking, how can this be done? Re-allocating resources to improve
e¢ciency requires knowledge of who would bene…t most. Economic program evaluations
typically focus on estimating the e¤ects of the marginal program dollar, but recent
work on estimating the distributional treatment e¤ects allows us to identify who wins
and who loses from program participation. In this paper, we go one step further and
use this modeling approach to estimate the gains from several counterfactual resource
allocations. This kind of analysis can help policy makers identify whether there are
feasible ways to make existing program resources go further. In a climate of tightening
government budgets, we think this can be a very useful policy tool.
We illustrate the potential for gains from redirecting resources using data from a
state job coaching program that is designed to increase employment among adults with
intellectual disabilities. Intellectual disabilities are disabilities that originate prior to
age 18 which are characterized by signi…cant limitations in both intellectual functioning
and adaptive behavior (including everyday social skills and practical skills). Supported
employment programs, including job coaching, have been encouraged under federal
policy since the Developmental Disabilities Assistance and Bill of Rights Act of 1984
and are present in every state. The goal of job coaching is to help individuals with severe
disabilities …nd stable employment in integrated community settings rather than work
environments that employ only people with intellectual disability. Job coaches provide
a range of services (from individual skills assessments to on-site job training) to help
overcome barriers to community employment. Job coaching programs have been shown
to signi…cantly increase employment (Cimera, 2007) even after controlling for potential
endogeneity of program participation (McInnes et al. 2010), but we do not know how
To identify the distribution of treatment e¤ects, we model the uptake of job coaching
and employment outcomes. Our model allows for observationally equivalent individuals
to have heterogeneous responses to job coaching. Since di¤erences in expected gains
from job coaching may also a¤ect the likelihood of participation, we begin with the
ap-proach suggested by Aakvik, et al. (2005). They develop a model to analyze the e¤ects
of a vocational rehabilitation program that allows unobserved gains to a¤ect the
like-lihood of program participation. This model allows us to estimate the counterfactual
outcomes for everyone, as well as the distribution of the potential and realized gains.
Using these estimates, we assess the employment e¤ects of possible reallocation of job
coaches. The optimal allocation provides job coaches to those who gain the most. Since
gains may not be observable to program evaluators, we consider a second best scheme
in which the program is assessed based on the employment success of participants. If
administrators target employability rather than gains, there can be an unfortunate
out-come in which the program appears to be successful because participants are employed
but population employment is lower. Our simulations allow us to quantify the costs
of using a second best scheme relative to the optimal one. In addition, we consider a
well-intentioned policy objective of targeting those who are least employable.
We use a unique data set collected in South Carolina from 1999 to 2005 for all
in-dividuals receiving any service from the Department of Disabilities and Special Needs
(DDSN). The data includes information on individual characteristics (including IQ, age,
gender, race, and an indicator for emotional or behavioral problems), participation in
job coaching, and employment outcomes. Because the goal of job coaching is stable
employment, our employment measure excludes jobs for short duration (less than 26
weeks) or very low pay (less than $50 per week). The estimates from our model show
that while the treatment e¤ects from the job coaching program are positive and
signif-icant, they are not maximized. We …nd that the Average Treatment E¤ect (ATE) is
is less likely to reach those with the most to gain from participation. For example, we
…nd that individuals with emotional and behavioral problems are less likely to be
em-ployed and coached, but they gain more from coaching (everything else held constant).
In our simulations, we estimate that employment can be increased by as much as 56
percent by a program administrator who can perfectly target gains. A more achievable
goal of targeting based on observable characteristics is estimated to increase
popula-tion employment by roughly 11 percent. To put these potential employment gains in
perspective, a 50 percent expansion of the program as currently deployed (that is,
as-suming no change in the way program participants are selected) would achieve a 12
percent increase in population employment.
We begin by describing supported employment and job coaching in Section 2 and
then discuss our data and variables in the following section. Section 4 describes the
latent variable models of program participation and employment and our estimation
strategy. Section 5 reports the estimation results, which are used to conduct the policy
simulations described in Section 6. Our conclusions are discussed in the …nal section.
2
Supported Employment and Job Coaching
Supported employment is a broad term used to describe a set of services that assist
individuals with severe disabilities to work in integrated work environments. The
pri-mary service of supported employment is job coaching, but it provides other services as
well, including transportation and assistive technology and adaptive equipment. People
with intellectual disabilities (ID, previously referred to as mental retardation or MR),
other developmental disabilities (cerebral palsy, spina bi…da, etc.), severe psychiatric
disabilities, cognitive disabilities (brain injuries, stroke, etc.) and some other
disabili-ties obtain supported employment services from a variety of service agencies, such as
The Developmental Disabilities Assistance and Bill of Rights Act of 1984 (re-authorized
in 2000, it is referred to as DDA from this point on) encouraged the creation of
state-level supported employment programs designed to help individuals with developmental
disabilities …nd and retain paid employment in integrated settings in a community.
Intellectual disability is the largest category of developmental disabilities, and it is
es-timated that about 1.2 percent to 1.5 percent of adults in the United States meet the
criteria for having intellectual disabilities as de…ned in the DDA of 2000 (Yamaki and
Fujiura, 2002). By 2006, every state had supported employment programs, with total
spending (federal and state) of $709 million, accounting for 21 percent of all individuals
participating in education, leisure, and work-related programs o¤ered during the day
(Braddock, Hemp, and Rizzolo, 2008). A recent national study …nds that on average
across states, $1 spent on supported employment returns $1.21, with the savings coming
primarily in reduced expenditures on alternative day services (Cimera, 2010). For the
SC program we study, McInnes et al. (2010) …nd that the job coaching services for
the average placement cost roughly $7100 but save $10,000 in avoided shelter workshop
payments. Employment in an integrated setting in the community is also associated
with higher wages and opportunities to expand social networks; however, the
major-ity of individuals with intellectual disabilities remain unemployed, underemployed, or
employed in segregated workshops (Jones and Bell, 2003; Yamaki and Fujiura, 2002;
Rusch and Braddock, 2004).
There are many barriers that prevent individuals with severe cognitive impairment
from …nding stable employment in integrated environments. First, because intellectual
disabilities vary in type and severity, it is not easy to determine if work in a community
setting is suitable. Second, when employment is suitable, individualized skill assessment
is required to identify appropriate jobs. Third, longer on-the-job training periods may be
required for individuals to acquire the necessary skills to perform a given job. Employers
these individuals can be reliable and productive employees. Finally, in addition to
learning speci…c job skills, stable employment requires appropriate workplace behavior,
some social skills (e.g. table manners), and an ability to adapt as the workplace or
job changes. Job coaching can address all of these concerns from identifying jobs to
providing on-site training to teach required job-speci…c, workplace or social skills.
The job coaching program for adults with ID in South Carolina has four components:
1) assessing skills and developing a plan for achieving competitive employment; 2)
identifying a job suitable for the individual; 3) placement and job-site training in a
competitive community job; 4) follow-up. Once a job has been identi…ed by a job
coach, she works with the individual in the natural environment of the job for as long
as it is necessary for the individual to learn the job duties. The job coach will be
present at the job site initially a few hours a day, fading from the site to maximize
independence. On-site coaching typically lasts 6 months, and the client reaches job
stabilization when he is able to complete his job duties within the natural environment
without support from the job coach. The job coach must maintain contact for at least
six months once the customer has reached stabilization. When the customer is stabilized
in his employment, the services of the job coach are terminated. While independence
and job stability are the goal, retraining and “follow along” may last for a year or more.
In South Carolina, 38 local Disability and Special Needs (DSN) boards provide
supported employment services to adults. While the DSN boards try to make job
coaches available for everyone who would like one, only a fraction of working age adults
served by the board receive job coaching in any year. Some families and individuals opt
for non-vocational day services (including recreation and leisure activities) or placement
in a sheltered workshop rather than job coaching in the community. The demand for
job coaching services at each DSN Board is a function of the number of adults served
by the Board, the reputation for success or failure that has developed, and the sta¤
any given time while other Boards have a di¢cult time recruiting participants.
We do not observe whether employment a¤ects disability bene…ts. Most adults with
mental retardation are eligible and do receive Supplemental Security Income (SSI). The
SSI program provides cash assistance to aged, blind or disabled individuals who have
limited income and resources. Earnings from employment result in lower SSI bene…ts if
the individual’s adjusted earnings are su¢ciently large. Most working individuals with
ID do not reach the substantial gainful activity (SGA) standard, which translates to
full-time work (37.5 hours per week) at $6.53 per hour1. Thus, individuals with ID
who work competitively, with or without a job coach, are usually eligible to maintain
their Medicaid bene…ts which include health insurance and disability related services.
Our empirical strategy must also allow for the possibility that there are unobservable
individual characteristics that a¤ect both coaching and employment. We discuss this
in more detail when we construct our model in Section 4.
3
Data and Variables
We obtain administrative data from South Carolina for all individuals with ID who
received any service from the Department of Disabilities and Special Needs (DDSN) at
any time between 1999 and 2005. Individuals are active in the DDSN data system if they
receive any service from the agency during a calendar year. The most common service
is “service coordination” which consists of an annual meeting with the individual, his
family or sta¤ and other interested parties. This meeting is intended to review goals
and coordinate services. When an individual obtains a competitive job, they often stay
in the DDSN system for family support services, recreation, or residential services. The
full list of services for adults are given in the Appendix.
1For 2004 and 2005, we have additional data that allows us to get a rough assessment of the impact
To be included, an individual must be between 21 and 65 years of age (inclusive)
during the year and have an IQ score above 26 and below 75. Individuals whose primary
diagnosis is autism are excluded, as are those who live in intermediate care facilities
(group homes with the highest level of supervision for people with ID) or other
institu-tional settings. Because there are very few individuals whose race is identi…ed as other
than African American or white, these individuals are also excluded. We also have
em-ployment data collected every year, through a collaboration of the University of South
Carolina School of Medicine and DDSN, that reports on every individual with ID who
obtained, sustained, or lost a job in the last twelve months. The employment data
indicates the job title, place of employment, wages earned, and whether a job coach
was provided. The …nal data set includes only individuals with ID who have a linker
number for the DDSN administrative data …le so information about the individual can
be merged with the employment data. The data from the two sources are de-identi…ed
for analysis.
Job coaching typically consists of 6 months of on-site training and at least 6 months
of follow-up. Our goal is to see whether coaching enables the individual to continue
working after the coach has left the job site (but may still be o¤ering continued support
via monthly phone calls or visits). Hence we measure the e¤ect of job coaching in year
t 1 on the probability of employment in the subsequent year t among the sample of
individuals who are unemployed in t 2. Because this requires 3 years of observation,
we can model employment outcomes for 5 years (2001 to 2005) for all individuals who
received any services from DDSN in any year. If the individual has no data from the
previous year, then their job coaching variable is set to zero. Of those with incomplete
histories, about half of these are individuals who just turned 21 (corresponding to about
3 percent of the observations from each year) and would most likely have been in high
school through their 21st birthday. High schools provide some vocational services, but
We construct a pooled cross section in which individuals are only included once.
We begin with a true cross section which was all individuals for whom we observe
employment outcomes in 2001 and job coaching status in 2000 that were unemployed
in 1999. We then add in individuals who were not in this group (because they were
employed in 1999 or had incomplete histories) but for whom we had 3 consecutive years
of data with unemployment observed in the …rst year. Excluding duplicates prevents
over-representing the substantial fraction of the sample who are never employed in our
observation period. Hence, the employment status of the long-term unemployed group
will be only measured in the …rst eligible year (2001). The majority of our data comes
from the 2001 cross section, but adding in the unique observations from later years
allowed us to increase the sample size from 6625 to 9898.
Since job coaching is intended to facilitate stable employment in integrated settings
(rather than sheltered workshops), we screen for employment in jobs with very low pay
or very short duration. For the purposes of this study, employment is de…ned as earning
at least $50 per week for 23 weeks or more (see, for example, Howarth, Mann, Zhou,
McDermott, & Butkus, 2006; Pierce, McDermott, & Butkus, 2003; Moran, McDermott,
& Butkus, 2002). We consider anyone who works for shorter durations and makes less
per week as unemployed.2 Because our data do not di¤erentiate between going
on-site coaching, follow-up contact, and any re-training that occurs if there are job changes,
we utilize a bivariate measure of job coaching (some or none) in year t 1.
2If individuals are earning less than $50 per week or employed for fewer than 26 weeks, we do not
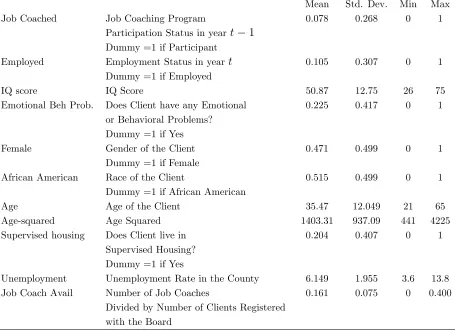
Table 1 : Variable De…nitions and Descriptive Statistics (N=9898)
Mean Std. Dev. Min Max Job Coached Job Coaching Program 0.078 0.268 0 1
Participation Status in yeart 1 Dummy =1 if Participant
Employed Employment Status in yeart 0.105 0.307 0 1 Dummy =1 if Employed
IQ score IQ Score 50.87 12.75 26 75
Emotional Beh Prob. Does Client have any Emotional 0.225 0.417 0 1 or Behavioral Problems?
Dummy =1 if Yes
Female Gender of the Client 0.471 0.499 0 1
Dummy =1 if Female
African American Race of the Client 0.515 0.499 0 1 Dummy =1 if African American
Age Age of the Client 35.47 12.049 21 65
Age-squared Age Squared 1403.31 937.09 441 4225 Supervised housing Does Client live in 0.204 0.407 0 1
Supervised Housing? Dummy =1 if Yes
Unemployment Unemployment Rate in the County 6.149 1.955 3.6 13.8 Job Coach Avail Number of Job Coaches 0.161 0.075 0 0.400
Divided by Number of Clients Registered with the Board
Variable de…nitions and descriptive statistics for the sample are shown in Table 1.
About half (51 percent) of the sample is African American, and just under half (47.1
percent) of the sample is female. The average age and IQ are, respectively, 35.5 and 50.9.
About 23 percent of the sample has some emotional or behavioral problems reported.
Finally, 20 percent live in a supervised setting (group homes or supervised apartments),
and the remaining 80 percent live with parents or independently.
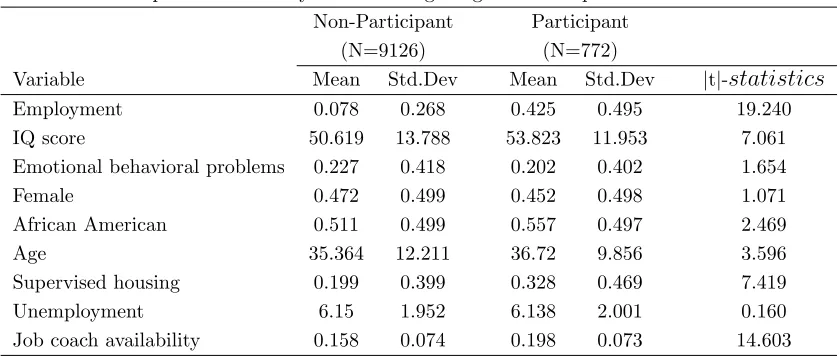
In Table 2, we stratify our sample by receipt of job coaching services. This table
highlights the statistically signi…cant di¤erences between the two groups in terms of
observables. On average, the group receiving job coaching consists of individuals who
have higher IQ’s (53.8 versus 50.6) and who are older (36.7 versus 35.4). Participants
are also more likely to be African American (56 percent versus 51 percent) and live in
di¤erences in means are reported in the last column of Table 2.
Table 2 : Descriptive Statistics by Job Coaching Program Participation Status Non-Participant Participant
(N=9126) (N=772)
Variable Mean Std.Dev Mean Std.Dev jtj-statistics
Employment 0.078 0.268 0.425 0.495 19.240 IQ score 50.619 13.788 53.823 11.953 7.061 Emotional behavioral problems 0.227 0.418 0.202 0.402 1.654
Female 0.472 0.499 0.452 0.498 1.071
African American 0.511 0.499 0.557 0.497 2.469
Age 35.364 12.211 36.72 9.856 3.596
Supervised housing 0.199 0.399 0.328 0.469 7.419 Unemployment 6.15 1.952 6.138 2.001 0.160 Job coach availability 0.158 0.074 0.198 0.073 14.603 Note: Absolute value of the t-statistics for the di¤erences of the means are reported
4
Model and Estimation
4.1
Model
Our conceptual framework begins with the observation that among individuals with ID,
those with lower IQ or emotional and behavioral problems are less likely to participate
in job coaching. We expect that those characteristics also hinder employment, but job
coaches can help to overcome these de…cits by providing on-site training, working with
employers to help them supervise e¤ectively, teaching social skills, and …nding good
matches between individual skill sets and employment settings. Thus, we may expect
that the relationship between individual characteristics and employment probability will
di¤er for those who are coached and those who are not. We incorporate this possibility
into our model by using two separate latent indices for employment outcomes, one for the
coached state and one for the non-coached state. Because factors unobserved by us may
a¤ect the success in the program, our model also allows for observationally equivalent
individuals to have heterogeneous responses to job coaching. If the unobserved factor
needed to produce unbiased estimates. However, if knowledge of idiosyncratic gains
a¤ects the likelihood of being job coached, then we have the condition termed "essential
heterogeneity" and IV estimates will be biased. To address this concern, Aakvik, et
al. (2005) develop a discrete outcome factor structure model to analyze the e¤ects of
a vocational rehabilitation program on employment outcome that provides the basis
for our econometric approach. If there is no essential heterogeneity, then their model
collapses to a standard IV model.
There are three latent indices in our model, one for job coaching (J ), the other two
for employment (E ). The …rst index is de…ned as follows:
Ji = Zi Vi (1)
Ji = 1 if Ji 0; Ji = 0 otherwise
whereJi is the observed participation status, Zi is a vector of individual characteristics
reported in the DDSN record and Vi is an unobserved individual error term. As we
discuss above, we do not directly observe the selection process. Our discussion with
o¢cials in the program suggests that both self-selection and recruitment play a role.
For simplicity in the discussion below and for later use in our policy simulations, we will
describe the process in terms of recruitment. However, our model can be interpreted
either way.
The employment latent index is allowed to di¤er by participation status for
observa-tionally equivalent individuals. For participants, the employment status is determined
by:
E1i = Xi 1 U1i (2)
whereE1i is the employment outcome for individual i given participation in job
coach-ing, Xi is a vector of observed individual characteristics, and U1i is the unobserved
shocks for participants. For non-participants, the index is:
E0i = Xi 0 U0i (3)
E0i = 1 if E0i 0; E0i = 0 otherwise,
whereE0i is the employment outcome for individual igiven that she is not job coached.
The error termU0i is the unobserved shocks for non-participants. In this model, i =
E1i E0i is the e¤ect of participation in job coaching on the employment outcome.
In order to identify the unobserved gains from treatment, we model the relationship
between the unobserved factors that determine employment and treatment as follows:
Vi = i +"i (4a)
U1i = 1 i+"1i (4b)
U0i = 0 i+"0i (4c)
where i is the common unobserved factor. If either 0 or 1 is non-zero, then we have
essential heterogeneity. We assume that , ", "1,"0 are independently and identically
normally distributed error terms.
Due to nonlinearities, the model is identi…ed even without an exclusion restriction.
However, we …nd inclusion of an instrument substantially increases the …t of the model.
When choosing our instrument, our strategy is similar to Aakvik, et al. (2005) in
seeking a measure of treatment availability that is correlated with participation in the
program (vocational rehabilitation in their case), but does not a¤ect employment
prob-ability other than through the e¤ect of program participation. Aakvik et al. have a
their instrument. While we have no way of directly measuring how long individuals
have to wait before entering the program, we do have a board-level measure of job
coaching availability. This measure is the ratio of individuals receiving job coaching to
clients registered at each disability board in each year. We show below in Table 3 that
the percent of clients participating in the job coaching program at the board level is a
statistically signi…cant predictor of individual participation in job coaching. McInnes et
al. (2010) use the same data to model employment outcomes in a panel data analysis
and …nd that this is a valid instrument. We also include two time-varying variables (an
indicator for whether the individual resides in supervised housing and the county
un-employment rate for yeart 1) and …nd both are signi…cant predictors of participation.
Given that we control for current values (year t) of these variables in the employment
equation, we do not expect the previous period values to have an independent in‡uence
on current employment status.
4.2
The Likelihood Function
The likelihood function has the following form
L=
N
Y
i=1
Z
Pr(Ji; EijXi; Zi; ) ( )d ; (5)
where
Pr(Ji; EijXi; Zi; ) = Pr(EijXi; Ji; ) Pr(JijZi; );
and is the standard normal probability distribution function. Since is not observed,
we need to integrate it out. We numerically approximate this integration over 100 draws
5
Estimation results
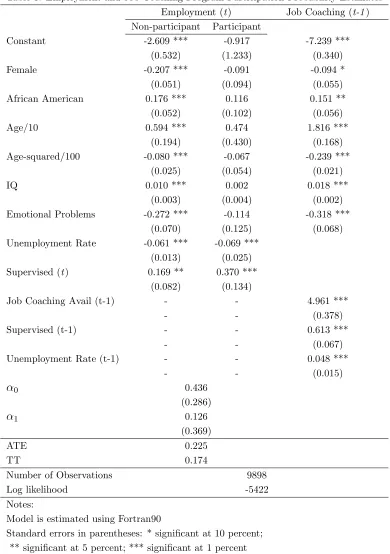
The parameter estimates of the latent index model are reported in Table 3. First we
con-sider the characteristics that a¤ect the likelihood of being job coached. Males, African
Americans, older individuals, and those individuals who live in supervised settings are
more likely to participate. Having no emotional and behavioral problems reported and
having a higher IQ also signi…cantly increase the probability of participating in job
coaching. Our instruments for participation are all strongly statistically signi…cant.
The probability of being job coached in t-1 increases with the contemporaneous (that
is, the t-1) county unemployment rate, job coaching frequency, and the individual’s
res-idence in a supervised setting. Residents in supervised settings may have more access
to services, including job coaching, increasing the likelihood of participation.
Next we look at the coe¢cient estimates for the latent indices that de…ne
employ-ment in period t. The characteristics that increase the likelihood of participation also
tend to increase the likelihood of employment in the subsequent year whether or not
the individual is job coached. However, the e¤ects are generally much smaller and not
signi…cant when job coached. Thus, having a job coach helps individuals overcome
the labor market losses associated with certain characteristics. This suggests that job
coaches are good at …nding suitable employment for all types of clients - as long as jobs
are available. We do see that living in a county with higher unemployment rates reduces
employment probability whether coached or not. We also see that living arrangements
a¤ect employment outcomes regardless of job coaching status. Supervised residential
settings may o¤er other employment supports (e.g. transportation) that aid in …nding
and keeping jobs even without a job coach.3
3Lagged housing may be directly correlated with employment success in t and also correlated with
Table 3: Employment and Job Coaching Program Participation Probability Estimates Employment (t) Job Coaching (t-1) Non-participant Participant
Constant -2.609 *** -0.917 -7.239 *** (0.532) (1.233) (0.340)
Female -0.207 *** -0.091 -0.094 *
(0.051) (0.094) (0.055) African American 0.176 *** 0.116 0.151 **
(0.052) (0.102) (0.056)
Age/10 0.594 *** 0.474 1.816 ***
(0.194) (0.430) (0.168) Age-squared/100 -0.080 *** -0.067 -0.239 ***
(0.025) (0.054) (0.021)
IQ 0.010 *** 0.002 0.018 ***
(0.003) (0.004) (0.002) Emotional Problems -0.272 *** -0.114 -0.318 ***
(0.070) (0.125) (0.068) Unemployment Rate -0.061 *** -0.069 ***
(0.013) (0.025) Supervised (t) 0.169 ** 0.370 ***
(0.082) (0.134)
Job Coaching Avail (t-1) - - 4.961 ***
- - (0.378)
Supervised (t-1) - - 0.613 ***
- - (0.067)
Unemployment Rate (t-1) - - 0.048 ***
- - (0.015)
0 0.436 (0.286) 1 0.126 (0.369) ATE 0.225 TT 0.174
Number of Observations 9898
Log likelihood -5422
Notes:
Model is estimated using Fortran90
Standard errors in parentheses: * signi…cant at 10 percent; ** signi…cant at 5 percent; *** signi…cant at 1 percent
Table 3 also gives the estimates of the factor coe¢cients 0 and 1. Both factors are
positive, indicating that the unobservables that make an individual less likely to
that the negative e¤ect on employment is greater when not job coached. That is, the
person who does not look very employable (based on factors observable to individuals
and perhaps policy makers, but not the econometrician) would, if treated, gain in terms
of employment probability. However, since neither factor is signi…cantly di¤erent than
zero, we conclude that there is no signi…cant sorting on unobserved gains in this program
as currently deployed. Later in our simulations we will consider the potential bene…ts
were the program to target individuals based on observed and unobserved gains.
The results in Table 3 also show that job coaching works. The average treatment
e¤ect (ATE) is estimated to be about 0.23. That is, the probability of employment
increases by almost 23 percentage points on average when a randomly chosen person is
job coached. If we measure the gains only among those who are actually job coached
(TT), the gain is only about 17 percentage points. This indicates that the individuals
who are enrolled in the program are not the ones with the most potential to gain. Thus,
the program is not reaching its full potential, and program resources can be reallocated
to improve total employment.
The estimated correlations between the observable components of the latent
in-dices, shown below in Table 4, also indicate the potential for gains from reallocating
job coaches. From the …rst correlation, we see that the observable factors in‡uencing
employment are strongly correlated between the job-coached and non-job-coached
in-dividuals. The second and third correlations indicate that the characteristics that are
positively associated with job coaching are also positively associated with employment
with or without a job coach. The correlation is slightly higher for the non-coached
state. From the last correlation, we see that the observable gains in the likelihood of
employment due to job coaching are negatively correlated with the probability of being
job coached. This reiterates our conclusions from above (e.g ATE > TT) that the
Table 4: Correlations Between Latent Indices
Corr(X 1; X 0) 0:7384
Corr(X 1; Z ) 0:4979
Corr(X 0; Z ) 0:5866
Corr(X( 1 0); Z ) 0:2754
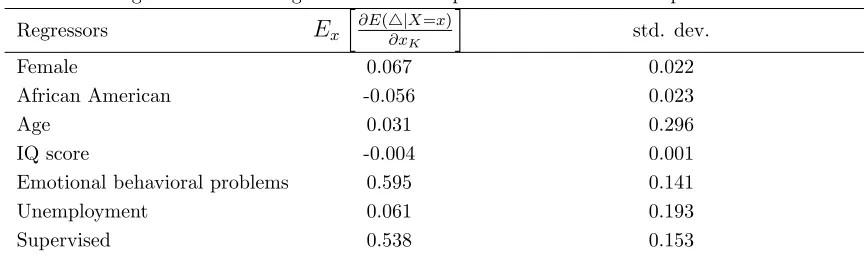
The degree to which the treatment e¤ect varies with observable characteristics can
be seen from the estimates of the marginal e¤ect of each observable characteristic on
the expected gains. Table 5 reports these estimates. We see that marginal gains are
largest for females, Caucasians, and those with lower IQ and emotional and behavior
problems. Those who live in high unemployment counties and supervised settings also
have greater gains.
Table 5: Marginal E¤ects of Regressors on the Expected Gain from Participation
Regressors Ex
h@E
(4jX=x) @xK
i
std. dev.
Female 0.067 0.022
African American -0.056 0.023
Age 0.031 0.296
IQ score -0.004 0.001
Emotional behavioral problems 0.595 0.141
Unemployment 0.061 0.193
Supervised 0.538 0.153
Notes: The marginal e¤ects are calculated as the di¤erence in gains from participation resulting from a one unit change in the covariate value. For dummy variables, the marginal gains are calculated as the di¤erence in gains as the value of the dummy is changed from zero to one. For example, to calculate the marginal e¤ect of being female, we …rst set the female dummy equal to one for everyone (leaving all other variables unchanged) and calculate the ATE for each individual. We then set it equal to zero, and recalculate the ATEs. Finally we calculate the di¤erence in ATEs and average over the population. To obtain the standard errors, we repeated this with a set of 200 coe¢cient estimates obtained by bootstrapping
6
Policy Simulations
The purpose of this paper is to see whether job coaching resources can be more
e¢-ciently deployed. Our model estimates indicate that there is room for improvement.
The advantage of the structural factor model that we employ is that it can be used
[image:20.612.94.526.318.457.2]several di¤erent allocations of job coaches to individuals to see whether a more targeted
approach would increase the e¤ectiveness of the program and, if so, by how much.
We consider four alternative schemes for allocating job coaches to individuals:
1. Random assignment of job coaches
2. Coach the ones with the highest gains
3. Coach the ones who are the most employable if coached
4. Coach the ones who are the least employable if not job coached
The random lottery assignment serves as a benchmark for measuring the e¢ciency
of the current assignment regime. The calculated ATE and TT above shows us that
a random re-assignment of all existing job coaches across DDSN clients will improve
outcomes, but by how much? Next we consider the perfect targeting scheme (coach the
ones with highest gains) and compare it to two other reallocation schemes that may
be more feasible since they require less information. Coaching the most employable
if coached is commonly referred to as cream skimming and it is thought to occur in
most programs when evaluation is based on the success of participants (Heckman, et
al., 2011). Coaching the least employable if not coached can be called bottom scraping.
While less e¢cient than targeting gains, this scheme may serve other social goals. As
benchmark for how much can be gained from re-allocating job coaches, we also
con-sider a 50 percent increase in the number of job coaches (using the estimates for the
participation model and keeping the distribution of job coaches constant across boards).
To compare the results of the alternative job coaching allocations, we simulate the
employment outcomes under each and compare the aggregate probability of
employ-ment. Reallocating job coaches may cause aggregate employment to rise or fall,
de-pending on the e¢ciency of the current allocation system relative to the alternative. To
from re-assignment to the actual participants and non-participants. An example helps
to explain why this matters. In the spirit of Roy’s (1951) model of selection, suppose
that Bob’s marginal bene…t from coaching is high but his employment probability if
coached is still low. Joe is likely to be employed with or without the program. Now
compare the possible outcomes of sorting on employability to sorting on gains. Sorting
on employability makes job coaching look very successful: Joe is coached and likely to
be employed while Bob is not coached and likely to be unemployed. Sorting on gains
will allocate the coach to Bob rather than Joe, and job coaching will not appear to be
very successful compared to no job coaching, but the overall employment level will be
higher.
Our procedures for the simulations are as follows: for each person in the sample,
we replace the unknown stochastic terms with independent random draws from the
standard normal distribution. Then we use the …tted values from the model to predict
the probability of being employed when job coached and when not job coached. Because
the outcomes of each simulation will depend on the outcome of random draws, we create
100 simulated versions of each person and constructed 100 simulated populations and
then average the results over these simulated populations.
For the random lottery assignment, we draw a lottery number for each individual
from the uniform distribution. We then rank by the lottery number and re-assign the job
coaches to those with the highest lottery numbers holding the number of job coaching
participants …xed at 772. Note that we allow for reassignment within and across boards,
allowing us to capture the employment gains produced by the allocation of coaches by
boards and to boards. If the same number of individuals are coached but the assignment
is randomized by lottery, the simulated employment rate would rise from 10.7 to 10.8
percent. This result is another illustration of the ine¢cient assignment of job coaches
under the current regime shown by ATE > TT above, but the simulations show that
treatment e¤ects for the treated and untreated should be roughly the same, and that
is what we observe (TU = 0.226 and TT = 0.222).
Next we consider the ideal targeting scheme in which the program is allocated to
those who gain the most. Because the program administrators may be able to
ob-serve what we cannot, we consider two types of decision makers based on how much
information they have relative to the econometrician: 1) The administrator who only
observes what we observe in estimating the model; 2) the omniscient administrator
who also observes the characteristics that are unobservable to us. An administrator
who targets based on only those characteristics available to us would achieve 11.9
per-cent employment, which represents a 11 perper-cent increase in employment for the overall
population with intellectual disabilities. Of course, an omniscient administrator could
do even better with knowledge of individual characteristics and unobserved (to us)
fac-tors, achieving employment of 16.7%. The di¤erence in e¤ectiveness of these regimes
is illustrated by comparing the treatment e¤ects for the treated and untreated. When
marginal gains are targeted the TT is greater than the TU (0.31 vs. 0.22) but the
di¤er-ence is much more extreme when the administrator has knowledge of factors unobserved
in the model (0.84 vs. 0.17).
We next consider allocating coaches based on an individual’s potential for
employ-ment if coached. Case workers and job coaches have had opportunity to observe the
outcomes of many individual-level coaching “experiments” and may use their experience
to guide resources to those who are most likely to attach to the labor force following
job coaching. If our administrator targets job coaches based on the probability of
employment if treated with knowledge of the unobserved factors which can cause
het-erogeneous response to treatment, then the overall employment rate would rise to 15.8
percent. Even if the administrator cannot observe these factors, targeting employability
based on observables could still improve employment to 11.8 percent. Surprisingly this
targeting marginal gains. We also see this when comparing the TT and TU. Targeting
employment if coached leads to recruitment of individuals with higher gains so that TT
rises above TU and is quite similar to that of the ideal targeting scheme, particularly
when the administrator can observe only what is observable in the model. While the
employment e¤ects are similar, slightly di¤erent groups will be served. The optimal
targeting scheme will include a higher percentage of women (46 percent vs. 43
per-cent among job coached) as well as those with emotional and behavioral problems (24
percent vs. 22 percent) and/or lower IQ (mean IQ of 50 vs. 51.16).
For completeness, we also consider targeting individuals who are the least likely to
be employed without a coach. These may be thought of as the individuals who need the
program the most. Targeting the “hard” cases would lead to 10.4 percent or 11.1 percent
employment rate depending on the information available to the program administrators.
Absent knowledge of unobserved factors, the simulations show that "bottom scraping"
will result in lower overall employment than the current scheme.
To provide a benchmark for the gains achievable from redirecting resources, we
con-sider how much might be gained by an expansion of the program. While such a change
seems unlikely given current budgetary pressures, we consider a 50 percent increase in
the number of job coaching hours available. Based on our model, an expansion of the
program as currently deployed would increase employment to 12.03% (an increase of
12.7%). This shows that the increase in employment from targeting marginal gains or
targeting employment are on par with what could be achieved by a signi…cant increase
Table 6: Policy Simulations
Overall Average Treatment E¤ects
Employment Rate Non-Participant(TU) Participant (TT)
Data 10.54%
Estimate Given Current Program 10.67% (0.32%) 0.23 (0.003) 0.174 (0.015)
Simulations
Random Assignment 10.81% (0.31%) 0.226 (0.003) 0.222 (0.013)
Target Marginal Gains 11.85% (0.31%) 0.218 (0.003) 0.309 (0.014)
Target Marginal Gains (omniscient administrator) 16.69% (0.30%) 0.174 (0.003) 0.840 (0.004) Target Employment Probability if Coached 11.78% (0.31%) 0.219 (0.003) 0.297 (0.014) Target Employment Probability if Coached (omniscient administrator) 15.77% (0.29%) 0.183 (0.003) 0.733 (0.009) Target Least Employable if Not Coached 10.39% (0.31%) 0.227 (0.003) 0.209 (0.011) Target Least Employable if Not Coached (omniscient administrator) 11.08% (0.32%) 0.216 (0.003) 0.338 (0.010) 50 percent Increase given current participation rule 12.03% (0.29%) 0.232 (0.004) 0.185 (0.010) Note: Each policy simulation is performed 100 times. Standard errors are reported in paranthesis and they are the
standard deviations for the average participation rates and treatment e¤ects across 100 simulations.
6.1
Limitations
Our interest is in obtaining counterfactual outcomes for individuals so that we can
assess winners and losers from participation and experiment with di¤erent job
coach-ing assignment rules. Thus, we use a parametric model with assumptions about the
relationships between the unobserved factors that a¤ect program participation and
em-ployment outcomes. We think our model …ts the data reasonably well, but recognize
that our conclusions are dependent on the accuracy of structural assumptions. Our
broad conclusion that job coaching increases employment is consistent with …ndings of
an earlier paper. In a panel analysis of the same data, McInnes et al. (2010) …nds
that OLS estimates ignoring unobserved heterogeneity are upwardly biased, but the
employment a¤ect remains signi…cant even after IV, FE, or propensity score matching
methods are used. Their instrument for job coaching participation, which we also use
here, passes conventional tests. Unfortunately, we cannot run the same kinds of
instru-ment validity tests in the model we use here. We also note that the DDSN o¤ers other
services and these may a¤ect job preparadness and desire to participate in the labor
market. Our policy experiment takes the provision of these services as given, and we
cannot seperately identify the e¤ects of these services. We also take the distribution
of job coaches as given and recognize that there may be additional gains to be made
by matching top quality job coaching programs to those with the most to gain. While
reallocating resources within a board may be more politically feasible than reallocating
among the boards, it may still be di¢cult to get individual coaches, boards and families
to change intake patterns to the program. Moreover, some of the proposed schemes may
be seen as politically incorrect. For example, in Table 5, we see that the females have
higher marginal gains (relative to males) while African Americans have lower (relative
to whites). Hence, our recommendation is that boards should try to enroll more females
and fewer blacks. Even without these concerns, changing habits is hard.
methodogy proposed here is more broadly applicable.
7
Conclusion
In this paper, we illustrate the potential for gains from redirecting resources using data
from a state job coaching program that is designed to increase employment among
adults with intellectual disabilities. Our analysis of the program shows that those who
are currently participating bene…t greatly from the program. However, we …nd that
participants have characteristics that are favorable in the labor market even without
coaching which implies lower marginal bene…ts from participating. We also …nd that
job coaching is e¤ective in helping overcome the labor market penalties associated with
characteristics such as low IQ and having emotional or behavioral problems. These
traits are negative and signi…cant predictors of employment without coaching, but when
coached, these e¤ects are smaller and not statistically signi…cant. Unfortunately, these
characteristics are also negative predictors of participation in job coaching. Redirecting
resources to these individuals has the potential to increase program e¢ciency.
The contribution of this paper is to develop alternative targeting schemes and to
compare the resulting gains. We calculate the maximum gains that could be achieved
by an omniscient administrator who perfectly targets those who gain the most and then
compare that to the gains that could be achieved when information about individuals
and their outcomes is limited. When an omniscient administrator enrolls only those with
the highest employment probability gains, there is a 56 percent increase in the overall
employment rate. Even a naive administrator who observes only the data available to
us can achieve an 11 percent increase in employment. Though modest, this is equivalent
to the e¤ect of increasing the number of job coaches by 50 percent without changing
the targeting scheme. Implementing the ideal targeting system may be di¢cult, since it
individual. We consider a simple rule that is not as informationally demanding and
can be more easily incentivized: targeting those who are most employable if coached.
Having observed the results of many job coaching experiments, program planners may
have a pretty good idea of who will be most employable when coached. Such a second
best scheme may have an unintended negative e¤ect on overall employment if those
who are more employable with the program would have been likely to …nd jobs even
without the program. Surprisingly, we …nd that for the job coaching program in South
Carolina, targeting employability is nearly as e¤ective as targeting gains.
Our …ndings show that an e¤ective job coaching program in SC has the potential to
be even more e¤ective at increasing employment by retargeting program resources. In
an earlier paper, McInnes et al. (2010) …nd that job coaching services for the average
placement in SC cost about $7100 but save $10,000 in avoided shelter workshop
pay-ments. The McInnes study is the only one we are aware of that controls for observed
and unobserved di¤erences between the coached and non-coached, and they …nd that
ignoring heterogeneity substantially biases estimated program e¤ects. After controlling
for heterogeneity, they still …nd that the job coaching roughly triples the odds of
em-ployment and that the e¤ects of job coaching persist for as much as four years after
the coaching took place. Our study shows that these gains from job coaching could be
increased if program resources are re-allocated. While it may be di¢cult for program
administrators to calculate marginal gains for all possible enrollees, we …nd that a
sim-ple targeting rule based on employability if coached would achieve about an 11 percent
increase in employment. These gains in employment will bene…t the state by reducing
the need to provide alternative day services that are more costly than job coaching. In
addition, there are the intangible bene…ts of increased social skills and life satisfaction
that come with stable employment in the community. While di¢cult to value, these
bene…ts are potentially quite substantial and give us even more reason to …nd the most
References
[1] Aakvik, A., Heckman, J., Vytlacil, E., (2005), “Estimating treatment e¤ects for
discrete outcomes when responses to treatment vary: an application to Norwegian
vocational rehabilitation programs”,Journal of Econometrics V.125 pp.15–51
[2] Braddock, D., Hemp, R & Rizzolo, M.C. (2008). The state of the states in
develop-mental disabilities: 2008. Washington, DC: American Association on Intellectual
and Developmental Disabilities.
[3] Cimera, R.E. (2007). “The cost-e¤ectiveness of supported employment and
shel-tered workshops in Wisconsin: FY 2002-2005”. Journal of Vocational
Rehabilita-tion, 26, 153-158.
[4] Cimera, R.E (2010) “The national cost-e¢ciency of supported employees with
in-tellectual disabilities: 2002 to 2007”,American Journal on Intellectual and
Devel-opmental Disabilities 115 (2010), 19–29.
[5] Heckman, James J., Carolyn J. Heinrich, Pascal Courty, Gerald Marschke, Je¤rey
Smith, eds. 2011. The Performance of Performance Standards. Kalamazoo, MI:
W.E. Upjohn Institute for Employment Research.
[6] Heckman, J., Vytlacil, E., (1999), “Local instrumental variables and latent variable
models for identifying and bounding treatment e¤ects” Proceedings of the National
Academy of Sciences 96, 4730–4734.
[7] Heckman, J., Vytlacil, E., (2000), “The relationship between treatment parameters
[8] Heckman, J., Vytlacil, E., (2005), “Econometric evaluations of social programs” in:
Heckman, J., Leamer, E. (Eds.), Handbook of Econometrics, Vol. 5. North-Holland,
Amsterdam.
[9] Howarth, E., J. Mann, H.Zhou, S. McDermott, S.Butkus (2006) “What Predicts
Re-employment after Job Loss for Individuals with Mental Retardation?” "Journal
of Vocational Rehabilitation, 24.3, 2006, 183-189.
[10] Jones, G.C. and Bell, K. (2003). “Health and Employment among Adults with
Disabilities” . Data Brief. Washington, DC: NRH Center for Health & Disability
Research. December.
[11] McInnes, Melayne Morgan, Orgul Demet Ozturk, Suzanne McDermott , and
Joshua R. Mann (2010). "Does supported employment work?," Journal of
Pol-icy Analysis and Management, Vol. 29(3), pages 506-525
[12] Moran, R., S. McDermott, S. Butkus, “Getting, Sustaining, and Losing a Job
for Individuals with Mental Retardation”Journal of Vocational Rehabilitation, 16
(3,4), 2002, 237-244.
[13] Pierce, K., S.McDermott, S. Butkus, “Predictors of Job Tenure for New Hires with
Mental Retardation”Research in Developmental Disabilities, 24 (5), 2003, 369-380.
[14] Roy, A.D., (1951), “Some thoughts on the distribution of earnings”, Oxford
Eco-nomic Papers, 3, 135-146.
[15] Rusch, F. R., & Braddock, D., (2004), “Adult day programs versus supported
employment (1988–2002): Spending and service practices of mental retardation
and developmental disabilities state agencies”, Research and Practice for Persons
[16] StataCorp. (2007), Stata Statistical Software: Release 10. College Station, TX:
StataCorp LP.
[17] Yamaki, K., & Fujiura, G. T. (2002), “Employment and income status of adults
with developmental disabilities living in the community”. Mental Retardation, 40,
APPENDIX
Appendix Table: DDSN Services
Service Name Service De…nition
Adult Companion Non-medical care, supervision, and socialization provided to an adult (age 21 or older). Career Preparation Services aimed at preparing participants for careers through exposure to and experience
with various careers and through teaching such concepts as compliance, attendance, task completion, problem solving, safety, self-determination,and self-advocacy. Community Services Services aimed at developing one’s awareness of, interaction with and/or
participation in his/her community through accrual of social capital.
Day Activity Services Activities and services provided in therapeutic settings to enable participants to achieve, maintain, improve or decelerate the loss of personal care, social or adaptive skills. Day Habilitation Assistance with acquisition, retention, or improvement of self-help, socialization and
adaptive skills in a non-residential DDSN licensed facility.
Employment Services Intensive, on-going supports for participants for whom competitive employment at (Group) or above minimum wage is unlikely.
Enclave - A small group of people (usually 8 or less) with developmental disabilities, who work under the supervision of an employee of the provider agency, in a community business/industry along side non-disabled employees to produce goods or services controlled by the community business/industry (ex. janitorial services at a speci…c business/industry etc.). The contractual relationship is between the business/industry and the provider agency, whereby the provider agency then pays the individual. Mobile Work Crew - A small group of people (usually 8 or less) with developmental disabilities, who work under the supervision of an employee of the provider agency,
as a self-contained business who typically move to di¤erent worksites, by selling a service (ex. landscaping, janitorial) to purchasers within the community excluding provider agencies. The contractual relationship is between the business/industry and the provider agency, whereby the provider agency then pays the individual.
continues on the next page
continued from the previous page Employment Services Intensive, on-going supports for participants for whom competitive employment at
( Individual) or above minimum wage is unlikely. Assessment, job development, placement, and training involve direct facilitation and instruction by DDSN job coach sta¤. Individual community placement provides support in; community based instruction, career awareness, skills acquisition, strategic on the job training, long term support and follow-along. Ongoing supports and identi…cation of long term natural supports are
imperative for the person with signi…cant disabilities to participate in competitive employment and to ensure job stabilization without support throughout the tenure of the placement. ICF/ID - Community An ICF/ID is a facility licensed for the primary purpose of providing health or habilitative
services to people with intellectual or related disabilities who require the aggressive, consistent implementation of a program of specialized and generic training, treatment and health services.
Individual Rehab. Medical or remedial services that have been recommended by a physician or other Licensed Practitioner of the Healing Arts with the scope of their practice under SC State Law and as further determined by the SC Department of Health and Human Services for maximum reduction of physical or mental disability and restoration of a consumer to their best possible functional level.
Prevocational Services Preparation for paid or unpaid employment, but not directed at tracking job-speci…c skills. Residential Rehab. Care, supervision, and skills training in a non-institutional setting.
Respite Care - Hourly Care provided on a short-term basis because of the absence or need for relief of those persons normally providing the care in the participant’s home.
Service Coordination provided to people who are eligible for DDSN services to assist them to access a full array of community services including medical, social, educational and other needed services that are e¤ective, cost e¢cient and necessary to avoid costly residential placement thereby making it possible for people to reside in their own homes and communities. Support Center Non-medical care, supervision and assistance provided in a non-institutional, group
setting outside of the individual’s home to people who because of their disability are unable to care for and supervise themselves.
Supported Employment Intensive/extended employment supports to individuals for whom employment at or above the minimum wage is unlikely.