ISSN Online: 2152-7199 ISSN Print: 2152-7180
The Impact of Object Complexity on Visual
Working Memory Capacity
Xiaoxi Chen
1, Bin Li
1,2*, Yaozhong Liu
1*1Management School, Jinan University, Guangzhou, China
2The Institute of Enterprise Development, Jinan University, Guangzhou, China
Abstract
The capacity of visual working memory (VWM) is regarded as one of the central themes in working memory. Related studies-on cognitive psychology and neuroscience level focused on the flexibility of capacity of working mem-ory and the influencing factors. The current study aimed at the relationship of object complexity and VWM capacity, which used change detection paradigm in order to reveal the mechanism of object representation in visual working memory. We explored the impact of complexity on capacity of VWM by dif-ferent-complexity-level Snodgrass line drawings. Participants were required to remember 2, 3 or 5 objects at the same time. In experiment 1, we set the initial stimulus exposure time at 500 ms to investigate the complexity effect. Then we varied the duration of the initial stimulus exposure time to 250 ms, 750 ms to rule out perception constraint and the test the time course of the complexi-ty effect. We found that the middle-level-complexicomplexi-ty object had the best per-formance which could be named as “middle complexity effect”. This effect was not the result restrained by the perception and disappeared when the ex-posure time was prolonged to 750 ms.
Keywords
Visual Working Memory, Complexity, Capacity, Representation
1. Introduction
Working memory (Baddeley & Hitch, 1974) is a crucial concept in cognitive psychology and cognitive neuroscience, which underpins the capacity for com-plex cognitive tasks, such as reasoning, learning, and comprehension (Baddeley, 2006). It is assumed to be a limited capacity system for the temporary storage and manipulation of information, and more and more models emphasized both processing, storage function and the difference function of processing different How to cite this paper: Chen, X. X., Li, B.,
& Liu, Y. Z. (2017). The Impact of Object Complexity on Visual Working Memory Capacity. Psychology, 8, 929-937.
https://doi.org/10.4236/psych.2017.86060
Received: March 17, 2017 Accepted: April 27, 2017 Published: April 30, 2017
Copyright © 2017 by authors and Scientific Research Publishing Inc. This work is licensed under the Creative Commons Attribution International License (CC BY 4.0).
type of information.
According to related research findings, visual working memory can be divided into spatial working memory, and object (Smith et al., 1995)/visual (Courtney et al., 1997; Ungerleider et al., 1998) working memory. Visual working memory (VWM) is responsible for the visual/object information. Visual working memo-ry capacity is of great interest because it is strongly correlated with overall cogni-tive ability, can be understood at the level of neural circuits, and is easily meas-ured. Recent studies from human psychophysical literature have revealed some nature of human VWM. Cowan (2001) analyzed a wide variety of data on capac-ity limits and suggested a single, central capaccapac-ity limit averaging about four chunks. This is named as magic number “4” and already has significant beha-vioral consequences. Using change blindness paradigm, Luck and Vogel sug-gested that VWM could store 4 integrated objects and the capacity of visual working memory must be understood in terms of integrated objects. Alvarez and Cavanagh (2004) found both the visual information load and total number of objects (set size) restrained the capacity of visual short-term memory VWM. New evidence shows that VWM capacity is modulated by the complexity of vis-ual objects encoded (Xu, 2002; Song & Jiang, 2006).
Complexity has two properties: one is by physics and the other is by psychol-ogy. Current researches usually utilize figures or other abstract pictures which share little common with the real world and have low ecological validity. Then we wonder how the real world represents in our VWM or what the specific ca-pacity is? Here we intend to measure the VWM caca-pacity for real objects in terms of standardized Snodgrass line drawings to answer this question. The materials were chosen from the picture base set by Snodgrass & Vanderwart (1980), stan-dardized by Chinese researchers Shu et al. (1989) and then followed Zhang and Yang (2003). They assessed four-indexes: name agreement, familiarity, image agreement, and visual complexity of these line drawings using a five-point scale on Chinese participants.
this study, we conducted experiments to test the influence of psychological com-plexity on VWM and explored the advantage of middle-level comcom-plexity effect in VWM processing.
2. Experiment 1
2.1. Method
Participants. 21 undergraduate students (male = 13, average age = 22.1) from the South China Normal University took part in return for monetary payment or course credit. Participants in this and all subsequence experiments are naive to the experimental paradigm and report normal or corrected-to-normal color vi-sion.
Apparatus and stimulus. Visual stimulus for this and all subsequence expe-riments are displayed on a gray background on a 15”, 1024 × 768 computer screen running an E-Prime 1.2 (Psychology Software Tools, 1996-2006). Here we used the Snodgrass line drawings (Snodgrass et al., 1980; Zhang et al., 2003) chosen from the picture set standardized by Zhang and Yang. We computed their three indexes: complexity, familiarity, visual image agreement of the three group pictures. Here we selected lowest, the middle and the highest 20 pictures to form three groups of the material, with the visual complexity score: 1.08 - 1.62, 2.85 - 3.00, 3.67 - 4.23, respectively. One Way ANOVA revealed a signifi-cant effect in complexity (P < 0.001) and no significance in familiarity and visual image agreement (P > 0.05) of the three groups. The picture each subtended a visual angle of 3˚ × 3˚. In the initial display, all drawings were scatted on a round with a radius of 4.5˚. All the pictures in the initial array and the test stimulus within the same trail were from the same level (Figure 1).
[image:3.595.210.538.574.654.2]Design. A two-factor within-subject design: complexity (low, middle, high) × set size (2, 3, 5) was used. There were 20 trails for each condition. At test, par-ticipant judge whether the probe was the same as one of the items in initial dis-play. Accuracy was the dependent measure and used Cowan’ K equation to cal-culate the capacity of VWM: K = (Hit rate + Correct Rejection rate − 1) × Set size. In each trail, the sequence of displays for all experiments (unless otherwise noted) was as follows.
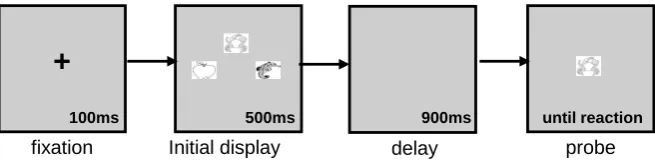
Figure 1. Examples of experimental paradigms in Experiment 1. A small, black, warning cross was presented at center screen for 100 ms. This was followed by the initial display of color squares for 500 ms, then a 900 ms blank interval, and finally by a test display that remained present until a response is made. At test phase, participant indicates whether the probe was the same as or different from one of the items in initial display by a key-press. On 50% of the trails the probe was a new color haven’t present on the screen.
+
500ms 900ms
fixation
100ms
Initial display delay probe
General Procedure. The following general procedure applied to all experi-ments. Participants repeated the phrase “abc” during the initial display and memory delay period. They stopped to make a choice when the probe appeared. At the beginning of the experiment, participants read through a detailed de-scription of the study. Then they practiced 2 trails of each condition under the supervision of the experimenter and were given feedbacks on their reactions. They started the formal experiment on condition that their accuracy in practice reaches 80 percent or higher.
2.2. Results and Discussion
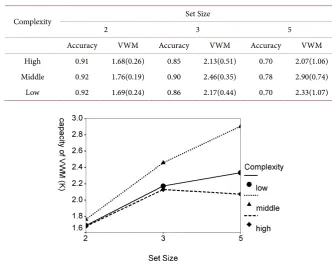
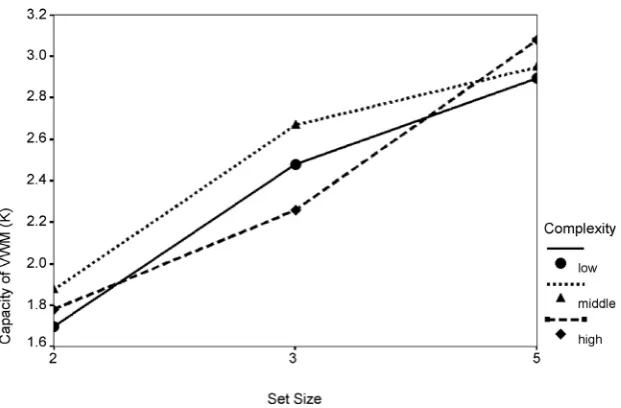
Increased memory load (set size) led to a great decline in accuracy rate and VWM capacity (Table 1 and Figure 2).
A 3 × 3 repeated ANOVA on VWM capacity revealed a significant main effect of the complexity F(2, 40) = 10.22, p < 0.001, set seize F(2, 40) = 19.62, p < 0.001, and the interaction between them F(4, 80) = 2.835, p < 0.05 (Figure 2). Pairwise comparisons shown significant differences between middle complexity and the other two levels and all comparisons between set sizes were also significant (all p < 0.05). The middle complexity object showed an advantage in VWM.
3. Experiment 2
[image:4.595.202.535.443.707.2]Considering the pictures using here were rather complex, and the duration of initial array was the same 500 ms, people argued that there might be a perception
Table 1. Accuracy rate and VWM capacity (mean and SD) for different object complexity level in experiment 1.
Complexity Set Size
2 3 5
Accuracy VWM Accuracy VWM Accuracy VWM High 0.91 1.68(0.26) 0.85 2.13(0.51) 0.70 2.07(1.06) Middle 0.92 1.76(0.19) 0.90 2.46(0.35) 0.78 2.90(0.74) Low 0.92 1.69(0.24) 0.86 2.17(0.44) 0.70 2.33(1.07)
constraint. Participants probably didn’t see all the pictures within the duration of initial display, so this was not the VWM measurement but the perception ef-fect. To test this possibility, we conducted experiment 2.
3.1. Method
Participants. 19 undergraduate students (male = 10, average age = 21.3) of South China Normal University took part in return for monetary payment or course credit. They gave informed consent according to procedures approved by the Jinan University.
Stimulus The same as experiment 1.
Design. A two factors within-subject design: complexity (low, middle, high) × set size (2, 3, 5) was used. To rule out the interference of perception factor, the duration of sample array was reduced to 250 ms.
3.2. Results and Discussion
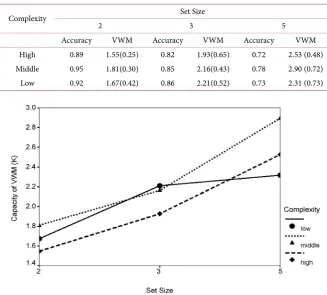
[image:5.595.207.535.425.720.2]The data analysis was the same as what has been illustrated in experiment 1. According to Luck and Vogle (1997), the perception may be an interference fac-tor in sfac-torage of VWM. To estimate this effect, we used the shortest duration of change detection paradigm 250 ms in Experiment 2. Increased memory load (set size) also led to a similar decline in accuracy rate and VWM capacity (Table 2 and Figure 3).
Table 2. Accuracy rate and VWM capacity (mean and SD) for different object complexity level in experiment 2.
Complexity Set Size
2 3 5
Accuracy VWM Accuracy VWM Accuracy VWM High 0.89 1.55(0.25) 0.82 1.93(0.65) 0.72 2.53 (0.48) Middle 0.95 1.81(0.30) 0.85 2.16(0.43) 0.78 2.90 (0.72) Low 0.92 1.67(0.42) 0.86 2.21(0.52) 0.73 2.31 (0.73)
A 3 × 3 repeated ANOVA on VWM capacity revealed a significant main effect of the complexity F(2, 36) = 6.044, p < 0.05, set seize F(2, 36) = 62.995, p < 0.001, and the interaction between them was not significant, F(4, 72) = 1.880, p = 0.123. The middle-level objects were still no less stored than objects of other complexi-ty levels.
4. Experiment 3
We believed this middle-complex effect had its own course and would get weak or disappear when the duration of initial array reached long enough. Thus we conducted this experiment to estimate this prediction.
4.1. Method
Participants. 19 undergraduate students (male = 11, average age = 21.7) took part in return for monetary payment or course credit.
Stimulus. The same as experiment 1.
Design. A two factors within-subject design: complexity (low, middle, high) × set size (2, 3, 5) was used. To explore the course of middle-complex effect, the duration of sample array was last to 750 ms.
4.2. Results and Discussion
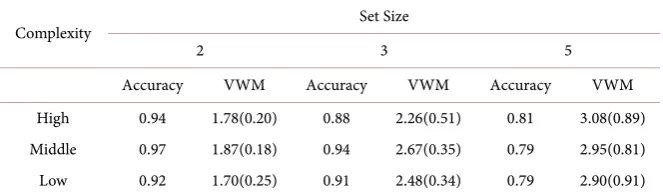
The data analysis was the same as what has been illustrated in experiment 1. In-creased memory load (set size) also led to a similar decline in accuracy rate and VWM capacity (Table 3 and Figure 4).
A 3 × 3 repeated ANOVA on IC rate revealed a significant main effect of the complexity F(2, 36) = 1.398, p > 0.05, set seize F(2, 36) = 62.324, p < 0.001, and the interaction between them F(4, 72) = 1.59, p = 0.186. Pairwise comparisons shown significant differences between all set sizes but none of complexity levels. The advantage of middle complexity disappeared.
5. General Discussion
[image:6.595.208.540.636.734.2]This article aimed at exploring the mechanism of capacity and representation in VWM by change detection paradigm. We believed complexity would influence the VWM capacity, so object representation in VWM was feature-based (Expe-riment 1 to 3). The unit of storage was feature, and each dimension had its own
Table 3. Accuracy rate and VWM capacity for different object complexity level in expe-riment 3.
Complexity Set Size
2 3 5
Figure 4. VWM capacity declined with set size in visual display in experiment 3.
storage subsystem, so different features were stored separately. Wheeler and Treisman (2002)’s dual-storage model was a support to this view.
Object representation and its capacity in VWM both refers to the unit of sto-rage. Here we assume the unit is feature of each object, but not the whole fea-tures object contains. For simple figures, feafea-tures can be easily found together; however, in line drawings of real object, features are mixed together. It is hard to count and not possible to remember all details. Alvarez and Cavanagh (2008) suggested a core set of features, and other not necessary information is not en-coded or soon lost after encoding. This partly explains why we can remember real, as well, complex objects in daily life.
We found that we manipulated the features containing in each object, then the capacity observed declined systemically. However, people do not usually count the features of object; they just judge it “simple” or “complex”. Thus, this can be called psychological view of complexity. It is relative to the physical method above. Therefore, asking people to assess pictures in a scale can tell us how com-plexity assessment influences the VWM. Concerning the middle-comcom-plexity ef-fect in visual search task and the relationship between the visual search rate and the capacity in VWM, we also found the middle-complexity effect in VWM task.
We can explain this effect in VWM by three ways. First, middle-level-complex object commonly contains less detail than the high-level one, as a result the in-terference of unrelated information is less when encoding. From a resource viewpoint, the competition between irrelevant information and the main task of competition will cause a decline in behavior well-being. Second, we assume that the core set of pictures comes into storage, which will be the effective clues of extraction phase. Middle-level-complex object has a larger core set than that of low-level one; hence, it has more clues for getting back. Third, middle-complex effect may be an outcome of revolution. This biological view needs more physi-ological evidences.
same line drawing database. Line drawings lacks of ecological validity, so further researches should use pictures of real scene and test the middle-level advantage effect.
6. Conclusion
Visual working memory capacity is influenced by the psychological complexity of objects to be processed. What’s more, middle-level complex objects have ad-vantage in processing and showed higher VWM capacity than low and high complex ones. Finally, the middle-level complexity advantage effect is mod-erated by encoding time.
Fund
This research was supported by grants from the National Natural Science Foun-dation of China (71601084), National Natural Science FounFoun-dation of Guang-dong in China (2016A030313113), Humanity and Social Science Youth founda-tion of Ministry of Educafounda-tion of China (14YJCZH068).
References
Alvarez, G. A., & Cavanagh, P. (2004). The Capacity of Visual Short-Term Memory Is Set Both by Visual Information Load and by Number of Objects. Psychological Science, 15, 106-111.https://doi.org/10.1111/j.0963-7214.2004.01502006.x
Alvarez, G. A., & Cavanagh, P. (2008). Visual Short-Term Memory Operates More Effi-ciently on Boundary Features than It Does on Surface Features. Perception & Psycho-physics, 70, 346-364.
Baddeley, A. D., & Hitch, G. J. (1974). Working Memory. In G. H. Bower (Ed.), The Psy-chology of Learning and Motivation: Advances in Research and Theory (Vol. 8, pp. 47-90). New York, NY: Academic Press.
Cao, L. R., & Li, Y. M. (2005).The Influence of Figures Complexity on Visual Search. In The tenth National Psychology Conference (p. 234).
Cao, X. H., Lin, L. B., & Liu, Z. J. (2005). The Influence of Figures Complexity and Cogni-tive Style to the Performance of Visual Search. Chinese Journal of Ergonomics, 11, 8- 10. (In Chinese)
Courtney, S. M., Ungerleider, L. G., Keil, K. et al. (1997). Transient and Sustained Activity in a Distributed Neural System for Human Working Memory. Nature, 386, 608-611. https://doi.org/10.1038/386608a0
Cowan, N. (2001). The Magical Number 4 in Short-Term Memory: A Reconsideration of Mental Storage Capacity. Behavioral and Brain Sciences, 24, 87-185.
https://doi.org/10.1017/S0140525X01003922
Luck, S. J., & Vogel, E. K. (1997). The Capacity of Visual Working Memory for Features and Conjunctions. Nature, 390, 279-281.https://doi.org/10.1038/36846
Shu, H., Cheng, Y. S., & Zhang, H. C. (1989). A Standardized Set of 235 Pictures: Norms for Name Agreement, Image Agreement, Familiarity and Visual Complexity. Acta Psychology Sinica, 21, 389-396. (In Chinese)
Smith, E. E., Jonides, J., Koeppe, R. A. et al. (1995). Spatial versus Object Working Mem-ory: PET Investigations. Journal of Cognitive Neuroscience, 7, 337-356.
Snodgrass, J. G., & Vanderwart, M. (1980). A Standardized Set of 260 Pictures: Norms for Name Agreement, Image Agreement, Familiarity, and Visual Complexity. Journal of Experimental Psychology: Human Learning and Memory, 6, 174-215.
https://doi.org/10.1037/0278-7393.6.2.174
Song, J. H., & Jiang, Y. H. (2006). Visual Working Memory for Simple and Complex Fea-tures—An fMRI Study. Neuroimage, 30, 963-972.
Wheeler, M. E., & Treisman, A. M. (2002). Binding in Short-Term Memory. Journal of Experimental Psychology: General, 131, 48-64.
https://doi.org/10.1037/0096-3445.131.1.48
Xu, Y. (2002). Limitations of Object-Based Feature Encoding in Visual Short-Term Memory. Journal of Experimental Psychology: Human Perception and Performance, 28, 458-468.https://doi.org/10.1037/0096-1523.28.2.458
Zhang, Q. F., & Yang, Y. F. (2003). The Determiners of Picture-Naming Latency. Acta Psychology Sinica, 35, 447-454. (In Chinese)
Submit or recommend next manuscript to SCIRP and we will provide best service for you:
Accepting pre-submission inquiries through Email, Facebook, LinkedIn, Twitter, etc. A wide selection of journals (inclusive of 9 subjects, more than 200 journals)
Providing 24-hour high-quality service User-friendly online submission system Fair and swift peer-review system
Efficient typesetting and proofreading procedure
Display of the result of downloads and visits, as well as the number of cited articles Maximum dissemination of your research work