Microstructure and Dielectric Properties of Bi Substituted
PLZMST Ceramics
Hayet Menasra, Zelikha Necira, Karima Bouneb, Abdelhak Maklid, Ahmed Boutarfaia*
Applied Chemistry Laboratory, Exact and Natural and Life Sciences Faculty, Materials Science Department, Mohamed Kheider Uni- versity of Biskra,Biskra, Algeria.
Email: *hayetmenasra@yahoo.com
Received February 8th, 2013; revised April 4th, 2013; accepted April 17th, 2013
Copyright © 2013 Hayet Menasra et al. This is an open access article distributed under the Creative Commons Attribution License, which permits unrestricted use, distribution, and reproduction in any medium, provided the original work is properly cited.
ABSTRACT
Bismuth (Bi) and lanthanum (La) doped lead manganese antimoine zirconate titanate (PZMST) ceramic powders have been synthesized by high temperature solid-state reaction method. Preliminary X-ray structural analysis of the com- pounds shows the formation of tetragonal structure. Scanning electron micrographs (SEM) shows a uniform grain dis- tribution and grain size of the order of ~2.28 µm. Detailed dielectric studies of the
Pb0.95(La1−z Biz)0.05[(Zr0.6Ti0.4)0.95(Mn1/3Sb2/3)0.05]O3 samples as a function of the temperature (from 25˚C to 450˚C) at frequency 1 kHz suggest that the compounds undergo a diffuse phase transition. The transition temperature shifts in- crease with increasing the Bi ratio. Diffusivity (γ) study of phase transition of these compounds provided its value from 1.59 to 1.78 indicating the degree of the disordering in the system.
Keywords: PLZT Ceramics; Grain Size; Dielectric Properties; Diffusivity (γ)
1. Introduction
Since its discovery, the lead zirconate titanate (PZT) ce- ramic system has been widely used in transducer design due to its notable electromechanical features [1-3]. One of the main characteristics of the phase diagram of this perovskite compound is the existence of a Morphotropic Phase Boundary (MPB), approximately at Zr/Ti ~ 53/47 wish divides the rombohedral Zr-rich from tetragonal Ti- rich one. Samples with Zr/Ti ratio near the MPB show the highest dielectric and piezoelectric responses [4].
On the other hand, PZT ceramics have been exten- sively modified (doped) with small amount of different additives that make them more attractive for any specific application. Such kinds of modification are classified as “soft” or “hard” by differentiating cases where the dopan- tion has, respectively, higher or lower valence than the tar- getion on the ABO3 perovskite cell [5]. Addition of do- nor dopants like La enhanced the electro optical and me- chanical proprieties of ceramics [6,7]. In this formula La+3 ions goes to the A-site and vacancies are created on the B-site to maintain change balance. The influence of soft doping (trivalent Bi [8-13]) and hard doping (accep- tors Mn and Sb [14-16]) in PLZT have been reported to have high electromechanical properties. However, the
relationship between morphological and electrical prop-erties with reference to these combinatorial ceramic com- positions with hard (acceptor Mn and Sb B-site) and soft (trivalent Bi A-site) doping in PLZT has not been ad- dressed.
The aim of the present work is to study the morpho- logical and dielectric properties of the
Pb0.95(La1−zBiz)0.05[(Zr0.6Ti0.4)0.95(Mn1/3Sb2/3)0.05]O3 cera- mics. By using X-ray, SEM and the observed dielectric behavior and the temperature value will be interpreted in terms of a Ferroelectric-Paraelectric (FE-PE) phase tran- sition.
2. Experimental Procedure
The ceramic samples were prepared by solid state reaction. High purity raw materials (Pb3O4, ZrO2, TiO2, La2O3, Bi2O3, MnO2 and Sb2O3) were stoichiometrically weighed according to the composition
Pb0.95(La1−zBiz)0.05[(Zr0.6Ti0.4)0.95(Mn1/3Sb2/3)0.05]O3 via the chemical route for z = 0.0, 0.2, 0.4 and 0.6. From now on, we shall refer to this compound as PLBZMST or 100/0, 80/20, 60/40 and 40/60 according to the La and Bi ratio. The batch powders were dispersed in acetone and mixed by a magnetic stirrer during two hours. The obtained paste is being dried at 80˚C, and then crushed in a mortar
out of a glass during 4 hours. Powders were calcined at 900˚C for 120 minutes with a heating rate of 2˚C/min. calcined powders were crushed in a similar manner to the first crushing but with 6 hours, for better agglomerate size reduction. A 5% polyvinyl alcohol (PVA) water so- lution was used as binder to increase the plasticity of the powders. The weight ratio between the PVA solution and the powders was 1:20. Powder and PVA solutions were mixed in a mortar and then uniaxially pressed into pellets with a pressure of 2000 kg/cm3 in a cylindrical stainless steel dies using a hydraulic press. The size of those pel- lets was 13 mm in diameter; while the thickness is 1 mm. Pellets were packed into covered alumina crucibles. The inner space of the crucibles was filled up with the pow- ders of PbZrO3, in order to prevent intensive evaporation of the lead during the sintering. A typical sintering sche- dule consisted of heating rate of 2˚C/min to 1100˚C, 1150˚C, 1180˚C and 1200˚C, for 120 minutes and natural cooling in the furnace.
Powder X-ray diffraction was recorded by X-ray pow- der (Philips) diffractometer using CuKα radiation (λ = 1.5406 Å) in a wide range of Bragg angles (20˚≤ 2θ≤
60˚ at a scanning rate of 2˚/min. Densities of sintered pieces were calculated from the sample dimensions and weights. Microstructural features such as a grain size and pores were characterized by means of scanning electron microscopy (SEM). Sintered pellets were electrified by silver paste, and fired at 750˚C for forty five minutes, before using for any electrical measurements. The di- electric permittivity and loss tangent of the samples were measured as a function of frequency at different tempera- ture (room temperature to 500˚C) using LCR meter (Good Will Instrument Co., LTD).
3. Results and Discussion
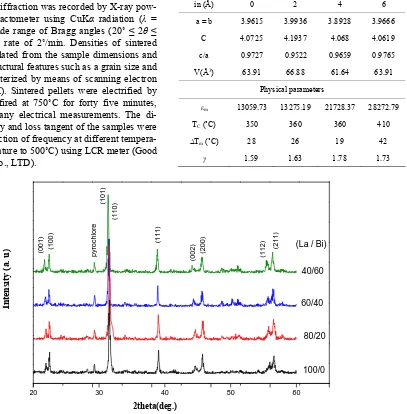
X-ray diffraction patterns of PLBZMST (100/0, 80/20, 60/40; and 40/60) ceramics sintered at 1180˚C are shown
in “Figure 1”. The PZT phase could be identified from
[image:2.595.131.538.308.722.2]X-ray peaks in a range of 2θ ~ 42˚ - 47˚ [17], wish cor res- ponded to (200)T - (002)T peaks of tetragonal (T) struc- ture. The associated changes in lattice parameter and degree of tetragonality (c/a) were calculated and listed in
Table 1.
[image:2.595.138.471.486.723.2]The calculated tetragonality of all the samples indi- cates that the addition of Bi to PLZMST does not cause mush variation in tetragonality, except that a pyrochlore peak is observed near the perovskite (110) for all the com-
Table 1. Lattice and dielectric parameters of PLBZMST samples.
Composition Bi% Lattice
parameters
in (Å) 0 2 4 6
a = b 3.9615 3.9936 3.8928 3.9666
C 4.0725 4.1937 4.068 4.0619
c/a 0.9727 0.9522 0.9659 0.9765
V(Å3) 63.91 66.88 61.64 63.91
Physical parameters
εm 13059.73 13275.19 21728.37 28272.79
TC (˚C) 350 360 360 410
∆Tm (˚C) 28 26 19 42
γ 1.59 1 63 . 1.78 1.73
20 30 40 50 60
2theta(deg.)
p
y
roch
lo
re
40/60
60/40
80/20
100/0 (La / Bi)
In
ten
sit
y
(a.
u
) (21
1)
(1
12
)
(2
00)
(0
02)
(1
11)
(1
10
)
(10
1)
(100
)
(0
01
)
positions. The relative amount of the pyrochlore phase to the perovskite phase was esteemed using the following peak area ration equation [18].
pyro.
pyro. A
pyrochlore% 100
A A(100)
(1)
where Apyro. and A (110) are the area under the pyro- chlore peak and the (110) perovskite phase. The pyro- chlore value is increased from 3% to 6% with increasing Bi doping, which is small and agreement with the value reported in doped PZT [19]. Hence, this composition can also be considered as a single phase wish confirms the homogeneous diffusivity of Bi3+ in PLZMST perovskite. The donors ions Bi3+ partially substitute Pb2+ at A-site and acceptors Mn4+ and Sb3+ partially substitutes Zr4+/ Ti4+ at B-site due to the approximately close and similar ionic radii of respective cations at A-site and B-site in PLZT lattice.
Figure 2(a) shows the apparent density of undoped
and Bi modified PLZMST ceramics at different sintering- temperatures. This curve shows the similar variation trend with increasing sintering temperature. The density of the compositions sintered at 1180˚C showed the maximum value of 7.56 mg/cm3 at ratio La/ Bi (60/40). The appar- ent densities (as a percentage of theoretical density) of the sintered pellets are shown in Figure 2(b). This fig- ure shows that the composition doped with 4% of Bi has highest density values at each temperature sintering.
SEM micrographs of the pellet prepared from PLBZ- MST powder and sintered at 1180˚C are shown in Fig-
ure 3. The sintered pellets have been found to have a
grain size of the order of ~2.28 µm and uniform grain distribution, which is in accordance with the high density value as can be seen from Figures 2(a) and (b). The av- erage grain size was determined directly from the SEM micrographs by using the classical linear interception method.
Permittivity and AC conductivity were analysed in the ferro and paraelectric phase. Figure 4(a) shows the va- riation of the dielectric constant (εr) as a function of tem- perature at frequency of 1 kHz. It is observed that εr in- creases with the increase of temperature up to the onset of phase transition. A significant improvement in values of
εr has been observed with the increase of sintering tempe- ratures. The value of dielectric constant (εmax = 21728.37) of the sample doped with Bi (60/40) at a transition tem- perature (Tc = 360˚C) is a high as 2 times that of the other samples. On the other hand, while at room tem- perature; permittivity increased with dopants concentra- tion mainly because of the lower values of porosity. This fact can be explained by using the Bruggeman model for inhomogeneous media [20].
Figure 4(b) shows the variety of dielectric loss (tanδ)
as a function of temperature at 1 kHz; for all the com-
(a)
(b)
Figure 2. (a) Variation of apparent density of PLBZMST with sintered temperature; (b) Variation of apparent den-sity of sintered PLBZMST samples with Bi addition.
(a) (b)
(c) (d)
[image:3.595.314.534.79.446.2] [image:3.595.311.537.497.710.2](a)
[image:4.595.72.274.83.438.2](b)
Figure 4. Variation of (a) Dielectric constant and (b) dielec- tric loss respectively with temperature at 1 kHz for all sam- ples sintered at 1180˚C.
positions, as temperature increase, loss tangent is almost constant up to 300˚C, but then it starts increasing with temperature. This increase in (tanδ) may be due to an increase in the electrical conduction of the residual cur- rent and absorption current [21].
It is known that the dielectric constant ε of a normal ferroelectric, above the curie temperature follows the Curie-Weiss Law [22] described by:
0
c T T
1
T T C
c
(2)
where T0 is the Curie-Weiss temperature and C is the Curie-Weiss constant. Figure 5(a) shows the plot of tem- perature versus inverse dielectric constant (at 1 kHz) fitted to the Curie-Weiss law for PLZMST ceramics.
m cw
T T T
(3) The parameter ∆Tm, to illustrate the degree of devia- tion from the Curie-Weiss law, was defined as where Tcw denotes the temperature from which the permittivity starts to deviate from the Curie-Weiss law, and Tm repre-
(a)
2.0 2.5 3.0 3.5 4.0 4.5 5
13.0 12.5 12.0 11.5 11.0 10.5 10.0 9.5 9.0 8.5
.0
La/Bi (100/0)
Ln
(1
/
m
)
Ln(T-Tc) (b)
Figure 5. (a) The inverse ε as a function of temperature at 1 kHz for PLBZMST; (b) ln(1/ε − 1/εm) vs. ln(T − Tc) of PLZMST at 1 kHz.
sents the temperature of the dielectric constant maximum. At 1 kHz, it can be seen from Table 1 that the ∆Tm de- creases slightly with increased Bi addition.
The dielectrics characteristics of relaxor ferroelectrics are known to deviate from the typical Curie-Weiss be- havior and can be described by a modified Curie-Weiss relation-ship [23].
m
m
T T
1 1 1
C
2
(4)
where γ and C are assumed to be constant. The parameter
[image:4.595.307.537.84.515.2]ure 5(b) shows the plotof ln((1/ε) – (1/εm)) versus ln(T – Tm) at 1 kHz of PLZMST sample. Linear relationships were observed. The slopes of the fitting curve were used to determine the parameter γ. The values of γ are listed in
Table 1. It can be seen the increase in value of γ with
Bi2O3 content (Table 1) indicates an increase in diffusiv- ity.
4. Conclusion
The novel PLBZMST ceramics have been prepared by conventional solid-state reaction route. All the com- pounds are crystallized in pure perovskite phase with the predominant tetragonal phase. Grain size was obtained in the order of ~2.28 µm and uniform grain distribution wish is in accordance with the density. The increase in core temperature and dielectric constant can be attributed to the emerging lead vacancies creation by donor cations (Bi), and acceptor to reduce the oxygen vacancies mobil- ity to balance charge in the modified PLZMST. The dif- fusivity (γ) study of phase transition of these compounds gives the values from 1.59 to 1.78 indicating the degree of the disordering in the system.
REFERENCES
[1] B. Jaffe, W. R. Cook Jr. and H. Jaffe, “Piezoelectric Ce- ramics,” Academic Press, New York, 1971.
[2] G. H. Haertling, “Ferroelectric Ceramics: History and Technology,” Journal of the American Ceramic Society, Vol. 82, No. 4, 1999, pp. 797-818.
doi:10.1111/j.1151-2916.1999.tb01840.x
[3] B. Jaffe, R. S. Roth and S. Marzullo, “Piezoelectric Prop- Erties of Lead Zirconate-Lead Titanate Solid-Solution Ceramics,” Journal of Applied Physics, Vol. 25, No. 6, 1954, pp. 809-810. doi:10.1063/1.1721741
[4] F. Agullo-Lopez, J. M. Carbrera and F. Agullo-Rueda, “Elec- trooptics Phenomena, Materials and Applications,” Aca-demic Press INC, San Diego, 1994, pp. 146-149.
[5] R. Rai, S. Sharma and R. N. P. Choudhary, “Effect of Al Doping on Structural and Dielectric Properties of PLZT Cramics,” Journal of Materials Science, Vol. 41, No. 13, 2006, pp. 4259-4265.
doi:10.1007/s10853-005-5455-1
[6] H. Tamura, T. Knolle, Y. Sakable and K. Wakino, “Im- proved High-Q Dielectric Resonator with Complex Per- ovskite Structure,” Journal of the American Ceramic So- ciety, Vol. 67, No. 4, 1984, pp. C59-C61.
[7] K. Wakino, K. Minal and H. Tamura, “Microwave Char- acteristics of (Zr, Sn)TiO4 and BaO-PbO-Nd2O3-TiO2 Di-
electric Resonators,” Journal of the American Ceramic Society, Vol. 67, No. 4, 1984, pp. 278-281.
doi:10.1111/j.1151-2916.1984.tb18847.x
[8] S. Dutta, R. N. P. Choudhary and P. K. Sinha, “Ferro- electric Phase Transition in Bi-Doped PLZT Ceramics,”
Materials Science and Engineering: B, Vol. 98, No. 1, 2003, pp. 74-80.doi:10.1016/S0921-5107(02)00612-8
[9] R. N. P. Choudhary, “Phase Transition in Bimodified PLZT Ferroelectrics,” Materials Letters, Vol. 54, No. 2, 2002, pp. 175-180. doi:10.1016/S0167-577X(01)00559-6 [10] P. Goel, K. L. Yadav and A. R. James, “Double Doping
Effect on the Structural and Dielectric Properties of PZT Ceramics,” Journal of Physics: Applied Physics, Vol. 37, No. 22, 2004, pp. 3174-3179.
doi:10.1088/0022-3727/37/22/019
[11] S. Dutta, R. N. P. Choudhary and P. K. Sinha, “Ferro- electric Phase Transition in Sol-Gel Derived Bi-Doped PLZT Ceramics,” Journal of Materials Science, Vol. 39, No. 9, 2004, pp. 3129-3135.
doi:10.1023/B:JMSC.0000025842.46451.64
[12] P. Goel and K. L. Yadav, “Substitution Site Effect on Structural and Dielectric Properties of La-Bi Modified PZT,” Journal of Materials Science, Vol. 42, No. 11, 2007, pp. 3928-3935. doi:10.1007/s10853-006-0416-x [13] R. Rai, S. Sharma and R. N. P. Choudhary, “Structural
and Dielectric Properties of Bi Modified PLZT Ceram-ics,” Solid State Communications, Vol. 133, No. 10, 2005, pp. 635-639. doi:10.1016/j.ssc.2005.01.005
[14] Y. K. Gao, K. Uchino and D. Viehland, “Rare Earth Metal Doping Effects on the Piezoelectric and Polariza-tion Properties of Pb(Zr,Ti)O3-Pb(Sb,Mn)O3 Ceramics,”
Journal of Applied Physics, Vol. 92, No. 4, 2002, pp. 2094- 2099. doi:10.1063/1.1490617
[15] Z. G. Zhu, Z. J. Xu, W. Z. Zhang and Q. R. Yin, “Effect of PMS Modification on Dielectric and Piezoelectric Properties in xPMS-(1 − x) PZT,” Journal of Physics:
Applied Physics, Vol. 38, No. 9, 2005, pp. 1464-1469. doi:10.1088/0022-3727/38/9/021
[16] R. Rai, S. Mishra and N. K. Singh, “Effect of Fe and Mn Doping at B-Site of PLZT Ceramics on Dielectric Proper- ties,” Journal of Alloys Compounds, Vol. 487, No. 40180, 2009, pp. 494-498. doi:10.1016/j.jallcom.2009.07.161 [17] K. Kakegawa, J. Mohri, T. Takahashi, H. Yammamura
and K. Shirasaki (Solid State Communication), “A Com- positional Fluctuation and Properties of Pb(Zr,Ti)O3,”
Solid State Communications, Vol. 24, No. 11, 1977, pp. 769-772. doi:10.1016/0038-1098(77)91186-3
[18] A. Garg and D. C. Agarwal, “Effect of Rare Earth (Er, Gd, Eu, Nd and La) and Bismuth Additives on the Mechanical and Piezoelectric Properties of Lead Zirconate Titanate Ceramics,” Materials Science and Engineering: B, Vol. 86, No. 2, 2001, pp. 134-143.
doi:10.1016/S0921-5107(01)00655-9
[19] S. R. Shanningrahi, F. E. H. Tay, K. Yao and R. N. P. Choudhary, Effect of Rare Earth (La, Nd, Sm, Eu, Gd, Dy, Er and Yb) Ion Substitutions on the Microstructural and Electrical Properties of Sol-Gel Grown PZT Ceramics,”
Journal of the European Ceramic Society, Vol. 24, No. 1, 2004, pp. 163-170. doi:10.1016/S0955-2219(03)00316-9 [20] A. Pelaiz-Barranco, “Ferroelectric Properties and Con-
duction Mechanisms in the Modified PZT Ceramic Sys- tem,” Ph.D. Thesis, University of Havana, Havana, 2001. [21] B. Tareev, “Physics of Dielectric Materials,” Mir
Pub-lisher, Moscow, 1979, p. 157.
of Ferroelectric and Related Materials,” Clarendon Press, Oxford, 1977.
[23] V. Koval, C. Alemany, J. Briančin and H. Bruncková, “Dielectric Properties and Phase Transition Behavior of xPMN-(1 − x)PZT Ceramic Systems,” Journal of
Elec-troceramics, Vol. 10, No. 1, 2003, pp. 19-29.
[24] G. A. Smolenskii, “X-Ray Scattering and the Phase Tran- sition of KMnF3 at 184 K,” Journal of the Physical