ISSN Online: 2153-1188 ISSN Print: 2153-117X
DOI: 10.4236/msa.2019.103017 Mar. 12, 2019 205 Materials Sciences and Applications
Strain Rate Effects on Tensile Properties of
HDPE-PP Composite Prepared by Extrusion
and Injection Moulding Method
Harekrushna Sutar
1*, Himanshu Sekhar Maharana
2, Chiranjit Dutta
3, Rabiranjan Murmu
1,
Sangram Patra
11Chemical Engineering Department, Indira Gandhi Institute of Technology, Sarang, India 2Materials Science and Engineering Department, Indian Institute of Technology, Kanpur, India 3Chemical Engineering Department, National Institute of Technology, Trichy, India
Abstract
The present paper investigates the effect of strain rate on different tensile properties of high density polyethylene (HDPE) and polypropylene (PP) composite. Tensile specimens of virgin HDPE-PP composites are prepared via twin screw extruder and injection moulding methods as per ASTM D638-02a (Type-I); with gage length 50 mm, width 13 mm and thickness 3 mm. Composites are fabricated with PP as reinforcing agent at a loading rate of 10%, 20%, 30%, 40% and 50% by weight. Experiments are carried out at room temperature of 23˚C and absolute humidity of 54% at a cross head speed of 30, 40, 50, 60 and 70 mm/min. Stress and strain values at yield and break points are reported. Atomic force microscopy (AFM) is used to study the distribution of polymer molecules in the mixture and surface roughness. As in last, experiments are designed by Taguchi optimization method to find out the dominating factors on tensile strength.
Keywords
HDPE-PP Blend, Strain Rate, Tensile Strength, AFM, DOE
1. Introduction
History reveals, the composites are mainly used for savings in secondary struc-tures. The fibre-reinforced polymer (FRP) materials find increasing applications as load bearing structures. But in the other hand, development of polymer mate-rials for high technology engineering applications is in demand [1][2][3]. It is always a matter of concern, to evaluate the mechanical properties of polymer How to cite this paper: Sutar, H.,
Maha-rana, H.S., Dutta, C., Murmu, R. and Patra, S. (2019) Strain Rate Effects on Tensile Properties of HDPE-PP Composite Pre-pared by Extrusion and Injection Moulding Method. Materials Sciences and Applica-tions, 10, 205-215.
https://doi.org/10.4236/msa.2019.103017
Received: February 11, 2019 Accepted: March 9, 2019 Published: March 12, 2019
Copyright © 2019 by author(s) and Scientific Research Publishing Inc. This work is licensed under the Creative Commons Attribution International License (CC BY 4.0).
DOI: 10.4236/msa.2019.103017 206 Materials Sciences and Applications composites at high rates of strain. Premature failure at high loading rates alarms to design structures with high strength. The progress in research to find the me-chanical strength of thermoplastic polymer blends are still lacks. With respect to above argument, a polymer blend of HDPE-PP has been developed to under-stand the strain rate effects on particularly to tensile properties.
A detailed review of the strain rate dependence of mechanical properties of polymer composites has been outlined by Jacob et al.[4]. The study of different properties of polymer blends is a new approach [5]. These polymeric materials must perform at the imposed conditions. Blend of HDPE-PP has been prepared [6][7] and its mechanical, thermal, crystallization and electrical properties has been studied. An experimental approach using universal testing machine (UTM) was employed to study the effect of low strain rate loading on HDPE/saw dust composites [8]. In fibre reinforced polymer composites, the increment of filler may increase its tensile strength [9]. In general, the filler is incapable to endure the stress transmission efficiently and resulting low compression strength [10] [11]. In a similar manner, Bia et al.[12] studied the tensile properties of rigid glass bead/HDPE composites at a strain rate of 3 × 10⁻⁵ - 8 × 10⁻³ s−1 and
ob-served tensile modulus and strength increases with loading rate. Over the last two decades, the global production of synthetic polymers increasing. Polymers have low weight, durability and cheap relative to other materials [13][14][15]. So in the present work an attempt has been made to find out an alternative use of HDPE-PP polyblend by accessing the tensile properties at different strain rates. Additionally the design of experiments (DOE) is carried out to discover the influencing factor on tensile strength at break point.
2. Materials and Method
2.1. Polymeric Raw Materials
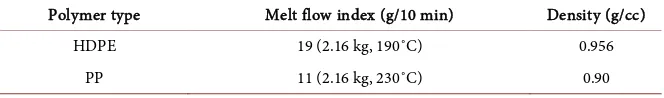
[image:2.595.207.539.675.724.2]Virgin PP of M110 Grade (homopolymer) produced by the sphericol technology and virgin HDPE of M5818 Grade (injection moulded type) produced by Mitsui Slurry CX technology are purchased from Haldia petrochemical limited, Haldia, West Bengal, India. Typical physical properties of the polymers are reported in Table 1.
2.2. Tensile Specimen Preperation
Polymers are collected in the form of pellets. The pellets are dried in a hot air oven at 60˚C for 8 hrs to remove moisture content followed by mixing of 10, 20, 30, 40 and 50 wt. % of PP to HDPE. Then they are mixed using a twin screw ex-truder (ZV20, Specific Engineering and Auto Mates, Vadodara, India) at feeder
Table 1. Physical properties of polymers.
Polymer type Melt flow index (g/10 min) Density (g/cc)
HDPE 19 (2.16 kg, 190˚C) 0.956
DOI: 10.4236/msa.2019.103017 207 Materials Sciences and Applications speed of 51 rpm and main rotor at 54 rpm to form a homogeneous polymer blend and are collected in the form of pellets. The screws are of 21 mm diameter and co-rotating type, containing three thermal barrels at 190˚C, 200˚C and 210˚C respectively. The melt and die temperatures are 224˚C and 200˚C.
The obtained pellets are moulded immediately to tensile test samples using an automatic injection moulding machine (Endura-90, Electonica plastic machines limited, Kolkata, India) with screw diameter of 35 mm at 177 rpm. The tem-perature of the nozzle is 200˚C and that of the three barrels are 190˚C, 200˚C and 210˚C respectively. Tensile specimens are prepared according to ASTM D638-02a type-I (gage length 50 mm, with 13 mm and thickness 3 mm) stan-dard.
2.3. Prediction of Tensile Properties
Tensile characteristics of HDPE/PP polyblends are determined using an univer-sal testing machine (UTM-3382, Instron, UK). Tests are conducted at cross head speed of 30, 40, 50, 60 and 70 mm/min for each composite type at atmospheric temperature of 23˚C and absolute humidity of 54%. Stress and strain at yield and break points are estimated in the experiment and reported in result and discus-sion section. Each data corresponds to the mean value for three independent observations.
2.4. Atomic Force Microscopy (AFM)
We have used AFM (Park XE 100, South Korea) to observe the topography of prepared tensile specimens. In order to see the surface behaviour of the speci-mens, i.e. the distribution of polymer molecules in the blend and root mean square (rms) roughness (Rq) in nanometre scale; an AFM at non contact mode
and room temperature is implemented. Images were scanned by using a cantile-ver of tip radius 10 nm (NCHR mode), a nominal spring constant of 0.05 N/m and a scanning rate of 0.9 Hz. The scans were made on 1000 nm × 1000 nm scale (except for 60HDPE/40PP, held at 750 nm × 750 nm) and repeated five different times on five different area of the polymer surface (tensile specimen) at a resolu-tion of 256 × 256 pixels (except for 60HDPE/40PP, held at 192 × 192 pixels) , set point of 10 nm, amplitude of 20.85 nm. The rms roughness is determined [16] by following equation,
(
)
2rms Z Zi av
N
−
= (1)
where, Zi is the height at a particular point on an image (nm), Zav is the mean
height of all pixels in the image (nm) and N is the total number of pixels in the image. The maximum range is the height difference between the lowest and highest pixels in the image.
2.5. Taguchi Optimization
DOI: 10.4236/msa.2019.103017 208 Materials Sciences and Applications controlling factor on output. All designed experiments require a certain number of combinations of factors and levels to be tested in order to observe the results of those test combination. In our project, Taguchi optimization method is em-ployed to find out the optimum operating parameters influencing the tensile properties using MINITAB-16 software. Tensile strength at break point is con-sidered as response. The operating conditions implemented are given in Table 2.
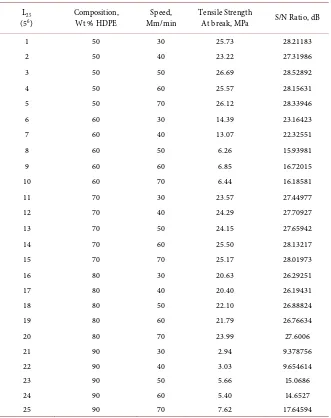
Full-Factorial design is conducted in accordance with 5 level L25 (56)
orthogo-nal array. The S/N ratios for maximum tensile strength at break (in MPa) under “larger is the better characteristic” are calculated as the logarithmic transforma-tion of the loss functransforma-tion as shown below.
Larger is the better characteristic:
2
1 1
10log S
N n Y
= −
∑
(2) where “n” is the repeated number trial conditions and “Y” is the data pertaining to tensile strength at break point.3. Results and Discussion
2D and 3D topography of the prepared tensile specimens are seen, and reported in Figure 1. The polymers are uniformly distributed inside the composite as visible in the AFM images. The white and brown spots (both dark and dull) are confirming to the PP and HDPE phases respectively. Few aggregative PP phases are observed in the 50HDPE/50PP composite. A wide distribution of PP mole-cules within the blend is noticeable in 90% HDPE blend (Figure 1(i) and Figure 1(j)). As both the polymers are not compatible to each other, the molecular dis-tribution of PP declines with its content. HDPE holds low melting point and high melt flow index, resulting a smoother surface formation during injection mould-ing. Results corresponding to the rms roughness (Rq) are revealed in Figure 2.
Attributing to the above discussion, the roughness of the prepared tensile specimen confirms to be minimum for 90HDPE/10PP polymer composite. The maximum rms roughness (Rq = 3.478 nm) is resulting for 50HDPE/50PP
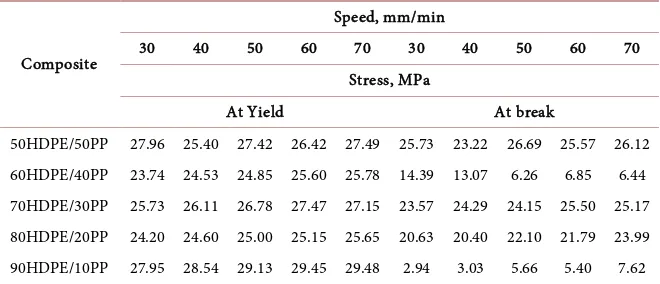
poly-blend specimen and falls with increase in HDPE load. Data pertaining to the tensile properties conducted using the UTM, are reported in Table 3 and Table 4. Table 3 shows the outcomes for the tensile stress at yield and break points in MPa. The resulted strain in % at both yield and break points are disclosed in Ta-ble 4.
The optimisation result shows that tensile strength is maximum for 50HDPE/50PP polyblend. The tensile strength decreases with increase in HDPE
Table 2. Levels of the variables used in the experiment.
Control Factors Level
1 2 3 4 5 Units
Composition (code: C) 50 60 70 80 90 Weight % (HDPE)
DOI: 10.4236/msa.2019.103017 209 Materials Sciences and Applications Table 3. Experimental values of Stress at yield and break point.
Composite
Speed, mm/min
30 40 50 60 70 30 40 50 60 70
Stress, MPa
At Yield At break
[image:5.595.208.538.265.407.2]50HDPE/50PP 27.96 25.40 27.42 26.42 27.49 25.73 23.22 26.69 25.57 26.12 60HDPE/40PP 23.74 24.53 24.85 25.60 25.78 14.39 13.07 6.26 6.85 6.44 70HDPE/30PP 25.73 26.11 26.78 27.47 27.15 23.57 24.29 24.15 25.50 25.17 80HDPE/20PP 24.20 24.60 25.00 25.15 25.65 20.63 20.40 22.10 21.79 23.99 90HDPE/10PP 27.95 28.54 29.13 29.45 29.48 2.94 3.03 5.66 5.40 7.62
Table 4. Experimental values of strain at yield and break point.
Composite
Speed, mm/min
30 40 50 60 70 30 40 50 60 70
Strain, %
At Yield At break
50HDPE/50PP 7.55 7.62 7.05 7.62 7.15 11.46 12.08 8.82 9.81 9.78 60HDPE/40PP 8.25 8.24 8.22 8.07 7.74 438.18 438.64 295.80 141.05 92.132 70HDPE/30PP 7.87 7.11 7.50 7.15 7.04 12.98 10.90 12.59 11.13 11.53 80HDPE/20PP 8.54 8.20 7.70 7.59 7.54 15.19 15.26 12.82 12.15 11.07 90HDPE/10PP 7.28 7.16 6.94 6.91 7.00 104.35 84.15 62.59 68.24 55.07
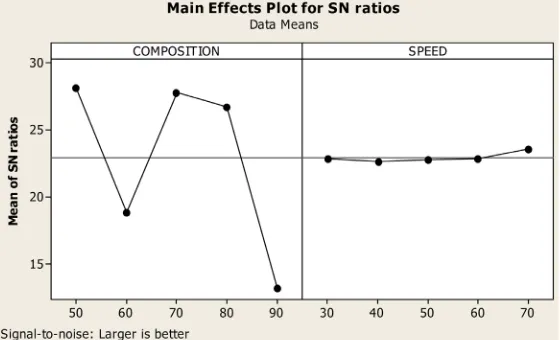
content in the composite. Tensile strength is minimum at the cross head speed of 40 mm/min and maximum at 70 mm/min. The Figure 3 reveals, the strength is almost same at cross head speed of 40, 50 and 60 mm/min. But the improve-ment of the tensile strength at the rate of 70 mm/min is quite significant. Analy-sis of result from Figure 3 concludes that a factor combination of C1 and S5 shows the maximum strength at break point. The results are in accordance to the fact that, high strain rates favour the elastic behaviour of materials. Elasticity is associated with load bearing performance as embodied in properties such as strength. But low strain rates favour the viscous behaviour. In our experiment; as cross head speed increases to 70 mm/min; the temperature of the specimen might declines to minimum and making it stronger and stiffer.
DOI: 10.4236/msa.2019.103017 211 Materials Sciences and Applications Figure 1. 2D and 3D Tapping mode AFM images of (a) (b) 50HDPE/50PP; (c) (d) 60HDPE/40PP; (e) (f) 70HDPE/30PP; (g) (h) 80HDPE/20PP; (i) (j) 90HDPE/10PP poly-blends.
Figure 2. Root mean square roughness (Rq) of the
[image:7.595.207.539.67.217.2]prepared tensile specimens.
Figure 3. Main effect plot for S/N ratio.
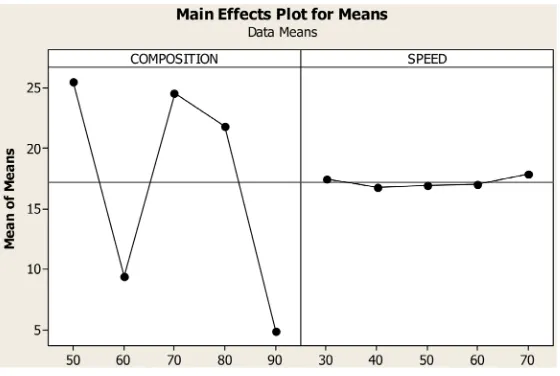
[image:7.595.272.473.276.442.2] [image:7.595.234.514.489.659.2]DOI: 10.4236/msa.2019.103017 212 Materials Sciences and Applications Figure 4. Main effect plot for means.
relative significances of factors in terms of their percentage contribution to the response. This analysis was carried out for a level of significance of 5% (the level of confidence 95%). “P” value, less than 0.05 for a particular parameter, indicates that it has the major effect on the responses. From Table 7 it is observed that “P” value for the factor composition is much lesser than 0.05; so the major control-ling parameter for tensile strength is composition followed by speed.
A correlation between tensile strength at break point “TSb” (non-variable
fac-tor), composition and speed (variable factors) is derived by multiple linear re-gressions from equation No-3. From equation No-4, it is observed that the factor “composition” has a major impact on tensile strength followed by speed.
0 1 2 3
b
TS =K +K A K B K C+ + (3)
where, K ii
(
=0,1,2,3,)
is a model constant. The regression equation is given by36.8 0.287 COMPOSITION 0.010 SPEED b
TS = − + (4)
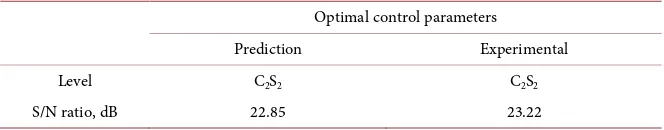
Finally a confirmation test was conducted to evaluate the design parameters influencing the response. The purpose of confirmation experiment is to validate the conclusions drawn during the analysis phase. For this, control parameters with optimal levels of 60HDPE/40PP for composition and 40 mm/min for speed are considered. Table 8 shows the confirmation test result. The experimental result shows an improvement in tensile strength at break point to be 1.6%.
4. Conclusion
DOI: 10.4236/msa.2019.103017 213 Materials Sciences and Applications Table 5. Experimental design using L25 orthogonal array.
L25
(56) Composition, Wt % HDPE Mm/min Speed, Tensile Strength At break, MPa S/N Ratio, dB
1 50 30 25.73 28.21183
2 50 40 23.22 27.31986
3 50 50 26.69 28.52892
4 50 60 25.57 28.15631
5 50 70 26.12 28.33946
6 60 30 14.39 23.16423
7 60 40 13.07 22.32551
8 60 50 6.26 15.93981
9 60 60 6.85 16.72015
10 60 70 6.44 16.18581
11 70 30 23.57 27.44977
12 70 40 24.29 27.70927
13 70 50 24.15 27.65942
14 70 60 25.50 28.13217
15 70 70 25.17 28.01973
16 80 30 20.63 26.29251
17 80 40 20.40 26.19431
18 80 50 22.10 26.88824
19 80 60 21.79 26.76634
20 80 70 23.99 27.6006
21 90 30 2.94 9.378756
22 90 40 3.03 9.654614
23 90 50 5.66 15.0686
24 90 60 5.40 14.6527
25 90 70 7.62 17.64594
Table 6. Response table for tensile strength at break.
Level COMPOSITION: C SPEED: S
1 28.11 22.9
2 18.87 22.64
3 27.79 22.82
4 26.75 22.89
5 13.28 23.56
Delta (Δ) 14.83 0.92
Rank 1 2
[image:9.595.208.539.536.664.2]DOI: 10.4236/msa.2019.103017 214 Materials Sciences and Applications Table 7. ANOVA table for tensile strength at break point.
Source DF Seq SS Adj SS Adj MS F P
COMPOSITION 4 873.54 873.54 218.38 33.83 0
SPEED 4 2.45 2.45 0.61 0.09 0.983
Error 16 103.29 103.29 6.46
Total 24 979.28
DF: Degree of Freedom; seq SS: The Sequential Sum of Squares; Adj SS: Adjusted Sum of Squares; Adj MS: Adjusted Mean Squares.
Table 8. Results of the confirmation experiment.
Optimal control parameters
Prediction Experimental
Level C2S2 C2S2
S/N ratio, dB 22.85 23.22
methods, the polymer composites may find suitable applications areas.
Conflicts of Interest
The authors declare no conflicts of interest regarding the publication of this pa-per.
References
[1] Favaro, S., Pereira, A., Fernandes, J., Baron, O., da Silva, C., Moisés, M. and Rado-vanovic, E. (2017) Outstanding Impact Resistance of Post-Consumer HDPE/Multi- layer Packaging Composites. Materials Sciences and Applications, 8, 15-25.
https://doi.org/10.4236/msa.2017.81002
[2] Erbetta, C.D.C., Azevedo, R.C.S., Andrade, K.S., eSilva, M.E.S.R. and Roberto, F.S. (2017) Characterization and Lifetime Estimation of High Density Polyethylene Containing a Prodegradant Agent. Materials Sciences and Applications, 8, 979-991.
https://doi.org/10.4236/msa.2017.813072
[3] Mendes, L and Cestari, S. (2011) Printability of HDPE/Natural Fiber Composites with High Content of Cellulosic Industrial Waste. Materials Sciences and Applica-tions, 2, 1331-1339. https://doi.org/10.4236/msa.2011.29181
[4] Jacob, G.C., Starbuck, J.M., Feller, J.F., Simunovic, S. and Boeman, R.G. (2004) Strain Rate Fffects on the Mechanical Properties of Polymer Composite Materials.
Journal of Applied Polymer Science,94, 296-301. https://doi.org/10.1002/app.20901
[5] Salih, S., Hamood, A. and Alsalam, A. (2013) Comparison of the Characteristics of LDPE: PP and HDPE: PP Polymer Blends. Modern Applied Science, 7, 33-42.
https://doi.org/10.5539/mas.v7n3p33
[6] Sahoo, P.C., Murmu, R., Patra, S.C., Dutta, C. and Sutar, H. (2018) Electrical Be-haviour and Spherulites Morphology of HDPE/PP Polyblends with HDPE as Base Material. Materials Sciences and Applications, 9, 837-843.
https://doi.org/10.4236/msa.2018.910060
[image:10.595.207.539.232.297.2]DOI: 10.4236/msa.2019.103017 215 Materials Sciences and Applications
Reinforced Composites with High Density Polyethylene (HDPE) as Matrix. Materi-als Sciences and Applications, 9, 502-515. https://doi.org/10.4236/msa.2018.95035
[8] Omar, M.F., Jaya, H., Akil, H.M., Ahmad, Z.A. and Noriman, N.Z. (2015) Me-chanical Properties of High Density Polyethylene (HDPE)/Sawdust Composites under Wide Range of Strain Rate. Applied Mechanics and Materials, 754-755, 83-88.
https://doi.org/10.4028/www.scientific.net/AMM.754-755.83
[9] Abdel-Hakim, A.A., Abdel-Salam Sabbah, I., Metwally, M.S., El Begawy, S. and El-shafie E.S. (2012) Mechanical Properties and Morphology Studies of Nanocompo-sites Based on RSF/Nanoclay Modified /HDPE NanocompoNanocompo-sites. Life Science Jour-nal, 9, 134-142.
[10] Rahman, M.R., Islam, M.N., Huque, M.M., Hamdan, S. and Ahmed, A.S. (2010) Ef-fect of Chemical Treatment on Rice Husk (RH) Reinforced Polyethylene (PE) Composites. BioResources, 5, 854-869.
[11] Yang, H.S., Kim, H.J., Son, J., Park, H.J., Lee, B.J. and Hwang, T.S. (2004) Rice-Husk Flour Filled Polypropylene Composites; Mechanical and Morphological Study. Com-posite Structures, 63, 305-312. https://doi.org/10.1016/S0263-8223(03)00179-X
[12] Bai, S.L., Cao, K., Chen, J.K. and Liu, Z.D. (2000) Tensile Properties of Rigid Glass Bead/HDPE Composites. Polymers and Polymer Composites, 8, 413-418.
[13] Reis, J.M.L., Pacheco, L.J. and da Costa Mattos, H.S. (2013) Influence of the Tem-perature and Strain Rate on the Tensile Behavior of Post-Consumer Recycled High- Density Polyethylene. Polymer Testing, 32, 1576-1581.
https://doi.org/10.1016/j.polymertesting.2013.10.008
[14] Siviour, C.R. and Jordan, J.L. (2016) High Strain Rate Mechanics of Polymers: A Review. Journal of Dynamics Behaviour of Materials, 2, 15-32.
https://doi.org/10.1007/s40870-016-0052-8
[15] Dhoble, A., Kulshreshtha, B., Ramaswami, S. and Zumbrunnen, D.A. (2005) Me-chanical Properties of PP-LDPE Blends with Novel Morphologies Produced with a Continuous Chaotic Advection Blender. Polymer, 46, 2244-2256.
https://doi.org/10.1016/j.polymer.2005.01.057
[16] Al Maadeed, M.A., Labidi, S., Krupa, I. and Ouederni, M. (2015) Effect of Waste Wax and Chain Structure on the Mechanical and Physical Properties of Polyethyl-ene. Arabian Journal of Chemistry, 8, 388-399.