ISSN Print: 1945-3094
DOI: 10.4236/jwarp.2018.1012070 Dec. 29, 2018 1185 Journal of Water Resource and Protection
Determining the Quality of Mine Gushing and
Mixed Water Using Coupled AHP and Fuzzy
Comprehensive Evaluation Methods
Junzhi Wang
1*, Wei Zhao
1, Xinyi Wang
1,2#, Naima A. M. Hersi
1,3, Pingqing Zhang
4,
Xiangyang Sang
41Institute of Resources & Environment, Henan Polytechnic University, Jiaozuo, China
2Collaborative Innovation Center of Coalbed Methane and Shale Gas for Central Plains Economic Region, Jiaozuo, China 3School of Environmental Sciences and Technology, The University of Dodoma, Dodoma, Tanzania
4Ping Dingshan Tian’an Coal Co. Ltd, Pingdingshan, China
Abstract
This study focused on analysis of the chemical characteristics of mine waters. The aim of this study is to correlate the degree of different ionic components in mine water and the influence of their convergence using a combination of the three-scale AHP and fuzzy evaluation methods for the comprehensive evaluation of water quality. Ion chromatography (ICS 1100) has been used to analyze the content of the water sample while portable pH/EC/TDS/Tem- perature meters (SX 811 and SX 813) were used to test physical-chemical pa-rameters. The results of this study show that chemistry of in No.11 gushing
mine is dominated by HCO3-Na and HCO3-Ca, and had a pH between 7.1
and 8.00, belonging to neutral or slightly alkaline water. In addition, water were found to have the hardness between 18 mg/L and 542.5 mg/L. Results also show that the TDS of the roof sandstone and goaves water are higher than Cambrian limestone water, while the turbidity of the mixed water is 20 NTU in the sump, again higher than in other samples such as Cambrian mestone water. Total dissolved solids and the total hardness of Cambrian li-mestone groundwater mainly depend on the content of K+ + Na+, Ca2+,
{
1, , ,2 j}
B= b b b and 2
4
SO− . Thus, chemical composition changes
re-markably after mine water mixing. Results showed that the coal roof sand-stone water is class V while that in the sump is class III, and the Cambrian limestone groundwater is class I. In gushing, the quality of water can vary greatly; thus, water from the coal face roof sandstone and the Cambrian li-mestone should be stored and treated separately before being utilized.
*First author. How to cite this paper: Wang, J.Z., Zhao,
W., Wang, X.Y., Hersi, N.A.M., Zhang, P.Q. and Sang, X.Y. (2018) Determining the Quality of Mine Gushing and Mixed Water Using Coupled AHP and Fuzzy Comprehensive Evaluation Methods. Jour-nal of Water Resource and Protection, 10, 1185-1197.
https://doi.org/10.4236/jwarp.2018.1012070
Received: November 27, 2018 Accepted: December 26, 2018 Published: December 29, 2018
Copyright © 2018 by authors and Scientific Research Publishing Inc. This work is licensed under the Creative Commons Attribution International License (CC BY 4.0).
http://creativecommons.org/licenses/by/4.0/
DOI: 10.4236/jwarp.2018.1012070 1186 Journal of Water Resource and Protection
Keywords
Mine Water, Chemical Characteristics, AHP Method, Fuzzy Comprehensive Evaluation Method, Water Quality Comprehensive Evaluation
1. Introduction
In the course of coal mining, a large amount of mine water needs to be drained to ensure the safety of underground production. In China’s northern coalfields, the annual discharge of mine water is about 1.787 billion m3 and
the average discharge of mine water per ton of coal is about 1.29 m3, but the
average utilization rate is less than 25% [1] [2]. Due to the impact of coal mining activities, the water discharged can contain acidic substances, heavy metals, organic compounds, radioactive elements, bacteria, and other harmful substances that seriously pollute rivers and soils. Because this process also wastes huge volumes of water [3] [4] [5], appropriate strategies for treatment and reuse are of great significance to coal mining ecological and environmental protection.
The key to effectively utilizing and managing mine water is understanding its quality [6]. A number of mathematical models have been proposed to compre-hensively evaluate water quality, including the analytic hierarchy process (AHP)
[7], entropy weight analysis [8], principal component analysis [9], multivariate statistical methods [10], fuzzy comprehensive evaluation methods [11], and ar-tificial neural networks [12]. These methods compare measured data with water quality standards to enable comprehensive evaluation. Singh [13] compared wa-ter chemistry indexes of mine wawa-ter with corresponding standard values to de-termine their effectiveness but did not comprehensively evaluate the influence of various indicators on mine water quality. In later work, Sun [14] applied the fuzzy comprehensive evaluation method to a comprehensive evaluation of coal mine water quality in the arid area of western Chongqing; the results of this study are problematic, however, because this complex method requires the weight determination of each water sample separately. Similarly, Liu [15] used the gray clustering method to evaluate environmental water quality in the Dongsheng coal field, Inner Mongolia. This method applies threshold values to determine the weight value of each index, and therefore does not take into ac-count changes in factors within the same level and their influence on water qual-ity evaluation. Most recently, Gao [16] utilized a SPA-ITFN(Set Pair Analy-sis-Interval Triangular Fuzzy Numbers) coupling model for coal mine ground-water quality evaluation and showed that when the value for a measured factor is larger, weight will also increase; these results are therefore of importance for wa-ter quality evaluation.
DOI: 10.4236/jwarp.2018.1012070 1187 Journal of Water Resource and Protection with the production of waste water, which dissolved the chemical composition becomes very complicated [17]. Due to the limitations of the existing discrimi-nant models, the evaluation results of mine drainage water quality often do not accord with the actual situation, which limits its scientific utilization. It is neces-sary to find a discriminant model that can be realized automatically and the evaluation results conform to the reality.
This paper evaluates mine water gushing from Pingdingshan No. 11 coal mine. A quality evaluation was conducted using AHP (Analytic Hierarchy Process) in tandem with the fuzzy comprehensive evaluation method, and the characteristics of mine water chemistry, ion composition, and confluence were analyzed. The AHP simplifies the process of determining the weight of the fuzzy comprehensive evaluation method and avoids human factor interference; this approach therefore makes the evaluation of mine water quality more scientific and provides a more reliable evaluation. The results of this paper provide a ref-erence method for the automatic and reasonable evaluation of mine drainage water quality.
2. Overview of the Study Area
Pingdingshan No. 11 mine is located in the southwestern margin of this mining area, within the transitional zone between northern subtropical and warm tem-perate monsoonal climate. The annual average temperature is 15˚C and annual average rainfall is 747 mm. About 70 percent of annual rainfall occurs between July and September.
The water source within the Ji group of No. 11 mine is Cambrian and Carbo-niferous limestone, Permian sandstone, and old goaf water. No. 11 mine is lo-cated within the Cambrian limestone recharge area to the south of the Ping-dingshan mining area; where the recharge water source is mainly groundwater, surface water, and shallow aquifer groundwater. As this recharge source is ab-undant and relatively close, this results in a large volume of water inflow during the mining process, more than 500 m3/h on average. It is therefore of paramount
importance to evaluate the water quality of mine and mixed water to enable the rational use of valuable resources.
3. Hydrochemical Characteristics
3.1. Water Sample Collection
DOI: 10.4236/jwarp.2018.1012070 1188 Journal of Water Resource and Protection
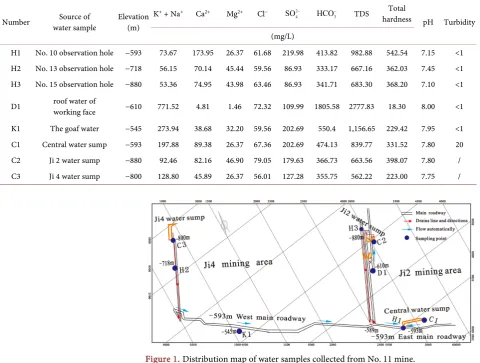
Table 1. Conventional water chemical composition of mine water.
Number water sample Source of Elevation (m) K
+ + Na+ Ca2+ Mg2+ Cl− 2 4 SO−
3
HCO− TDS Total
hardness pH Turbidity (mg/L)
H1 No. 10 observation hole −593 73.67 173.95 26.37 61.68 219.98 413.82 982.88 542.54 7.15 <1 H2 No. 13 observation hole −718 56.15 70.14 45.44 59.56 86.93 333.17 667.16 362.03 7.45 <1 H3 No. 15 observation hole −880 53.36 74.95 43.98 63.46 86.93 341.71 683.30 368.20 7.10 <1
D1 roof water of working face −610 771.52 4.81 1.46 72.32 109.99 1805.58 2777.83 18.30 8.00 <1
K1 The goaf water −545 273.94 38.68 32.20 59.56 202.69 550.4 1,156.65 229.42 7.95 <1 C1 Central water sump −593 197.88 89.38 26.37 67.36 202.69 474.13 839.77 331.52 7.80 20 C2 Ji 2 water sump −880 92.46 82.16 46.90 79.05 179.63 366.73 663.56 398.07 7.80 / C3 Ji 4 water sump −800 128.80 45.89 26.37 56.01 127.28 355.75 562.22 223.00 7.75 /
Figure 1. Distribution map of water samples collected from No. 11 mine.
3.2. Chemical Characteristics of Water
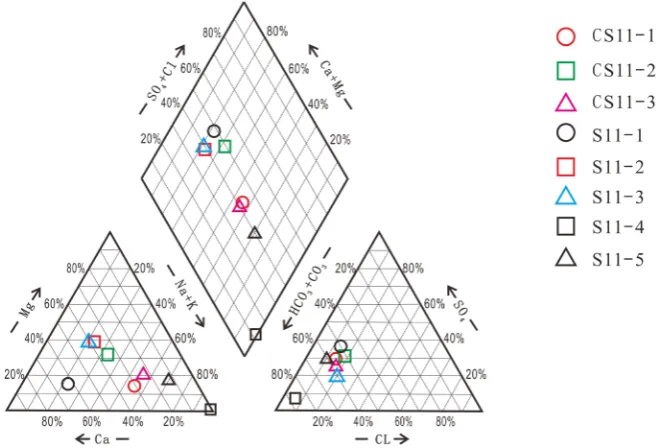
Test results of conventional hydrochemical components are shown Table 1. A piper diagram was constructed based on the six major ions was shown as Figure 2 [3]. Thus, four water sample groups within this analysis were characterized as HCO3-Na (D1, K1, C1, and C3), three were HCO3-Ca (H1, H3, and C2), and one
was HCO3-Mg (H2). The data presented in Table 1 shows that because the pH
[image:4.595.61.542.90.453.2]DOI: 10.4236/jwarp.2018.1012070 1189 Journal of Water Resource and Protection
Figure 2. Piper chart of water samples.
The data presented in Table 2 shows the test results of trace components. Ob-viously, Trace component content of NO3− and F− in Ordovician limestone
wa-ter samples are far lower than that of other wawa-ter samples (D1, K1 and C1). In addition, content of NH4+ in roof crack water samples is 70 times as other
sam-ples. Generally speaking, content of F− in goaf (K1) and
4
NH+ and F− in roof
crack, all exceed class V water standards as defined by Chinese Groundwater Quality Standards (GB/T 14848-93).
3.3. Analysis of Ion Composition
A correlation analysis was performed to measure the relationship between two groundwater variables and to demonstrate source consistency and variability. According to mathematical statistics theory, when r > 0.9, it indicates that there is a significant correlation between the two variables; when 0.6 < r ≤ 0.9, it indi-cates moderatet correlation between the two variables; When 0.4 < r ≤ 0.6, it in-dicates low level correlation between the two variables, similar, When r ≤ 0.46, it indicates little correlation between the two variables [20] [21].
Pearson correlation coefficients for Cambrian limestone groundwater were calculated using the software SPSS (Table 3). These data show that the correla-tion coefficients of TDS and total hardness and K+ + Na+ are 0.985 and 0.988,
respectively. The correlation coefficients of TDS and Ca2+ reached 1. And, the
correlation coefficients of TDS and total hardness and HCO3− are 0.998 and
0.992, respectively. In addition, the correlation coefficients of TDS and total
hardness and 2
4
SO− are 0.999 and 1, respectively. This indicates that TDS and
total hardness, K+ + Na+, Ca2+,
3
HCO−, 2 4
SO− are significantly correlated. In
DOI: 10.4236/jwarp.2018.1012070 1190 Journal of Water Resource and Protection
3
HCO−, 2 4
SO −. This is mainly because the several ions, K+ + Na+, Ca2+,
3
HCO−, 2
4
SO−, control the nature of groundwater.
3.4. The Influence of Confluence on Mine Water Quality
The data presented in Figure 1 show that mine water flows into a sump in the Ji 2 and Ji 4 mining areas. This flow then raises mine water into the −593 m west tunnel through the pump house, flows to the central water sump, and then into the ground. Results from the software Aq·QA used to study the water chemical ions in samples are shown in Table 4.
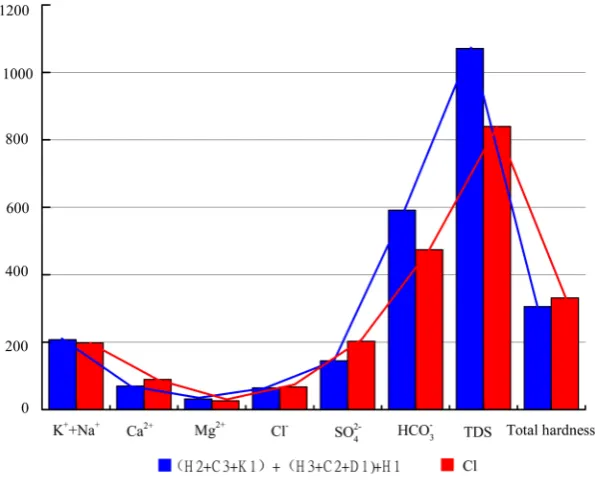
Simulation calculation value of a mixture of various sources of water (H2 + C3 + K1 + H3 + C2 + D1 + H1), based on Aq·QA software and measured value are shown in Table 4 and Figure 3. Obviously, except for 2
4
SO − and 3
HCO−, the
difference between the calculated value and the measured value of most ions is small. In addition, the trend of the connection between the simulated value and the measured value is consistent. This shows that the software simulation results of mine water confluence can be used to estimate the content of ion in mine wa-ter.
From Table 4, we know that values of TDS changed from 667.16 mg/L (H2) to 795.3 mg/L when Cambrian groundwater (H2) was mixed with water from the Ji 4 water sump (C3) and the goaf (K1). Thus, TDS increased from 683.3 mg/L (H3) to 1375 mg/L while water quality changed from freshwater to brack-ish when the Cambrian limestone groundwater (H3) was mixed with that from the Ji 2 water sump (C2) as well as 16,150 roof water from the working face (D1). In addition, TDS fell to 1071 mg/L and total hardness increased to 305.9 mg/L when this was mixed with water from H2 + C3 + K1 and Cambrian limestone groundwater (H1) as the latter was combined with sake. The above results com-prehensively show that the mine water with different ion concentrations will change its ion concentration due to the confluence and affect the overall quality of the water, ultimately.
4. Comprehensive Evaluation of Water Quality
4.1. Establishment of a Fuzzy Relationship Matrix
A set of evaluation factors were created on the basis of the chemical composition of test results from sampling points. Thus, on this basis, those with greater im-pact on the water quality of chemical indicators were selected, as follows: U = {Cl−, 2
4
SO −, 4
NH+, 3
NO−, F−, Ba, TDS, Total hardness, Turbidity}. Chinese
Groundwater Quality Standards (GB/T 14848-93) have established a set of five evaluation factors V = {I, II, III, IV, V} [22]; Table 5 shows selected standard values for groundwater chemical grade classifications.
DOI: 10.4236/jwarp.2018.1012070 1191 Journal of Water Resource and Protection
Figure 3. The comparison between the Aq·QA software simulation values and
[image:7.595.210.540.370.542.2]measured values.
Table 2. Chemical composition of trace water in mine water (mg/L).
Number H1 H2 H3 D1 K1 C1
3
NO− 0.33 0.33 0.37 3.29 10.54 15.61
4 NH+
0.02 0.02 0.02 1.4 0.02 0.02 F− 0.32 0.64 0.68 3.7 2.72 1.72 I− 0.05 0.05 0.05 0.05 0.05 0.05 Li 0.025 0.035 0.033 0.03 0.18 0.06 Sr 0.66 0.71 0.66 0.44 2.18 1.2 Br− 0.32 0.2 0.28 0.04 0.2 0.34 Ba 0.1 0.14 0.13 0.11 0.08 0.15 Volatile phenol 0.008 0.009 0.01 0.011 0.012 0.002
Table 3. Pearson correlation coefficients for Cambrian limestone groundwater.
Icons K+ + Na+ Ca2+ Mg2+ Cl− 2 4 SO−
3
HCO− TDS TH
K+ + Na+ 1
Ca2+ 0.986 1
Mg2+ −0.981 −1.000 1
Cl− −0.770 0.910 −0.119 1
2 4
SO− 0.992 0.999 −0.998 0.050 1
3 HCO−
0.960 0.998 −0.996 0.207 0.988 1 TDS 0.985 1.000 −1.000 0.096 0.999 0.998 1
[image:7.595.199.539.572.739.2]DOI: 10.4236/jwarp.2018.1012070 1192 Journal of Water Resource and Protection
Table 4. The major ion changes under different water samples mixing (mg/L).
Number Water source K+ + Na+ Ca2+ Mg2+ Cl− 2 4 SO−
3
HCO− TDS TH
[image:8.595.209.540.207.426.2]1 H2 + C3 + K1 153.2 51.6 34.7 58.4 139.1 413.1 795.3 271.5 2 H3 + C2 + D1 305.8 52.4 31.3 70.3 125.5 835.2 1375.0 261.3 3 1 + 2 + H1 207.1 70.1 31.8 64.5 144.8 591.0 1071.0 305.9 4 C1 197.88 89.38 26.37 67.36 202.69 474.13 839.77 331.52
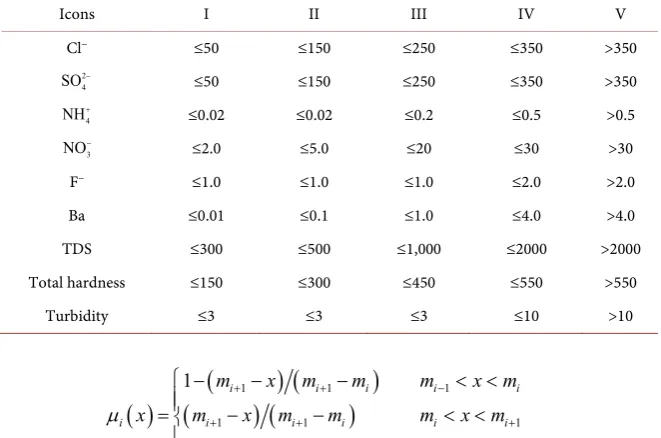
Table 5. Water quality grading standards based on evaluation factors (mg/L).
Icons I II III IV V
Cl− ≤50 ≤150 ≤250 ≤350 >350
2 4
SO− ≤50 ≤150 ≤250 ≤350 >350
4
NH+ ≤0.02 ≤0.02 ≤0.2 ≤0.5 >0.5
3
NO− ≤2.0 ≤5.0 ≤20 ≤30 >30
F− ≤1.0 ≤1.0 ≤1.0 ≤2.0 >2.0 Ba ≤0.01 ≤0.1 ≤1.0 ≤4.0 >4.0 TDS ≤300 ≤500 ≤1,000 ≤2000 >2000 Total hardness ≤150 ≤300 ≤450 ≤550 >550
Turbidity ≤3 ≤3 ≤3 ≤10 >10
( )
(
) (
)
(
1 1) (
1 1)
1 11 1
1
0 ,
i i i i i
i i i i i i
m i
m x m m m x m
x m x m m m x m
x m x m
µ
+ + −
+ + +
− +
− − − < <
= − − < <
≤ ≥
where x is the measured value; i is evaluation rank vaule, μ is the membership of the evaluation factor.
Thus, the corresponding Fuzzy relationship matrix is calculated as follows:
1
0.883 0.117 0.000 0.000 0.000 0.000 0.300 0.700 0.000 0.000 1.000 0.000 0.000 0.000 0.000 0.000 0.000 0.000 0.000 1.000 1.000 0.000 0.000 0.000 0.000 0.000 1.000 0.000 0.000 0.000 0.000 0.034 0.966 0.000 0.000 0.000 0.000 0.07
ij T = t =
5 0.925 0.000 1.000 0.000 0.000 0.000 0.000
And the membership matrix of other water samples are calculated as in sam-ple H1.
4.2. Weight Determination Using AHP
DOI: 10.4236/jwarp.2018.1012070 1193 Journal of Water Resource and Protection
0 1 0 1 1 1 1 1 0
1 0 1 1 1 1 1 1 0
0 1 0 1 1 1 1 1 0
1 1 1 0 1 1 0 1 1
1 1 1 1 0 1 0 1 1
1 1 1 1 1 0 1 1 1
1 1 1 0 0 1 0 1 1
1 1 1 1 1 1 1 0 1
0 0 0 1 1 1 1 1 0
ij P p − − − − − − − − − − − − − − − = = − − − − − − − − − − − − − − −
Thus, in this matrix
is more important than and are just as important 1 is not important
1 0
for
i j
ij i j
i j
p p
p p p
p p = −
The following formula is then used to build an optimal transfer matrix, ,
ik jk
q q are the element in the comparison matrix Q.
(
)
(
)
1 1
1 n 1 n
ij ik jk ik jk
k k
q p p p p
n = n =
=
∑
− =∑
+0.000 0.333 0.000 1.000 1.222 0.444 1.111 0.667 0.111
0.333 0.000 0.333 0.667 0.889 0.778 0.778 0.333 0.222
0.000 0.333 0.000 1.000 1.222 0.444 1.111 0.667 0.111
1.000 0.667 1.000 0.000 0.222 1.444 0.111 0.333 0.889 Q
− − − − − −
− − − −
− − − − − −
− −
= 1.222 0.889 1.222 0.222 0.000 1.667 0.111 0.556 1.111
0.444 0.778 0.444 1.444 1.667 0.000 1.556 1.111 0.556 1.111 0.778 1.111 0.111 0.111 1.556 0.000 0.444 1.000 0.667 0.333 0.667 0.333 0.556 1.111 0.444 0.000 0.556 0.111 0.
− − − − − − − −
−
− − −
− 222 0.111 0.889 1.111 0.556 1.000 0.556 0.000
− − − −
Next, after an optimal transfer matrix is established, a judgment matrix is cal-culated using the formula rij =exp
( )
qij , as follows:1.000 0.717 1.000 0.368 0.295 1.560 0.329 0.513 0.895 1.396 1.000 1.396 0.513 0.411 2.177 0.450 0.717 1.250 1.000 0.717 1.000 0.368 0.295 1.560 0.329 0.513 0.895 2.718 1.948 2.718 1.000 0.801 4.240 0.895 1.396 2.432 3.395 2.432 3.395 1.2
R= 49 1.000 5.295 1.18 1.743 3.038
0.641 0.459 0.641 0.236 0.189 1.000 0.211 0.329 0.574 3.038 2.177 3.038 1.118 0.895 4.738 1.000 1.560 2.718 1.948 1.396 1.945 0.717 0.574 3.038 0.641 1.000 1.743 1.118 0.801 1.118 0.411 0.329 1.743 0.368 0.574 1.000
Finally, in order to determine the weight of water chemical indicators, the following formula is applied [25]:
1 1 1 n n ik k
i n n
DOI: 10.4236/jwarp.2018.1012070 1194 Journal of Water Resource and Protection
(
0.062,0.086,0.062,0.167,0.209,0.040,0.187,0.120,0.069)
i w =
4.3. Comprehensive Evaluation of Water Quality
Based on B T w= ×i i, water quality can be evaluated as B=
{
b b1, , ,2 bj}
,where bj is the corresponding grade corresponding to a maximum B value. Ti is
the membership matrix of water sample, wi is the weight of each evaluation
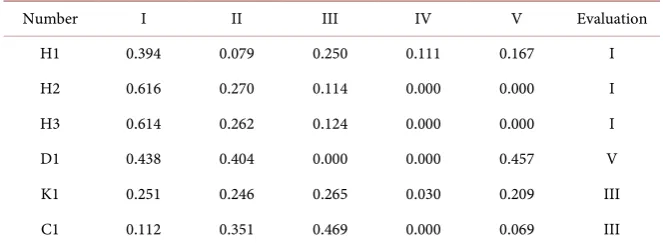
fac-tor [26]. On this basis, water quality evaluation of Cambrian limestone ground-water (H1) is B1=
(
0.394,0.079,0.250,0.111,0.167)
and can be classified astype I. All other results are shown in Table 6.
The water samples are all tested by Henan Provincial Geological Environment Monitoring Institute with Grade A qualification, and the test results are reliable. All water quality assessments are graded according to China’s Groundwater Quality Standard (GB/T 14848-93), the criteria are consistent. The weights of the evaluation factors are determined using the AHP method, avoiding man-made influence. Based on the above three reasons, the evaluation results are reliable and can be used for the treatment and utilization of mine water.
Research indicates Cambrian limestone groundwater from NO. 11 mine is Class I, and the water quality is superior. This is mainly due to the excellent cir-culation of the Cambrian limestone groundwater. Then, roof water is ClassⅤ,
inferiorin addition water from goaf and central water sump are Class III. This is because Sandstone fissure water has recharge and poor runoff conditions.
Data show that the large difference in water quality depends on gushing source. This means that roof water from the working face and Cambrian limes-tone groundwater should be stored separately before being distinctively treated and utilized according to their respective levels of quality. This approach will guarantee the direct use of Cambrian limestone water and will also reduce mine drainage treatment costs.
5. Conclusions
1) The results of this study show that the chemistry of mine drainage water within the No. 11 mine in the Pingdingshan area mainly consists of HCO3-Na
and HCO3-Ca and that pH is between 7.1 and 8.0. This means that the drainage
water in this region is either neutral or weakly alkaline, has a hardness between 18 mg/L and 542.5 mg/L, and can be classified as hard. Data show that TDS val-ues for the top sandstone and goat water samples are higher than others, and that the turbidity of mixed water in the central water sump is 20, again higher than all other samples.
2) A Pearson correlation coefficient analysis of hydrochemical parameters from the observation hole revealed significant relationships between Ca2+,
3
HCO−, and 2
4
SO− versus TDS and total hardness. At the same time, the
corre-lation coefficients between Ca2+ and
3
HCO− versus 2
4
SO− are significant
re-lated, too. The TDS and total hardness of groundwater in the Cambrian limes-tone are mainly determined by the content K+ + Na+, Ca2+,
3
HCO− and 2
4
DOI: 10.4236/jwarp.2018.1012070 1195 Journal of Water Resource and Protection
Table 6. Comprehensive evaluation of water quality from No. 11 mine samples.
Number I II III IV V Evaluation H1 0.394 0.079 0.250 0.111 0.167 I H2 0.616 0.270 0.114 0.000 0.000 I H3 0.614 0.262 0.124 0.000 0.000 I D1 0.438 0.404 0.000 0.000 0.457 V K1 0.251 0.246 0.265 0.030 0.209 III C1 0.112 0.351 0.469 0.000 0.069 III
3) Results show that subsequent to mixing with mine water, TDS values in-creased from an initial level of 683.3 mg/L to 1375 mg/L within the Ji 2 mining area, and from 667.16 mg/L to 795.3 mg/L within the Ji 4 mining area. This re-sults show that the composition and quality of mine water significantly changes following confluence.
4) Use of the AHP and fuzzy comprehensive evaluation methods to compre-hensively evaluate water quality show that samples from the roof sandstone within the working face are class V, while those from the goaf and central sump are class III, and Cambrian limestone groundwater can be classified as class I. Thus, the Cambrian limestone groundwater quality is superior and roof water quality is inferior.
5) Due to the great difference in water quality between gushing water sources of mines, the water from roof and Cambrian limestone should be separately stored, and then be treated and used respectively. This can ensure the rational allocation of mine drainage water resources and scientific use.
Acknowledgments
This work was supported by the National Natural Science Foundation of China (Grant 41672240), the Henan Province Technological Innovation Team of Colleges and Universities (Grant 15IRTSTHN027), the Innovation Scientists and Technicians Troop Construction Projects of Henan Province (Grant CXTD2016053), the Fundamental Research Funds for the Universities of Henan Province (NSFRF1611).
Conflicts of Interest
The authors declare no conflicts of interest regarding the publication of this pa-per.
References
[1] He, X.W., Yang, J., Shao, L.N., Li, F.Q. and Wang, X. (2008) Problem and Counter Measure of Mine Water Resource Regeneration in China. Journal of China Coal So-ciety, 33, 63-66.
DOI: 10.4236/jwarp.2018.1012070 1196 Journal of Water Resource and Protection
Exploration Technology for Mine Water Disaster in China: Applications and Trends. Mine Water & the Environment, No. 5, 1-10.
[3] Batsaikhan, B., Kwon, J.S., Kim, K.H., Lee, Y.J., Lee, J.H., Badarch, M. and Yun, S.T. (2016) Hydrochemical Evaluation of the Influences of Mining Activities on River Water Chemistry in Central Northern Mongolia. Environmental Science and Pollu-tion Research, 1-16.
[4] Li, S.J., Wu, Q., Cui, F.P., Zeng, Y.F. and Wang, G.R. (2014) Major Characteristics of China’s Coal Mine Water Disaster Occurred in Recent Years. Applied Mechanics & Materials, 501-504, 336-340.
https://doi.org/10.4028/www.scientific.net/AMM.501-504.336
[5] Nordstrom, D.K., Blowes, D.W. and Ptacek, C.J. (2015) Hydrogeochemistry and Microbiology of Mine Drainage: An Update. Applied Geochemistry, 57, 3-16.
https://doi.org/10.1016/j.apgeochem.2015.02.008
[6] He, X.W. and Li, F.Q. (2010) New Technology and Development Tendency of Mine Water Treatment. Coal Science and Technology, 38, 17-22.
[7] Aryafar, A., Yousefi, S. and Ardejani, F.D. (2013) The Weight of Interaction of Mining Activities: Groundwater in Environmental Impact Assessment Using Fuzzy Analytical Hierarchy Process (FAHP). Environmental Earth Sciences, 68, 2313-2324.
https://doi.org/10.1007/s12665-012-1910-x
[8] Wu, J.H., Li, P.Y., Qian, H. and Chen, J. (2015) On the Sensitivity of Entropy Weight to Sample Statistics in Assessing Water Quality: Statistical Analysis Based on Large Stochastic Samples. Environmental Earth Sciences, 74, 2185-2195.
https://doi.org/10.1007/s12665-015-4208-y
[9] Ouyang, Y. (2005) Evaluation of River Water Quality Monitoring Stations by Prin-cipal Component Analysis. Water Research, 39, 2621-2635.
https://doi.org/10.1016/j.watres.2005.04.024
[10] Chow, M.F., Shiah, F.K., Lai, C.C., Kuo, H.Y., Wang, K.W., Lin, C.H., Chen, T.Y., Kobayashi, Y. and Ko, C.Y. (2016) Evaluation of Surface Water Quality Using Mul-tivariate Statistical Techniques: A Case Study of Fei-Tsui Reservoir Basin, Taiwan.
Environmental Earth Sciences, 75, 1-15. https://doi.org/10.1007/s12665-015-4922-5
[11] Lu, X.W., Li Loretta, Y., Lei, K., Wang, L.J., Zhai, Y.X. and Zhai, M. (2010) Water Quality Assessment of Wei River, China Using Fuzzy Synthetic Evaluation. Envi-ronmental Earth Sciences, 60, 1693-1699.
https://doi.org/10.1007/s12665-009-0303-2
[12] Singh, K.P., Basant, A., Malik, A., et al. (2009) Artificial Neural Network Modeling of the River Water Quality—A Case Study. Ecological Modelling, 220, 888-895.
https://doi.org/10.1016/j.ecolmodel.2009.01.004
[13] Singh, A.K., Mahato, M.K., Neogi, B. and Singh, K.K. (2010) Quality Assessment of Mine Water in the Raniganj Coalfield Area, India. Mine Water & the Environment, 29, 248-262. https://doi.org/10.1007/s10230-010-0108-2
[14] Sun, H.F., Zhao, F.H., Zhang, L., Liu, Y.M., Cao, S.H. and Zhang, W. (2014) Com-prehensive Assessment of Coal Mine Drainage Quality in the Arid Area of Western Chongqing. Journal of China Coal Society, 39, 736-743.
[15] Liu, Y.F., Wu, Q. and Zhao, X.N. (2013) Mine Water Quality Characteristics and Water Environment Evaluation of Inner Mongolia Dongsheng Coal Field. Clean Coal Technology, 19, 101-106.
Environ-DOI: 10.4236/jwarp.2018.1012070 1197 Journal of Water Resource and Protection mental Protection, 42, 68-71.
[17] Favas, P., Sarkar, S.K., Rakshit, D., et al. (2016) Acid Mine Drainages from Aban-doned Mines: Hydrochemistry, Environmental Impact, Resource Recovery, and Prevention of Pollution. Environmental Materials and Waste. Elsevier Inc., 413-462. [18] Tikhomirov, V.V. (2016) Hydrogeochemistry Fundamentals and Advances, Volume 1, Groundwater Composiiton and Chemistry. Hydrogeochemistry Fundamentals and Advances: Groundwater Composition and Chemistry, Volume 1.
[19] Wang, X.Y. (2011) Applied Hydrogeology. China University of Mining and Tech-nology Press.
[20] Guo, Q.L., Xiong, X.Z. and Jiang, J.R. (2016) Hydrochemical Characteristics of Sur-face and Ground Water in the Kuye River Basin. Environmental Chemistry, 35, 1372-1380.
[21] Labar, J.A. and Nairn, R.W. (2017) Evaluation of the Impact of Na-SO4, Dominated Ionic Strength on Effluent Water Quality in Bench-Scale Vertical Flow Bioreactors Using Spent Mushroom Compost. Mine Water & the Environment, 1-11.
[22] Tiwari, A.K., Singh, P.K. and Mahato, M.K. (2016) Environmental Geochemistry and a Quality Assessment of Mine Water of the West Bokaro Coalfield, India. Mine Water & the Environment, 1-11. https://doi.org/10.1007/s10230-015-0382-0
[23] Han, L., Song, Y.H., Duan, L. and Yuan, P. (2015) Risk Assessment Methodology for Shenyang Chemical Industrial Park Based on Fuzzy Comprehensive Evaluation.
Environmental Earth Sciences, 73, 5185-5192.
https://doi.org/10.1007/s12665-015-4324-8
[24] Ren, X. (2016) Application of Three Scale AHP Method in Nuclear Accident Emer-gency Decision Making of Equipment System. International Conference on Ad-vances in Energy, Environment and Chemical Science.
[25] Xue, X.H. and Yang, X.G. (2014) Seismic Liquefaction Potential Assessed by Fuzzy Comprehensive Evaluation Method. Natural Hazards, 71, 2101-2112.
https://doi.org/10.1007/s11069-013-0997-z
[26] Lai, C.G., Chen, X.H., Chen, X.Y., Wang, Z.L., Wu, X.S. and Zhao, S.W. (2015) A Fuzzy Comprehensive Evaluation Model for Flood Risk Based on the Combination Weight of Game Theory. Natural Hazards, 77, 1243-1259.