MORPHOMETRIC AND HISTOLOGICAL QUANTITATIVE ANALYSIS OF NEPHRON DURING
DEVELOPMENT OF HUMAN FETAL KIDNEY IN LATER HALF OF GESTATION
1
Rajni Thakur
1
Department of Anatomy, Pt. J. N. M. Medical College Raipur, Chhattisgarh, India
2
Department of Community Medicine, Government Medical College Rajnandgaon, Chhattisgarh, India
ARTICLE INFO ABSTRACT
Introduction:
outcome and knowledge of the fetal kidney is important
Aim:
development of the kidney in later half of gestation.
Material and method:
College Raipur, Chhattisgarh, India. The material for study (fetuses) were obtained from the labour room of the R.N.T.District ho
aged between16 weeks to 40 weeks, were taken from cases of abortions, stillbirth from premature and normal deliveries with apparently normal history of gestation. Fetal kidneys dissected histological slides were made, stained with Haematoxylin & eosin and observed under projection microscope.
Result:
increase their developing gestation age. Grow
but is more marked after 28 weeks. After this the numerical density of the glomeruli decreases, in spite of an increase in total number of glomerli.
Conclusion:
from 294.9 at 16 weeks gestational age to 430 in 28 weeks, but after 28 weeks a steady decline was seen up to 40 weeks when the density decreased to 339.9 .Except for the period between 16 week and 20 weeks an
Copyright©2017, Rajni Thakur and Anjana Tiwari. This unrestricted use, distribution, and reproduction in any medium
INTRODUCTION
Normal development of the fetal kidney is crucial to neonatal outcome and knowledge of the fetal kidney is important for the identification of abnormalities. Organogenesis of the kidney begins with the successive appearance of pronephros, mesonephros, and metanephros (Dodge, 1997
human kidney is derived from the mesonephric blastema. Local mesenchyme migrates into metanephric blastema to form glomeruli and vasa recta. In brief, the ureteric bud developing from the mesonephric duct dilates and forms ampulla. mesenchymatous tissue epithelises and forms vesicles which fuse with the ampulla to form a nephron.
development begins around 5th week of IUL and terminates in the last month of 3rd trimester of pregnancy with subsequent interstitial growth. Many such nephrons are present in fetal kidney due to multiple branching of the ampullary bud and
*Corresponding author: Anjana Tiwari,
Department of Community Medicine, Government Medical College Rajnandgaon, Chhattisgarh, India.
ISSN: 0975-833X
Article History:
Received 22nd June, 2017
Received in revised form 29th July, 2017
Accepted 04th August, 2017
Published online 30th September, 2017
Citation: Rajni Thakur and Anjana Tiwari, 2017.
kidney in later half of gestation”, International Journal of Current Research
Key words:
Human fetal kidney, Gestational age, Crown lump length, Glomeruli, Numerical density.
RESEARCH ARTICLE
MORPHOMETRIC AND HISTOLOGICAL QUANTITATIVE ANALYSIS OF NEPHRON DURING
DEVELOPMENT OF HUMAN FETAL KIDNEY IN LATER HALF OF GESTATION
Rajni Thakur and *
,2Anjana Tiwari
Department of Anatomy, Pt. J. N. M. Medical College Raipur, Chhattisgarh, India
Department of Community Medicine, Government Medical College Rajnandgaon, Chhattisgarh, India
ABSTRACT
Introduction: Normal development of the fetal kidney in prenatal period is crucial to neonatal outcome and knowledge of the fetal kidney is important for the identification of abnormalities.
To study morphometric and histological quantitative changes of nephrons during the development of the kidney in later half of gestation.
Material and method: The study was conducted in the Department of Anatomy, Pt.J.N.M.Medical College Raipur, Chhattisgarh, India. The material for study (fetuses) were obtained from the labour room of the R.N.T.District hospital Kondagaon, Chhattisgarh. A total of 42 kidneys of gestational aged between16 weeks to 40 weeks, were taken from cases of abortions, stillbirth from premature and normal deliveries with apparently normal history of gestation. Fetal kidneys dissected histological slides were made, stained with Haematoxylin & eosin and observed under projection microscope.
Result: in current study volume and weight, Crown lump length are continuous increases along with increase their developing gestation age. Growth of the kidney was occurring throughout prenatal life, but is more marked after 28 weeks. After this the numerical density of the glomeruli decreases, in spite of an increase in total number of glomerli.
Conclusion: Numerical density of glomeruli per cubic m.m of kidney tissue was found to increase from 294.9 at 16 weeks gestational age to 430 in 28 weeks, but after 28 weeks a steady decline was seen up to 40 weeks when the density decreased to 339.9 .Except for the period between 16 week and 20 weeks and between 32 and 36 weeks .Significant variation was seen between different age groups.
This is an open access article distributed under the Creative Commons medium, provided the original work is properly cited.
Normal development of the fetal kidney is crucial to neonatal outcome and knowledge of the fetal kidney is important for the identification of abnormalities. Organogenesis of the kidney begins with the successive appearance of pronephros, , 1997). Difinitive human kidney is derived from the mesonephric blastema. Local mesenchyme migrates into metanephric blastema to form glomeruli and vasa recta. In brief, the ureteric bud developing orms ampulla. The mesenchymatous tissue epithelises and forms vesicles which fuse with the ampulla to form a nephron. Metanephric week of IUL and terminates in trimester of pregnancy with subsequent stitial growth. Many such nephrons are present in fetal kidney due to multiple branching of the ampullary bud and
Department of Community Medicine, Government Medical College
indication of various mesenchymatous condensates to from nephron arcades. This process of renal development begins at deeper regions and reaches the peripheral part of the cortex (Osathanondh, 1963). The tubules go on elongating, becoming more convoluted. The glomerular cells keep on differentiating until they acquire their adult features forming the maturing stage glomeruli in developing kidneys. The number shape, size, and the distribution of nephrons provide an important, information about the organ
(Nyengaard, 1999).Kidney size is presumably influenced both by genetic and environmental factors. The number of glomeruli at birth is presumably genetically determined. The size of kidneys is dependent on the number and size of nephr (Nyengaard, 1999; Potter, 1945;
filtration surface area depends on the glomerular density and the glomerular surface area, any variation in these factors alters the total filtration area which is a useful indicator of renal development. Manifestations of renal disorders are directly related to developmental anatomy of kidney including both morphological and stereological parameters
International Journal of Current Research
Vol. 9, Issue, 09, pp.57624-57630, September, 2017
2017. “Morphometric and histological quantitative analysis of nephron
International Journal of Current Research, 9, (09), 57624-57630.
MORPHOMETRIC AND HISTOLOGICAL QUANTITATIVE ANALYSIS OF NEPHRON DURING
DEVELOPMENT OF HUMAN FETAL KIDNEY IN LATER HALF OF GESTATION
Department of Anatomy, Pt. J. N. M. Medical College Raipur, Chhattisgarh, India
Department of Community Medicine, Government Medical College Rajnandgaon, Chhattisgarh, India
Normal development of the fetal kidney in prenatal period is crucial to neonatal for the identification of abnormalities. To study morphometric and histological quantitative changes of nephrons during the
The study was conducted in the Department of Anatomy, Pt.J.N.M.Medical College Raipur, Chhattisgarh, India. The material for study (fetuses) were obtained from the labour spital Kondagaon, Chhattisgarh. A total of 42 kidneys of gestational aged between16 weeks to 40 weeks, were taken from cases of abortions, stillbirth from premature and normal deliveries with apparently normal history of gestation. Fetal kidneys dissected out, histological slides were made, stained with Haematoxylin & eosin and observed under projection
in current study volume and weight, Crown lump length are continuous increases along with th of the kidney was occurring throughout prenatal life, but is more marked after 28 weeks. After this the numerical density of the glomeruli decreases, in
ic m.m of kidney tissue was found to increase from 294.9 at 16 weeks gestational age to 430 in 28 weeks, but after 28 weeks a steady decline was seen up to 40 weeks when the density decreased to 339.9 .Except for the period between 16 week and d between 32 and 36 weeks .Significant variation was seen between different age groups.
Commons Attribution License, which permits
indication of various mesenchymatous condensates to from This process of renal development begins at deeper regions and reaches the peripheral part of the cortex The tubules go on elongating, thus ted. The glomerular cells keep on differentiating until they acquire their adult features forming the maturing stage glomeruli in developing kidneys. The number shape, size, and the distribution of nephrons provide an important, information about the organization of the kidney Kidney size is presumably influenced both by genetic and environmental factors. The number of glomeruli at birth is presumably genetically determined. The size of kidneys is dependent on the number and size of nephrons , 1945; Hinchliffe, 1991). The total filtration surface area depends on the glomerular density and the glomerular surface area, any variation in these factors alters the total filtration area which is a useful indicator of renal development. Manifestations of renal disorders are directly related to developmental anatomy of kidney including both morphological and stereological parameters (Behrman, 2004). OF CURRENT RESEARCH
There are many reasons for the importance of studying the kidney development. The human developing kidney, however, has not been quantified yet. It has been proposed that many renal disease stages in the adults should be determined by the events that occur during the fetal develop-ment (Moritz, 1999). Therefore the current work to provide morphological development of kidney in human fetuses and stereological estimation of the total volume of kidney, as well as to determine a quantitative changes in glomerular density, glomerular area. Since there are very few human studies in regard to the developing kidney the present study was conducted.
MATERIALS AND METHODS
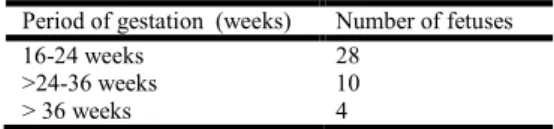
This study was based on the histological examination of 42 kidneys, taken from fetuses of varying gestational ages, ranging from 16 weeks to 40 weeks of intra-uterine life. The study was in the department of Anatomy, Pt. J. N. M. Medical College, Raipur, Chhattisgarh, India. The material for study (fetuses) were obtained from the labour room of the R.N.T. District hospital Kondagaon, Chhattisgarh. After approval from the institutional ethical committee, after the consent of parents and brief antenatal, medical, past history from the mother was taken. Fetuses with any external deformity were excluded from the study. Fetuses taken were from cases of abortions, stillbirth from premature and normal deliveries with apparently normal history of gestation (shown in Table 1).
Table 1. Distribution of examined fetuses according to period of gestation
Period of gestation (weeks) Number of fetuses
16-24 weeks 28
>24-36 weeks 10
> 36 weeks 4
After naked eye examination of fetuses, their crown rump length was measured by a sliding anthropometric calipers, weight by physical balance, volume was determined by water displacement method using a graduated cylinder. The kidneys were dissected out. They were immersed and fixed immediately in 10% formalin solution. Entire kidneys were embedded en bloc in paraffin using standard protocol. Tissue block were serially sectioned to generate 5 micron thick section using Rotary microtome. The sections after mounting were stained with Haematoxylin & eosin and were observed under projection microscope. Numerical density of glomeruli per unit volume and in the entire kidney in each specimen was determined by stereological procedure. Kidneys were divided into 7 age group on the basis of their gestational age (shown in Table 2).
Table 2. Distribution of kidneys according to age group and there period of gestation
Age group Period of gestation (weeks)
I 12-16 weeks
II 16-20 weeks
III 20-24 weeks
IV 24-28 weeks
V 28-32 weeks
VI 32-36 weeks
VII 36-40 weeks
The data obtained was analyzed with the help of statistical tool, arithmetic Mean, standard Deviation, analysis of variance, Student’s t-test for assessing the significance of difference.
RESULTS
Gross Examination
All Fetal kidneys of different gestational ages (16 week to 40 week) were obtained. Crown-Rump length of the fetus was measured.(shown in Table 3)), Crown Rump length increase along with age and also measured weight and volume of right and left kidneys from each specimen in different age group.(shown in Table 4). It also showed increase weight and volume along with increase there gestational ages.
Table 3.
Age (in lunar month,in weeks) No of the fetus Crown Rump
length(mm)
16 4.1 65
4.2 65
4.3 70
20 5.1 105
5.2 127
5.3 128
5.4 139
5.5 150
24 6.1 160
6.2 174
6.3 185
6.4 186
6.5 190
6.6 198
28 7.1 213
32 8.1 244
8.2 254
36 9.1 274
9.2 290
40 10.1 300
10.2 330
Microscopic Examination This study presented sequential
view of human renal development on basis of histological examination of 42 formalin fixed kidneys using projection microscope under 100 X and 10 X, 20X objective lenses and the following observations were made: Quantitative aspect (Marphology and stereology) dimension of the microscopic examination was the estimation of numerical density per unit volume and total number of glomeruli in each kidney.
Number of glomeruli per unit volume
In each specimen, number of glomeruli per unit volume of the kidney were determined by the following formula
Where Nv is the number of glomeruli per cubic m.m of the
kidney tissue.
NA is the number of glomeruli counted within the field.
A-Area of the field
D- Mean diameter of the glomeruli T-Thickness of the section
The following procedure was followed:
Distance between points of maximum convexity of two glomeruli was measured. 100 such observations were recorded and the mean value was calculated. It was found to range from 30 to 40 m. m.
A diameter of 2-10 times the mean distance was selected and superimposed on the screen of the Projection Microscope. For this, a circle of diameter 190 m. m. (19 cm.) was selected. Its area was determined by the following formula:
=
To determine D, that is, mean diameter of the glomeruli, 100 glomeruli at random were taken their maximum diameter determined. Their mean value was taken to calculate D.
T, thickness of the section was 5 or 0.005 m. m.
To calculate NA, field of the cortex was taken at random
and number of glomeruli in that field were counted. A glomeruli partially visible was included only if its centre was seen within the field.
60 different fields were thus observed and the numbers of glomeruli per unit volume were estimated in each case.
Subsequently, their mean value and respective standard deviation were calculated.
Table 4. Weight and volume of the the kidneys in relation to gestational age
Gestational Age(weeks)
No of
fetus Side Weight(mg/gm) Volume(c.c.)
16 4.1 Right 70 mg 1.0
Left 82 mg 1.0
4.2 Right 90 mg 1.0
Left 85 mg 1.0
4.3 Right 68 mg 1.0
Left 58 mg 1.0
20 5.1 Right 190 mg 1.0
Left 208 mg 1.0
5.2 Right 225 mg 1.0
Left 303 mg 1.0
5.3 Right 220 mg 1.0
Left 400 mg 1.0
5.4 Right 720 mg 1.0
Left 810 mg 1.0
5.5 Right 625 mg 1.0
Left 710 mg 1.0
24 6.1 Right 1.065 gm 1.0
Left 1.210 gm 1.0
6.2 Right 1.053 gm 1.0
Left 1.074 gm 1.0
6.3 Right 1.345 gm 1.5
Left 1.290 gm 1.5
6.4 Right 1.703 gm 1.5
Left 1.780 gm 2.0
6.5 Right 2.000 gm 2.0
Left 2.300 gm 2.0
6.6 Right 2.205 gm 2.0
Left 2.290 gm 2.0
28 7.1 Right 2.140 gm 3.0
Left 3.285 gm 3.0
32 8.1 Right 3.365 gm 3.0
Left 3.300 gm 3.0
8.2 Right 3.410 gm 3.0
Left 2.700 gm 3.0
36 9.1 Right 4.500 gm 5.0
Left 4.780 gm 5.0
9.2 Right 5.385 gm 5.0
Left 5.570 gm 5.0
40 Right 5.460 gm 5.0
Left 6.640 gm 7.0
Right 6.850 gm 6.0
Left 7.845 gm 7.0
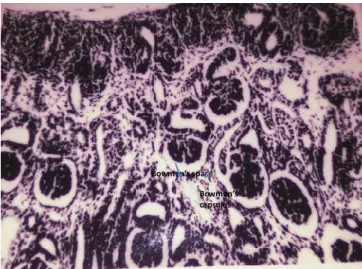
Bowman’s space
Bowman’s capsules
Fig. 1. Photomicrograph showing presence of nephrogenic zone (10X .H&E stain)
Total number of glomeruli in the kidney
In order to determine the total number of glomeruli in a kidney following formula was used.
N = NV x V
Where N is total number of glomeruli in the kidney.
NV is the number of glomeruli per unit volume of kidney tissue.
And V is the volume of the kidney.
Again in each specimen mean value and the standard deviation was calculated
3. Further as stated in the last chapter, kidneys were classified in seven groups on the basis of their gestational age. The mean and standard deviation of each group, as shown in the following table was determined by calculating the collective mean and collective standard deviation of the number of glomeruli per unit volume (shown in Table 5).
Table 5. Numerical density of glomeruli per cubic m.m at different gestational ages
Gestational age (weeks) Group Mean S.D
16 I 294.89 37.39
20 II 295.87 52.61
24 III 430.05 46.95
28 IV 523.58 20.76
32 V 452.62 32.92
36 VI 449.44 41.85
40 VII 339.97 37.84
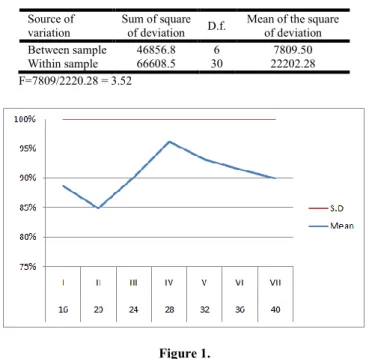
The graphic representation off the average number of glomeruli per unit volume with respect to gestational age is shown in Figure -1. It may be inferred from this figure that there is very slight difference between 12 and 20 weeks of gestational age. But between 20 week and 28 weeks, there is a steady increase in the number of glomeruli. It declined steadily after 28 weeks until the 32weeks where after it did not significantly change in the 36 weeks. However after 36 weeks, the decrease was more rapid. In order to determine the variability and its significance between the groups, following statistical tools were used.
Analysis of Variance: This was used to determine the
Fig. 2. Photomicrograph showing nephrogenic zone in fetus of 16 wk (10X. H&E stain)
Fig. 3. Photomicrograph showing nephrogenic zone in fetus of 40 wk (10X .H & E stain)
Table 6.
Source of variation
Sum of square
of deviation D.f.
Mean of the square of deviation
Between sample 46856.8 6 7809.50
Within sample 66608.5 30 22202.28
F=7809/2220.28 = 3.52
Figure 1.
Since the calculated value of F for V1 = 6 And V2 = 30 is
greater the critical value of F at 5% level of significance, which
is 2.42, it may be inferred that there is a significant variation between the group studied.
Students t-test of significance: In order to further analyze the
significance of variation as shown by the analysis of variance, t-test of significance was used to [1] determine the significance of variation between two given groups and [2] to determine the significance of variation between Right and Left kidney of the same fetus. The calculated value of t was compared with the critical value of t, for a given degree of freedom at 1% level of significance. Table 7, gives the calculated t-value and also the degree of significance between different groups.
Table 7. Significance of difference between respective Age Group (t- test)
Groups I II III IV V VI VII
I -
II X -
III P <
O.001 P < 0.001
-
IV P <
O.001 P < 0.001
P < 0.001
-
V P <
0.001 P < 0.001
P < 0.001
P < 0.001
-
VI P <
0.001 P < 0.001
P < 0.001
P < 0.001
X -
VII P <
0.001 P < 0.001
P < 0.001
P < 0.001
P < 0.001
P < 0.001
-
X – Insignificant P<0.01 Significant P<0.001 Highly Significant
From the point of view of variation, it was found that only 5 out of the total number of fetuses taken showed significant variation. Table 8 given the list of specimens, in which some significant variation was found statistically. Critical value of t 0.001 for d.f. 118 is 2.62.
Table 8. Significance of difference between right and left kidney of the same fetus (t-test)
Group Specimen Number of glomeruli
per unit volume in
Calculated t value
Inference
Right Left
II 5.2 311.86 221.08 5.14 Significant
III 6.3 432.34 526.08 3.60 Significant
6.6 327.16 434.25 4.80 Significant
IV 10.1 372.88 322.31 2.81 Significant
10.2 378.25 286.42 4.60 Significant
4. The total number of glomeruli in each specimen was further statistically analyzed in the same manner in which the number of glomeruli per unit volume was done. Accordingly, the combined mean and combined standard deviation of each group as shown in table 9 was determined
Table 9. Total number of glomeruli in different gestational ages
Gestational age (weeks) Group Mean S.D.
16 I 294,890 9430
20 II 295,870 11860
24 III 660,484 23340
28 IV 1570,740 38060
32 V 1361,300 38970
36 VI 2247,183 21570
40 VII 2098,748 84150
Figure 2, shows a graphic representation of the average number of glomeruli in different gestational ages. It may be inferred from this figure that the number of nephrons in the fetal kidney do not show any significant increase from 12 to 20 weeks of gestational age. But after 20 weeks, there is a sudden increase up to 28 weeks, where after it does not change in the 32 weeks. However in 36 weeks, there is a tremendous increase again in the number of nephrons in the fetal kidney. After 36 weeks, there is no increase in the number, rather a slight decrease is observable.
Analysis of Variance
As stated earlier, this was used to determine the variability among the mean of the above mentioned seven groups (shown in Table 10).
Table 10.
Source of variation
Sum of square
of deviation D.f.
Mean of the square of deviation
Between sample 36814.03 6 6135.67
Within sample 8091.07 30 269.70
F – 6135.67/269.70 = 22.75
Since the calculated value of for V1 = 6 and V2 = 30 is greater
than the critical value of F at 5 of level of significance which is 2.42, it may be inferred that there is significant variation between the groups studied.
Student t-test of significance
In order to further analyze the significance of variation as showed that significant variation existed between groups, t-test was to determine.
The significance of variation between two groups and
The significance of variation between Right and Left kidney of a fetus.
The calculated value of t was compared with the critical value of t, for a given degree of freedom at 1% level of significance (shown in Table 11).
Table 11. Significance of variance in the total number of glomeruli at different gestational ages (t-Test)
Groups I II III IV V VI VII
I -
II X -
III P <
O.001 P < 0.001
-
IV P <
O.001 P < 0.001
P < 0.001
-
V P <
0.001 P < 0.001
P < 0.001
P < 0.001
-
VI P <
0.001 P < 0.001
P < 0.001
P < 0.001
X -
VII P <
0.001 P < 0.001
P < 0.001
P < 0.001
P < 0.001
P < 0.001
-
X…Insignificant P< 0.01 significant p < 0.001 Highly significant
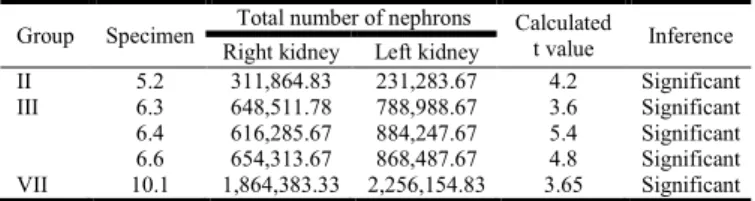
Like the number of glomeruli per unit volume, it was found here also that out of a total 18 fetuses only 5 showed some significant variation in the Right and Left kidney of the same fetus. Table 12 given a list of the specimen in which a significant Variation was found between two kidneys of a fetus.
Table 12. Significance of difference between right and left kidney of same Fetus
Group Specimen Total number of nephrons Calculated
t value Inference
Right kidney Left kidney
II 5.2 311,864.83 231,283.67 4.2 Significant
III 6.3 648,511.78 788,988.67 3.6 Significant
6.4 616,285.67 884,247.67 5.4 Significant
6.6 654,313.67 868,487.67 4.8 Significant
VII 10.1 1,864,383.33 2,256,154.83 3.65 Significant
Quantitatively, the numerical density and the absolute count of glomeruli shows a significant increase with the advance in gestational age.
DISCUSSION
glomeruli in the human kidney and found that it contained 800,000 to 1000,000 glomeruli. He also counted the nephrons in 1,3,6,9 year old children and concluded that similar number of nephron were found showing that there is no appreciable post natal nephrogenesis in man. But he found a senescent loss of glomeruli in man and said that the total count in 7th decade equals 2/3rd to ½ of adult count. He also compared the two kidneys of one individual and said that there are approximately equal number of glomeruli in both and Elias Henning and Flias (1967) estimated number of glomeruli in eight human kidney of ages varying from 6 months old baby to 47 years old man, by stereological methods. Total number of glomeruli estimated in a 6 month old child were 1,690,500 and 107,600 in a 19 month old infant. A 7 year old boy showed 1,155,00 glomeruli and in 47 years old man, number of glomeruli were found to be 1,309,000.Numerical density of glomeruli was found to be 109/c.mm. in the 6 month old child, 26.9/c.mm. in 19 month old infant, 20/c.mm in 7 year old boy and 11/c.mm. in 47 years old man. Thus he inferred, that adult number of glomeruli appear to exist in early infancy and no additional ones are formed from 6 months to adulthood. Also by comparing the density and size of glomeruli at various ages, it was found that as the person grows, kidney grows by increase of glomerular size and by growth in thickness and length of the tubules that saparat them.
Dunnil and Halley (Dunnil, 1973) and Elsenbrandt and Pbemister (Elsenbrandt, 1979) also used stereological procedure to study the post natal development of the canine and human kidney. Oathanondh and Potter (Oathanondh and Potter, 1966),used stereological method to determine the total number of glomeruli in kidneys of fetuses of varying gestational ages. They calculated number of nephrons in seven fetal kidney of varying gestational ages. An 18 m. m. embryo showed 20 renal vesicles, with no S forms. Beyond 20 weeks, he saw a steady increase in the number of nephrons which increased from 350,501 at 20 weeks of gestational age to 822,300 at 40 weeks of intrauterine life. In present study, numerical density of glomeruli in kidney and total number of glomeruli have been estimated in this study and result are found to differ from that of Osthanondh and Potter. Total number of glomeruli in kidney were seen to increase from 294,890 in the 16 weeks of gestational age to 2,098,748 in the 40 weeks. From 12 to 20 weeks, no significant increase was seen in the number of the nephrons, but after 20 weeks, there was a sudden increase up to 28 weeks. Where after it did not change much in the 32 weeks. In the 36 weeks again, there was a marked increase in the total number of nephrons, after which no increase was seen in the 40 weeks. Regarding the numerical density of the glomeruli, it was found to increase up to 28 weeks of gestation, following which it showed a gradual decrease up to 40 weeks. When the total number of glomeruli and numberical density of glomeruli in Right and Left kidneys of two fetuses were compared, significant variation was found to exist in five, out of total 21fetuses studied.
Thus, the growth and maturation of glomeruli are occurring in two phases. First in the 24 week and 28 weeks, which coincided with preparations for making the fetus viable by the end of 28 weeks month. The second phase of marked growth is in 36 weeks to 40 weeks, which prepares the fetus for the transition from the functionally immature fetal kidney to the functioning neonatal kidney. Growth of the kidney was occurring throughout prenatal life, but is more marked after 28 weeks. After this the numerical density of the glomeruli
decreases, in spite of an increase in total number of glomerli. This present study was to extend the knowledge of the human developing kidney by quantifying the changes in fetal kidney during nephrogenesis and the maturation of the nephron and by studying the relative growth of the nephron components during gestation. The knowledge about human fetal kidney development is still limited. Several studies emphasized the relation of the fetal kidney development, especially nephrogenesis and the adult renal diseases.
Conclusions
Numerical density of glomeruli per cubic m.m of kidney tissue was found to increase from 294.9 at 16 weeks gestational age to 430 in 28 weeks, but after 28 weeks a steady decline was seen up to 40 weeks when the density decreased to 339.9 .Except for the period between 16 week and 20 weeks and between 32 and 36 weeks. Significant variation was seen between different age groups. Total number of glomeruli were found to increase from 294,890 at 16 week to 295,870 at 20 weeks, 660,484 at 24 week and 1570,740 at 28 weeks of gestation. There was slight decrease in 32 weeks but again in 36 weeks number increased to 2,247,183.But during 40 weeks, it did not show any increase. Some variation was found in the two kidneys of all the fetuses but this was proved to be significant statistically in five, out of 42 kidneys studied. Thus, it was concluded that although new glomeruli were being formed up to 36 weeks of intrauterine life, pareuchymatous growth of the kidney occurred in two phases during 20-28 weeks to prepare the fetus to become viable and in 36 weeks and 40 weeks of intrauterine life to prepare for its transition from fetus to newborn. The current study was one of few quantitative studies of the human developing kidney. The knowledge about the age, related normal developing kidney stereological should be important for the future medical practice.
Acknowledgements
I thankful to staff of R.N.T. hospital and department of anatomy, department of pathology Pt .J.N.M. Medical college, Raipur (C.G.), India for their valuable cooperation during the entire research. I am grateful to my adorable parents late. Shree D.R. Mandavi, Smt. Durga Mandavi, and my lovable brother late Shree Rajesh Mandavi their blessing always inspiring me .I also thankful to authors/ editors /publisher of all those articles, journals.
REFERENCES
Behrman RE, Kliegman RM, Janson HB. 1995. Congenital Anomolies and Dysgenesis of the kidneys. In Nelson Textbook of Pediatrics; Saunders; 2004; pp1783-1784.ment-Urinary and Reproductive System. In Gray’s Anatomy; Churchill Livingstone, pp:174-192.
Dakovic – Bjelakovic M, Stefanovic N, Cukuranovic R,Antic S, Vlajkovic S. 1997. Renal tubular epithelium thickness of the cortical segment of the nephron tubular portion during human fetal kidney development. Folia Anatomica; 28(1):39-43.
Dodge AH. 1997. Review of microscopic studies on the fetal and neonatal kidney. Microsc Res Tech., 39(3):205-10. Dunnil and Halley, 1973. Some observation on the quantative
Elias Henning and P. Flias, 1967. Stereology of the human renal glomerulus: Quantitative Method in Morphology, 130-166.
Elsenbrandt D.L. and Pbemister R.D. 1979. Post natal development of canine Kidney. The American Journal of
Anatomy, 154(2).
Hinchliffe SA, Sargent PH, Howard CV, Chan YF, van Velzen D. 1991. Human Intrauterine Renal Growth Expressed in Absolute Number of Glomeruli Assessed by the Dissector Method and Cavalieri Principle. Laboratory Investigation. 64:777-784.
Kittleson J.A. 1917. Post natal growth of Kidney in albino rat, with observation on adult human kidney, Anatomical
record, 13,385.
Law CM, Shiell AW. 1996. Is blood pressure inversely related to birth weight? The strength of evidence from a systemic review of the literature. J Hypertens, 14(8); 935-41.
Marija Dakovic- Bjelakovic, Slobodan Vlajkovic; 2005. Quantitative analysis of the nephron during human fetal kidney development. Vojnosanit Pregi., 62(4): 281-286.
Moritz KM, Wintour EM. 1999. Functional development of the meso-and metanephros. Pediatr Nephrol., 13(20:171-8. Nyengaard Jr. 1999. Stereologic methods and their application
in kidney research. J Am Soc Nephrol., 10(5):1100-23. Oathanondh and Potter, 1966. Development of human kidney
as shown by microdissection IV formation of tubular portion of nephron, Archives of Patlahology, 82;403. Osathanondh V, Potter EL. 1963. Development of human
kidney as shown by microdissection. IV.1.Preparation of tissue with Reasons for possible misinterpretations of observations. Arch Pathol., 76:271-276.
Potter EL, Thierstein ST. 1943. Glomerular Development in the Kidney as an index of fetal maturity. J Pediatr, 22:695-706.
Speller AM, Moffat DB, 1977. Tubulo-vascular relationship in the developing kidney. J Anat., 123(2):487-500.
Tisher CC, Madsen KM. 1996. Anatomy of the kidney. In Brenner BM. The kidney. Philadelphia: W.B. Saunders company; p,3-71.