Munich Personal RePEc Archive
The Effectiveness of Development Aid for
Agriculture in Sub-Saharan Africa
Ssozi, John and Asongu, Simplice and Amavilah, Voxi
January 2018
Online at
https://mpra.ub.uni-muenchen.de/88530/
1
A G D I Working Paper
WP/18/020
The Effectiveness of Development Aid for Agriculture in Sub-Saharan
Africa
1Forthcoming: Journal of Economic Studies
John Ssozi Economics Department, Hankamer School of Business
Baylor University Waco, TX 76798, USA. E-mail: John_Ssozi@baylor.edu
Simplice A. Asongu Development Finance Centre,
Graduate School of Business,
University of Cape Town, Cape Town, South Africa E-mail: asongusimplice@yahoo.com
Voxi Amavilah REEPS, Arizona, USA E-mail: amavilah@msn.com
1
2
2018 African Governance and Development Institute WP/18/020
Research Department
The Effectiveness of Development Aid for Agriculture in Sub-Saharan Africa
John Ssozi, Simplice A. Asongu & Voxi Amavilah
January 2018
Abstract
Purpose: Agriculture is the major source of livelihood for the majority population in Sub-Saharan Africa but its productivity is not only low it has started showing signs of decline since 2012. The paper seeks to find out whether official development assistance for agriculture is effective.
Design/Methodology/Approach: The data for development assistance for agriculture are broken
down into the major agricultural sectors in receiving countries. The empirical evidence is based on the two-step system Generalized Method of Moments to assess the degree of responsiveness of agricultural productivity to development assistance.
Findings: There is a positive relationship between development assistance and agricultural productivity in general. However, when broken down into the major agricultural recipient sectors, there is a substitution effect between food crop production and industrial crop production. Better institutions and economic freedom are found to enable agricultural productivity growth, and to increase the effectiveness of development assistance. The structural economic transformation associated with agricultural development assistance is also found to be weak.
Practical Implications: Allocation of development assistance for agriculture is primarily determined by need, although expected effectiveness also increases the assistance receipts. Agricultural assistance policies could focus more on building productive capacity to reduce the need while boosting effectiveness.
Originality: Breaking down data into agricultural recipient sectors, and controlling for the potential spurious correlation under the assumption that more development assistance could be allocated where agricultural productivity is already increasing due to some other factors.
JEL Classification: F35; F50; Q10; O10; O55
3 1. Introduction
Previous research shows that agriculture plays a pivotal role in the development of the
Sub-Saharan Africa (SSA) as the major source of income, food, employment, and in its effectiveness
in reducing poverty. For instance, the African Development Bank Group (AfDB) Feed Africa
Strategy (2016) disclosed that in 2014 over 60 percent of the people in Africa lived in rural areas
and relied on agriculture for their livelihoods, and that women in Africa made up at least half of
the agricultural labor force (Dao, 2009). According to Mellor (2001), Dercon and Christiaensen
(2005), Christiaensen, Demery, and Kuhl (2010) growth in agriculture has a larger
poverty-reducing effect than growth in non-agricultural sectors, particularly among the households below
the poverty line. They find that both consumption and employment increase if households use
fertilizers to raise farm productivity. Others who find agriculture productivity growth to have a
greater effect on poverty reduction than industrial productivity growth include: Timmer (1999),
Ravallion and Datt (1999), and Dio, Hazell, Resnick, and Thurlow (2007). Despite its crucial
role in development, governments, donors, and foreign investors have underinvested in African
agriculture, and the sector continues to have low levels of productivity.
Until recently, especially over the 1980s and early 1990s, the volume and share of total
aid for agriculture was declining. The Food and Agriculture Organization of the United Nations
(FAO), reports that in 2014 donors provided only 5 percent of total development assistance to
projects in the Agriculture, Forestry and Fishing sector, down from 9 percent in the mid-1990s.
However, since 2001 there has been a renewed donor interest in agriculture, especially in Africa.
Using the median values for the period 2002-2015, Figure 1 demonstrates that official
development assistance for agriculture per worker (ODAAPW) for a typical SSA in our sample
4
per worker had been declining since 2012. Figures 1 and 2 further show that between 2002 and
2013, while sustaining a positive trend, ODAAPW was countercyclical: it increased when
agriculture value-added per worker (AVPW) decreased, but slowed down when AVPW
recovered. One possible explanation of the decline in agricultural value-added is that Africa has
been the last region to embrace the Green Revolution, resulting into the lowest adoption of
modern varieties of crops such as rice, wheat, maize, sorghum, cassava, and potatoes, which are
widely grown across the continent (Evenson and Gollin, 2003).
<Figure 1>
Some of the targets of the United Nations Sustainable Development Goals (SDGs) after
2015 are: ending hunger, achieving food security, improving nutrition, and promoting
sustainable agriculture. Due the underproduction of food in Africa relative to the population, the
AfDB Feed Africa Strategy predicts food imports by Africa to grow from US$35 billion in 2015
to over US$110 billion by 2025, while the number of the undernourished is projected to rise
from about 240 million in 2015 to 320 million by 2025. This raises several concerns one of
which is pointed out by Van Weezel (2016), who finds that food price increases are associated
with an increase in violence intensity of 1.3 incidents, an effect predominantly driven by imports
of low-value-added primary products. To achieve the SDGs goals there is need for a concerted
effort by both public and private agents. The Green Revolution in Asia was supported by
government interventions and subsidies. Even when some of these policies were distortionary,
as in the case where fertilizer subsidies reduced prices to 25 percent of their world market price,
they still pulled many Asian countries out of abject poverty (Gonzales, Kasryno, Perez,
5
However, policies to increase government investment in agriculture have been less
successful in SSA. The Maputo-Declaration (2003), required that nations of the African Union
allocate 10 percent of the total government budgetary resources to agriculture and rural
development. A report by the New Partnership for Africa’s Development (NEPAD) reveals that
only 9 of 44 countries had met the 10 percent target by 2013. Under the Malabo Declaration of
2014 the African Union member states recommitted to the 10 percent goal. Table 1 gives a
snapshot of the public investment in agriculture in SSA. The Agriculture Orientation Index for
Government Expenditure in Tab1e 1 is far less than 1.0, implying that governments in SSA are
generally giving far less prominence to agriculture than its contribution to the economy. An
index of 1.0 (or higher) suggests that governments are giving as much (more) prominence to
agriculture as (than) its contribution to the economy. For this reason the World Development
Report, Agriculture for Development (World Bank, 2007),and IAASTD’s (2009) Agriculture at a
Crossroad, both claim that agriculture has been neglected by governments as well as donors.
<Table 1>
Foreign Direct Investment (FDI) into agriculture is also very much limited. According to
Onyeiwu and Shrestha (2004), Cleeve (2008), Asiedu (2006, 2011), and Kolstad and Wiig
(2012), it is the abundance of natural resource endowments, particularly oil, not agriculture, that
attracts the most FDI flows into Africa. During the State of the Africa Region conference on
April 22, 2017, it was revealed that of the total FDI inflow to Africa only 0.04 percent goes into
agriculture – a percent that corroborates the FAO report that from 1997 to 2011, FDI inflows to
6
serious questions, because natural resources like oil booms tend to be associated with both Dutch
diseases (Benjamin, Devarajan, and Weimer, 1989; Davis, 1995; Torvik, 2001, Matsuyam, 1992;
Fardmanesh, 1991; Corden 1984) and competitive rent-seeking behavior (Krueger, 1974;
Krueger, Schiff, and Valdes, 1988).
In the light of the goals of the African Union, the ongoing underinvestment in the
agricultural sector, and the threat posed by low agricultural productivity per worker in Africa,
this paper seeks to find out whether the ODAAPW has been effective at increasing agricultural
productivity in SSA. Specifically, it asks and seeks to answer three closely related questions:
Question 1: Looking at the leading recipient sectors, is official development assistance for
agriculture helping to increase value added per work (productivity in SSA)? Question 2: Do
better institutions enable official development assistance for agriculture to be more effective in
SSA? Question 3: What are the key determinants of aid allocation, and do they engender any
structural transformation of the region? We start with these questions, because earlier studies
have examined with mixed results the role of foreign aid in general or aid to agriculture in
economic growth and poverty reduction (Kaya, Kaya and Gunter, 2012, 2013; Mavrotas, 2003,
2003; Clemens et al., 2012). Indeed, the link between foreign aid and economic growth a
recursive debate (Easterly, 2006; Moyo, 2009; Deaton, 2013). This paper contributes to the
debate in a number of ways, including the following four. First, we break down the official
development assistance (ODA) for agriculture per worker and focus on its proximate effect on
agriculture value-added per worker. We examine the leading ODA recipient sectors within
agriculture, and assess how they are contributing to agriculture value-added per worker. We are
7
depending on a number of other factors outside the agricultural sector, including the percent of
GDP originating from agriculture and rural population dynamics, for instance.
Second, since ODA is channeled through the government, we investigate whether
government effectiveness enables ODAAPW to be more effective. Some of the most commonly
cited factors in the literature that makes aid ineffective are corruption (Svensson, 2000; Asongu,
2012) and weak institutional quality of recipient countries (Burnside and Dollar, 2000; Asongu
and Nwachukwu, 2016). We also examine the effects of economic freedom on agricultural
productivity. Most of the agricultural production in SSA is by small-holder farmers whose
production choices are influenced by the business climate in addition to government policies.
Third, there has always been a debate about the empirical correlation between aid and
economic growth, and agricultural productivity. The association could be spurious if aid is
increasingly flowing into countries where agricultural productivity has been already increasing
as a result of another factor. We therefore investigate the assertion for any suggestive evidence
of whether official development assistance for agriculture is flowing into countries where
agricultural productivity is already improving for reasons other than effective aid programs. Is
agricultural ODA chasing success? An increasing flow of aid to countries where agricultural
productivity is already increasing would be a hidden form of ineffectiveness.
Fourth, since SSA economies are heterogeneous, their growth will inevitably involve
changes in the relative importance of the economic sectors. Hence we also assess the
effectiveness of ODA for agriculture via its structural change effect. The assessment is important
because majority of previous studies on the effectiveness of development assistance on economic
growth have used economic growth (i.e. per capita GDP or income for the most part) as the
8
Kargboand Sen, 2014; Gyimah-Brempongand Racine, 2014; Kumi et al., 2017). The paper
departs from this stream of literature by using the level of agricultural productivity for two
reasons. Previous research has conceived a national economy as consisting of three sectors:
Primary, secondary (industrial), and tertiary (services). We think of the primary sector as made
up of the agriculture, forestry, fishing, and mining parts. From here we first examine the effects
of ODA on the level of agricultural productivity, and secondly on whether such productivity
level is transformative. Transforming agriculture, to the extent most Africans depend on
agriculture for their livelihoods, has important implications for national development. We use
productivity level instead of productivity growth because growth in subject changing market
conditions and business cycles. Productivity level is an indicator of the standard of living and
efficiency. Growth can happen, but it is unsustainable in the long-run, without efficiency. The
rest of the paper is structured as follows. Section 2 provides theoretical highlights and reviews
recent literature. The data and methodology are covered in Section 3, while Section 4 presents
and discusses the results. We conclude in Section 5 with future research directions.
2. Theoretical highlights and brief literature
This section discusses three main strands of literature: (a) the theoretical underpinnings of the
relevance of development assistance; (b) contemporary foreign aid studies in the light of the
post-2015 development agenda; and (c) some recent agricultural literature on agro-allied
industrialization. We substantiate the three strands in a chronological order. First, the concern
about whether foreign aid has positive externalities on the development of recipient nations is
traceable to the two-gap model developed by Chenery and Strout (1966), which is one the most
influential theoretical foundations of the relevance of development assistance in the catch-up
9
developing countries are confronted with the lack of savings and “export earnings” may not be
appropriate for enhancing investment. Despite the apparent shortcomings underlying its
postulations, the model provided the basis for empirical papers on development assistance in the
past decades (Easterly, 1999; Masudand Yontcheva, 1999).In essence, the Solow- and
Harrod-Domar growth models allow for the idea that aid is necessary to stimulate investment and to
reduce inequality. These theoretical underpinnings are consistent with the need to reinvent
foreign aid for more inclusive and sustainable development (Asongu, 2016).
Second, the theoretical linkages between development assistance mechanisms and
development outcomes in poor countries are founded on some perspectives on the poverty
tragedy in Africa and on the effectiveness of foreign aid in boosting economic development
which have been documented by Asongu and Nwachukwu (2018). In response to the growing
poverty levels in Africa, Kuada (2015) has proposed a new development paradigm based on
shifting from “strong economics” of structural adjustments policies to “soft economics” of
human capability development. The conception of agriculture value-added per worker (AVPW),
which is a key notion in this study, is consistent with this paradigm shift as well as theoretical
proposition of Asongu and Jellal (2016) on channeling foreign aid through mechanisms that
decrease the tax burden borne by the private sector. It is also important to note that Kuada’s
(2015) ‘paradigm shift’ for elucidating development outcomes, reducing unemployment and
eliciting inclusive development is in accordance with a new stream of African development
literature which has focused on the reinvention of foreign aid to meet the challenges of
sustainable development goals (see Simpasa et al., 2015; Jones et al., 2015; Page and Söderbom,
10
Third, recent agricultural literature on agro-allied industrialization for development in
Africa has largely focused on inter alia: the effect of irrigation on food production (Nonvide,
2017); improving productivity via warehousing systems (Katunze et al., 2017); gender
differences among subsistence farmers and the willingness to undertake agribusiness (Coker et
al., 2017); the role of the female farmer entrepreneurs in poverty reduction (Nukpeza and
Blankson, 2017); multinationals in Africa’s food retail businesses (Nandonde and Kuada, 2017);
transmission of international food prices (or imported inflation)to African markets(Furceri et al.
2016; van Weezel, S., 2016; Fiamohe et al., 2015); the role of value chains in agricultural
business (Ndyetabula et al., 2016) and the composition of agricultural productivity (Mohamed et
al., 2016). Noticeably missing is that the literature on the nexus between foreign aid and
agriculture has not assessed whether ODA for agriculture and rural development is relevant in
increasing productivity in agriculture.
3. Data description and estimation methodology
Following De Janvry and Sadoulet (2016), a general production function for agriculture may be
specified as follows: � = � , , , where Y is agricultural output, A is total factor
productivity (technology) which is land saving and/or labor saving, K is capital, L labor, and N
is land. These factors of production represent the broadest channels through which official
development assistance (ODA) can be used to enhance agricultural productivity. The dataset is
made up of 36 SSA countries, covering the 2002-2015 time period2. The country sample is
determined by data availability, especially data on official development assistance (ODA) for
agriculture. The data for the leading recipient sectors in agriculture are sourced from the
2
11
Organization for Economic Co-operation and Development (OECD) Creditor Reporting System
(CRS) database. The key recipient sectors are: agricultural development, agricultural policy and
administrative management, food crop production, industrial crops or exports crops, agricultural
inputs, agricultural co-operatives, agricultural education or training per worker, and ODA for
rural development. All the ODA flows are real gross disbursements from all donors, and have
been converted into the recipients per worker in the agricultural sector. Table 2 reports the
summary statistics of the key variables.
<Table 2>
Again, figures 1 and 2 portray the key variables. As stated above, during this time period
there was a discernible upward trend in per worker agricultural value-added per worker, ODA
for agriculture per worker, and GDP per capita. However, the rate of increase was slow.
Moreover, GDP per capita rose and fell sharply during the 2003-2005 years. Agricultural value
added per worker peaked circa 2007, and recovered rapidly through 2013 before it collapsed
from there onwards. The collapse came after a decline in ODA per agriculture per worker with a
time lag of about two years. When the latter started to go up again, the former continued to fall,
which seems to suggest that agricultural value added depended on ODA for agricultural per
worker. However, ODA for rural development per capita experienced modest increases between
2006 and 2012, after which it fell to its initial levels. There appears to be a weak relationship
between GDP per capita and agricultural value added per worker on one hand, and between GDP
per capita and ODA for rural development on the other.
12
Figure 2 disaggregates ODA for agriculture by sectors of destination. The leading
agricultural sector recipients of ODA are: agricultural development per worker and agricultural
policy and administrative management. There have been modest increases in ODA for industrial
crop production and agricultural education. From about 2002 to 2012, agricultural value added
appears to be associated with ODA. What are the specific relationships among all these
variables? What explains the dramatic fall in agricultural value added even after ODA started to
increase again? The answers to these and similar questions motivated the results in tables 3-5.
The other control variables are: government effectiveness and control of corruption
extracted from the Worldwide Governance Indicators. Since ODA is mostly channeled through
the government, the governance indicators capture the extent to which public institutional quality
can enhance or cripple policy interventions. At the same time, the effectiveness of ODA does not
depend only on the public institutions, it is also affected by a country’s business climate. We use
the following components of economic freedom from the Heritage Foundation to examine the
quality of business climate: business freedom, trade freedom, tax burden, and property rights.
Urban population percent of the total population and the GDP per capita are included in the
structural transformation regression, where the former controls for demographic changes. These
variables are obtained from the World Development Indicators to control for the level of
economic growth.
Islam (2011) provides a comprehensive factual and analytical review of foreign aid for
agriculture for the 1970-2008 time period. A key observation from the review is that foreign aid
to industrial production, and agriculture, forestry and fishing have declined since 1980. Aid to
industry, mining and construction has been trending downwards from 1973 onwards.
13
beginning 2005. Islam gives five reasons for the decline: One, there has been change in the
international consensus over the strategy for poverty reduction. The new understanding is that
support to agriculture is but one way of reducing poverty. Among others is aid to the social and
physical infrastructure in rural areas. Two, new demands brought about by special events like
conflicts have pulled foreign aid to non-development uses such humanitarian assistance. Three,
project in completions and inefficiencies have created a disincentive among donors. Four,
institutional changes have benefitted different sectors differently so that some donors tend to aid
success than need. Finally, aid for agriculture has generally declined as the share of agricultural
output to GDP has fallen.
Islam’s study informs this paper greatly except in two important respects. First, it
focuses on total (bilateral and multilateral) foreign aid. We concentrate on ODA for agriculture.
Islam also assumed rising agricultural productivity, which is not always the case in SSA.
Therefore, we use the two-step system Generalized Method of Moments3 (Arellano and Bond,
1991; Arellano and Bover, 1995; Blundell and Bond, 1998; Roodman, 2009ab) to estimate the
association between ODA for agriculture and agriculture value-added per worker in equation (1).
3
14
ln � � � =
∑�= ln � � �−� + ∑ = ln � � �− + ∑ = ln � �� �− + +
�
E[ ] = [ �] = [ �] = , (1)
where agvapw stands for the agriculture value-added per worker, � � is the total ODA for
agriculture; � �� is the ODA for rural development; are the unobserved
time-invariant country-specific effects, and εit are the observation error terms. Total ODA for
agriculture is further broken down into the leading recipient sectors to find out what sectors have
a significant effect on agriculture value added per worker. Given the underinvestment in
agriculture one would expect that both ODA for agriculture and for rural development would
increase agricultural productivity. However, since most of this ODA is channeled through the
government, corruption and government ineffectiveness can choke it. We use equation (2) to
assess the effect of ODA controlling for government effectiveness (goveff) and the country score
on control of corruption.
ln � � � =
∑�= ln � � �−� + ∑ = ln � � �− +
∑ = ln � �� �− + ln � + ln � � ∗ ln �+ +
�. (2)
We control for government effectiveness both directly and indirectly. We also exogenously split
the data into two using the median values of government effectiveness, and run two regressions
15
when government effectiveness is above the median value. If the quality of institutions affects
the effectiveness of ODA, one would expect the second regression to have a more significant
positive effect than the first.
There has always been a debate about a possibly hidden ineffectiveness of ODA. It is
often assumed that donors want to allocate ODA to places where the need is greatest, but also
where it is likely to be effective in reducing a problem. For instance, conflict areas have the
greatest need, but the unrest makes ODA very ineffective. On the other hand, allocation of ODA
to politically stable regions, with improving institutions, is likely to be a lot more effective even
when they don’t have the greatest need. Which of the two wins more ODA: Need or
effectiveness? If effectiveness wins, then ODA would correlate with unobservable factors that
affect agricultural productivity. The GMM estimation technique is one way of addressing that
endogeneity. In order to unmask the possibility of hidden ineffectiveness we seek to find out
whether ODA for agriculture is either negatively associated with more need or is positively
associated with unobserved factors that increase agriculture value-added per worker irrespective
of aid. We model equation (3) with ODA for the future period as the dependent variable, and
volatility in agricultural productivity as the primary independent variable. This specification can
give us two insights: One, about endogeneity4. Two, about the determinants of ODA allocation
for agriculture.
ln � � �+ = ln � � �+ ln � � �� ��� � �+ ln � � � +
ln � � �� ��� � �×ln � � � + + � (3)
4
16 4. Estimation results and discussion
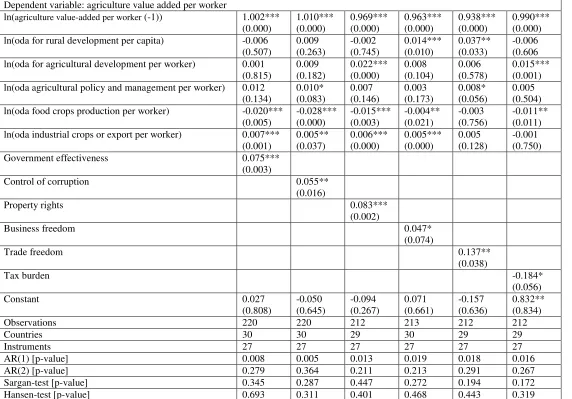
Table 3 reports results from a number of regressions of agriculture value-added per worker on
ODA for agriculture. The statistical significance of lagged agriculture value-added per worker is
quite high, indicating persistence in agricultural productivity. For example, agricultural value
added, lagged by one year, has a marginal impact on current year agricultural value added of
1.033, implying a long-run multiplier of 33.33 [= 1/ (1-1.033)]. Ceteris paribus, agricultural
value added is inelastic with respect to agricultural aid per capita. This finding is similar but of
opposite sign to that obtained by Alabi (2014) most likely because the latter considered all aid,
not ODA for agriculture as such. Similarly, in absolute terms, the coefficient of elasticity of
agricultural value added relative to ODA for rural development per capita lies between 0.009 and
0.016. Across all the regression results, ODA has a statistically significant elasticity with respect
to agriculture value added. The response of agricultural value added to ODA for agricultural
development per worker, currently and lagged by one year, ranges from -0.02 to +0.02.
<Table 3>
A number of important results stand out from table 3: First, ODA agricultural policy and
administrative management have a positive effect on agricultural productivity. The implication
of this finding is that aid policy and management influence aid effectiveness (Whitfield and
Maipose, 2008). The second interesting finding is that agricultural productivity responds
negatively to ODA for food crop production and positively to ODA for industrial (export) crop
production, a substitution effect that favors the latter. This is a little complicated as ODA can
both be a limiting and an enabling factor. ODA taxes (limits) food crop production and
17
and the resource re-allocation it engenders are likely huge. However, these results are consistent
with existing literature (Eicher, 2003; Carlsson, Somolekae, and van de Walle, 1997), and can be
demonstrated practically (see Islam, 2011 for practical examples). Theoretically, if aid
negatively affects the price of domestically produced food crops by � , then it essentially
increases the marginal cost of food crop production ( � ), and thereby reducing profit from
food crop production ( � ), such that
� = � + � + � = − � = � + � ⇒ � = ���+ ��
−� , < < , (4)
which suggests that as α increases, � increases, and the quantity demanded of domestically
produced food crops declines, compelling consumers to shift demand to industrial (export) crops.
A higher demand for export crop motivated industrial crop production but discouraged the
domestic supply of food crops. In other words, people ultimately consume what they do not
produce, and also produce very little or nothing to export – the roots of food aid dependency.
Even though policy and management favor agricultural productivity, and the effects of aid for
industrial agricultural production are both positive and larger than those of aid for food crop
production, one can infer competition for aid between the two sectors. Third, the inclusion of aid
for cooperatives and agricultural development is clarifying, but the coefficients of these variables
are unstable and switch arithmetic signs. It is also interesting to find that when we control ODA
for agricultural cooperatives, ODA for agricultural development also attains a consistently
positive effect without a lag. Hence, it is reasonable to assume that these variables affect
agricultural value added positively, at least on the internal margins. Cooperatives can play roles
of supply, marketing, and processing (add-value) to boost profitability. They provide an
18
resources, information dissemination, higher bargaining power, and access to credit, all of which
reduce transaction costs. This implies that institutional settings surrounding aid policy and
management, as well as aid application (use) are critical for agricultural productivity. Fourth,
contemporaneous ODA for agricultural inputs constrain agricultural productivity, but the
constraint is released within a year. It appears that this type of ODA responds to current year
poor yields. Better planning and education would avoid this lag by keeping records of when
inputs such as fertilizers ought to be renewed. When modeling China’s agriculture support
policy effects, He (2016) finds that input subsidy policy has more effects on production while
area payment policy has more effects on farmer’s income.
<Table 4 (a)>
<Table 4 (b)>
Tables 4(a) and 4(b) present estimates of the role institutions play in agricultural
productivity. Table 4(a) examines whether government effectiveness can enhance the impacts of
ODA on agricultural labor productivity in SSA. We control for three levels of government
effectiveness as a measure of the quality of institutions (governance): baseline, below median
value of government effectiveness (< -0.73), and above median value (>-0.73).In the baseline
scenario, a percentage rise in government effectiveness strengthens the impact of ODA on
agricultural valued-added per worker by up to 18.5%, and by 10.2% in the above, and baseline
scenarios, respectively. However, when government effectiveness is below the median value of
effectiveness, it has no significant effect. The findings are consistent with Brautigam and Knack
19
mention only few. The baseline equation with an interaction between government and total
ODA gives inconclusive results. Even so, since government effectiveness is positive, for the
interaction term to have a negative effect it would be the case that aid has a negative effect.
Conversely, when government effectiveness is above the median value, the interactive term has a
positive coefficient, implying that ODA is more effective in countries where government
effectiveness is high. Clearly ODA flows through government. Just as clearly, other
institutional factors and forces are important as well. In table 4(b) we use the breakdowns of
ODA, government effectiveness, control of corruption, and various components of economic
freedom. The components of economic freedom included are: property rights, business freedom,
trade freedom, and tax burden, all obtained from The Heritage Foundation. Again, we find
suggestive evidence that better institutions and economic freedom contribute towards agricultural
development, while the tax burden is an obstacle. A one percent improvement in property rights,
business freedom, and trade freedom increases agricultural productivity by 8.3%, 4.7%, and
13.7%, respectively. Thus, it is trade, rather than aid, that drives agricultural productivity.
These findings confirm conventional wisdom. According to Schultz (1964), for instance,
many farmers remain poor not because they are backward and traditional, but because their
governments do not provide them enough technical and economic possibilities. Schultz
emphasized the importance of making available to farmers inputs and extension services through
which information regarding new technologies can be disseminated. He also argued that peasants
in poor countries are rational decision makers (responding to incentives) who maximize the
returns from their resources in accordance with the institutional policies. For instance, the
unwillingness to innovate observed in developing economies was rational because governments
20
reduced farmers’ incentive to produce by lowering profits. Hence, by extension, one may say
that the lack of marketing opportunities and infrastructures makes farmers choose to produce
small quantities.
Aware of the potential endogeneity between ODA, agricultural productivity, and
unobservable factors affecting the effectiveness of ODA, we explore the allocation process. If
ODA is more driven by need, it might flow more to low productivity areas even when
effectiveness might be low. Under this scenario the effectiveness of ODA might be veiled. On
the other hand, if donors want to boost agricultural productivity, then ODA would flow mostly to
countries where it is likely to be more effective regardless of the level of the relative need for
ODA. Hence, our next question is: What determines the allocation of ODA? Is ODA flowing to
countries where it is more likely to achieve success, or where the need is greatest? Is ODA
flowing to countries where agriculture value-added is already increasing due to some other third
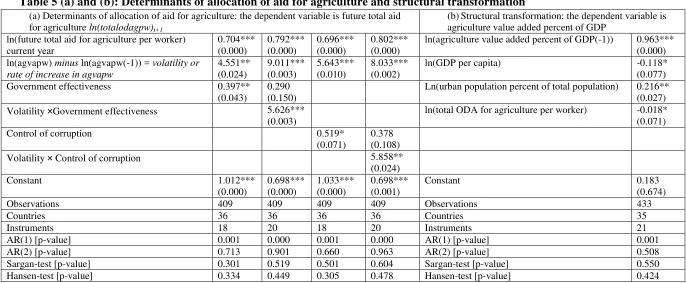
factor? Panel (a) of table 5 addresses the question of ODA allocation, while the GMM
techniques dealt with the issues of potential endogeneity. The two variables of interest are the
rate of increase in agricultural value-added per worker and government institutions.
< Table 5 (a) and (b)>
First, the results show that future ODA for agriculture will go where agricultural
productivity is increasing, and that the higher the productivity increase the more ODA.
Assuming a standard production function for agriculture with diminishing marginal returns, the
marginal product of ODA is higher at lower levels of output than at higher levels. Consequently,
21
is low, that is, where the need for ODA is also highest. Second, there is suggestive evidence that
ODA for agriculture goes where government institutions are increasingly effective. Third, we
find that countries where institutions are increasingly effective, also increase the extent to which
the rate of increase in productivity attracts more aid. Need is not estranged from effectiveness.
However, in and of themselves, institutions are a weak determinant of how much agricultural
ODA a country will receive. Therefore, need and effectiveness, together, are the strongest
determinants of ODA allocation. ODA allocation to areas in need has a strong marginal impact
on agricultural value added per worker that falls between 4.55 and 9.01 percentage points, and
capable of increasing by approximately 6 percentage points under better government
effectiveness. Unfortunately, in SSA poor people live in rural areas, and it is precisely in these
areas where ODA has negative substitution effects on agricultural labor productivity between
food crop production and industrial (export) crop production. The history of total ODA for
agriculture per worker, and of agricultural labor productivity is important for ODA allocation
(see Islam, 2011). This result lines up well with previous studies: one, Moore and Stanford
(2010) find that the two top determinants of food aid dependence were cereal production and the
frequency of droughts. Two, in a study of German trade with and aid to Namibia, Amavilah
(1998) found that colonial associations favor foreign aid even though the effects of aid on labor
productivity are lower than those of both trade and domestic capital formation. The unexplained
effects (constant terms) are significant but small, implying that the volatility of agricultural
output (need) and government institutions are the key determinants of how much ODA a country
receives.
We end this part of result discussion upholding that ODA does indeed affect agricultural
22
illustrative example. In the example, structural transformation is assessed using agriculture value
added as a percent of GDP, that is, the relative importance of agriculture to the economy. We
examine what happens to agriculture value-added percent of GDP as ODA for agriculture per
worker increases. First, we find that agriculture value-added percent of GDP is inversely related
to increases in ODA for agriculture per worker. This is a natural result because structural
transformation in developing countries often begins with an increase in agricultural output per
worker creating a surplus in the rural economy, which is progressively transferred into the
nonagricultural sectors. We have already established that ODA increases agricultural
value-added per worker. Second, as economies grow (as GDP per capita increases) agriculture
becomes less dominant, and its share of both GDP and employment declines (Islam, 2011).
Hence, GDP per capita is inversely associated with agriculture value-added percent of GDP.
According to Engel’s law, the proportion of income spent on food declines as income rises
(Baffes and Etienne, 2016). This implies that income grows faster than demand for food,
resulting into a decline in agriculture as a share of national income. This result provides further
suggestive evidence that structural transformation is taking place in SSA. The above two effects
go hand in hand, implying that to be sustainably effective, ODA requires economic growth. Even
if one were to argue that under some conditions economic growth might require assistance to
ignite it, as it was the case for the Marshall Plan for Europe after WWII.
In the structural transformation regression in Table 5(b), we also find that urban
population growth positively affects agriculture value added as a percent of GDP. Within the
framework of structural transformation, this is an unnatural result. Since urbanization in the SSA
is mostly driven by rural-urban migration, the loss of youthful farm labor could have had a
23
than the rate of decline in agricultural output. Second, as the urban sector grows one would have
expected the share of agriculture to GDP to decline given that nonagricultural urban incomes are
generally expected to be higher than the farm (rural) incomes. However, urbanization can have a
positive income effect as it increases the market for agricultural output. It appears that the
positive market-income effect outweighs the negative labor-resource (substitution) effect. This is
a confounding outcome, because it means aid adds to the market income of urban dwellers but
subtracts from the already meager market income of rural people. Consequently the former’s
money income increases; the latter’s money income decreases, where money income is the
income required to meet basic needs and is the sum of market income plus government transfers
including aid.
Third, according to the African Development Report (2015) the pattern of structural
transformation in Africa is different from the classical pattern of transitioning from agriculture,
manufacturing, to knowledge based services. In Africa, labor that is moving out of agriculture
and rural areas is not primarily absorbed into manufacturing industries and high-skill services,
but is mostly absorbed into low-skill services and informal urban activities whose level of
productivity is low than in agricultural sector. Historically governments in SSA, as in other
developing areas, have closed the gaps by enlarging the tertiary sectors, creating huge deficits
which they then financed with debt, aid, or both. Hence, other things constant, in the SSA, for
our sample and time period, in and of itself urbanization is not significantly increasing the
nonagricultural incomes relative to the farm-rural incomes. Baffes and Etienne (2016) show that
income influences real food prices mainly through the manufacturing price channel; a result
which is consistent with both Engel’s law and Kindleberger’s thesis. Fourth, if there is an inverse
24
relationship between agriculture value added percent of GDP and urban population growth, in
the event that the growth rate of urban population is higher than the growth rate of the economy,
the inevitable outcome is negative transformation in rural areas (implied by the substitution
effects we described above) and by the hardship in urban areas (indicated by life in shanty
towns).
5. Conclusion and future research directions
This paper has assessed whether the official development assistance (ODA) for
agriculture and rural development are helping to boost agricultural productivity in 36
sub-Saharan African countries for the period 2002-2015. The empirical evidence is based on a
system two-step Generalized Method of Moments. It finds that across all regressions presented
in Tables 3-5, summary statistics are reasonable; the regressions are well-estimated, and the
estimates are as efficient as possible. It is understandable that some estimates may be biased,
especially in light of the small sample and a short study period. This weakness represents one
future research opportunity. For now, the results show that ODA is neither an automatic panacea
nor an immutable curse (constraint). Its effects vary across areas receiving it, and those likely
differ within and across individual countries in SSA. Many factors determine the allocation of
ODA; in this paper we identified “need and effectiveness” as the joint determinant of allocation.
Areas that need ODA do indeed get aid, but the allocations are higher if the anticipated
effectiveness is high. Unfortunately, the substitution effects discussed above make ODA for
rural agricultural development damaging to the very same people it was supposed to help, and
most people in SSA live in rural areas and depend primarily on agriculture for their livelihoods.
25
rural households substitution effects are greater than income effects, except that there are no
substitute. This is simply an indirect characterization of poverty. Here, too, we find ourselves in
agreement with Islam’s (2011) assertion that “the task of measuring, analyzing, and evaluating
aid to agriculture in all is components, principles and implications remains a challenging task for
researchers, policy analysts and policy makers” (p. 41). Moreover, other determinants of
agricultural productivity such as agricultural research and effects of climate change to
productivity are fruitful areas for future research.
While success, like “beauty [that] is in the eyes of the beholder,” is subjective in that one
cannot tell a starving man to refuse a free meal, the movement to urban areas gives a false
impression of structural transformation of agriculture in SSA. The feedback effects in terms of
the negative association from ODA for food crop production and increased “squalor”
urbanization, and both seriously question the effects of ODA on economic growth and
development in SSA – a critical comment on Lewis’s model of “development with unlimited
supply of labor” which we do not pursue in this paper. We tentatively conclude that not all ODA
is an effective mechanism for structural transformation of agriculture in SSA. In fact, structural
transformation would require sustained and sustainable growth as well as effective institutions
for policy, management, and use of ODA.
While the paper only considers ODA for agriculture and rural development, ODA to
other sectors can have an indirect effect on agricultural productivity. For example, ODA to the
infrastructure and the industrial sector can facilitate pulling workers from the agricultural sector
to the industrial sector. Moreover, with limited supply of land, fewer workers on the land can by
itself improve agricultural productivity. Although we do not control for the indirect of
26
industrial sector and infrastructure facilitates worker migration to the industrial sector, but the
improvement in the agricultural sector is more than offset by the negative effect of jobless
urbanization. This is one of the reasons we point to the larger substitution than income effects of
ODA. Second, some of the effects of non-agricultural ODA are likely reflected in the constant
term and in rural development ODA. Future studies should focus on the extent to which different
components of ODA can be correlated and how the established findings withstand empirical
27 References
Alabi, R.R. (2014), “Impact of agricultural foreign aid on agricultural growth in Sub-Saharan
Africa: A dynamic specification”, working paper, AGRODEP 006, July. http://www.iwim.uni-bremen.de/Siakeu/AGRODEPWP.pdf. Accessed on 08/29/2017.
Amavilah, V.H. (1998), “German aid and trade versus Namibian GDP and labor
productivity”,Applied Economics, Vol.3 No.5, pp. 689-695.
African Development Report. (2015), “Growth, Poverty and Inequality Nexus: Overcoming Barriers to Sustainable Development”, African Development Bank, Côte d’Ivoire:148.
Arellano, M., and Bond, S. (1991), “Some tests of specification for panel data: Monte Carlo evidence and an application to employment equations”, Review of Economic Studies, Vol.58, pp. 277-297.
Arellano, M., and Bover O. (1995), “Another look at the instrumental variable estimation of error-components models”, Journal of Econometrics, Vol.68: 29–51.
Asiedu, E. (2006), “Foreign direct investment in Africa: The role of natural resources, market size, government policy, institutions and political instability”, The World Economy, Vol. 29 No.1, pp.63-77.
Asiedu, E. (2014), “Does Foreign Aid in Education Promote Economic Growth? Evidence From
Sub-Saharan Africa”, Journal of African Development, Vol.16, No.1, pp. 37-59.
Asiedu, E., and Lien, D. (2011), “Democracy, foreign direct investment and natural resources”,
Journal of international economics, Vol.84 No.1, pp.99-111.
Asongu, S. A. (2012), “On the effect of foreign aid on corruption”, Economics Bulletin, Vol.32 No.3, pp. 2174-2180.
Asongu, S. A. (2016), “Reinventing Foreign Aid for Inclusive and Sustainable Development: Kuznets, Piketty and the Great Policy Reversal”, Journal of Economic Surveys, Vol.30 No.4, pp. 736–755.
Asongu, S. A., and Jellal, M. (2016), “Foreign aid fiscal policy: theory and evidence”,
Comparative Economic Studies, Vol. 58 No. 2, pp.279-314.
Asongu, S.A,andNwachukwu, J. C. (2016), “Foreign aid and governance in Africa”,
International Review of Applied Economics, Vol. 30 No. 1, pp. 69-88.
Asongu, S. A., andNwachukwu, J. C. (2017), “Quality of Growth Empirics: Comparative
28
Asongu, S. A., and Nwachukwu, J. C. (2018), “Increasing Foreign Aid for Inclusive Human Development in Africa”, Social Indicators Research. DOI: 10.1007/s11205-017-1668-3.
Baffes, J. and Etienne, X, L. (2016), “Analysing food price trends in the context of Engel’s Law and the Prebisch-Singer hypothesis”, Oxford Economic Papers, Vol. 68 No. 3, pp. 688– 713.https://doi.org/10.1093/oep/gpw011
Benjamin, N.C., Devarajan,S. and Weiner, R.J. (1989), “The Dutch disease in a developing country: Oil reserves in Cameroon”, Journal of Development Economics, Vol. 30, pp. 71-92.
Blundell, R., and Bond, S. (1998), “Initial conditions and moment restrictions in dynamic panel data models”, Journal of Econometrics, Vol.87, pp. 115-143.
Brautigam, D.(2013), “Chinese development aid in Africa: What, where, why, and how
much?” https://deborahbrautigam.files.wordpress.com/2013/04/2011-brautigam-chinese-aid-in-africa.pdf. Accessed on 8/3/2017.
Brautigam, D., and Knack, S. (2015), “Foreign aid, institutions, and governance in Sub-Saharan Africa”, Economic Development and Cultural Change, Vol. 52 No. 2, pp.255-285.
Brookings Institution. (2013), New actors in international development: The case of China in Africa. A trilateral dialogue on the United States, Africa, and China. Conference Pare 1 and Responses. https://www.brookings.edu/wp-content/uploads/2016/07/All-China-Aid-Papers-2.pdf. Other papers in this series https://www.brookings.edu/research/a-trilateral-dialogue-on-the-united-states-africa-and-china/. Accessed 7/31/2017.
Burnside, C., and Dollar, D. (2000), “Aid, Policies, and Growth”, The American Economic Review, Vol. 90, pp. 847–868.
Carlsson, J., G. Somolekae, and N. van de Walle (eds). (1997), Foreign aid in Africa: Learning from country experiences. NordiskaAfrikainstitutet.
Chenery, H. B., and Strout, A. M. (1966), “Foreign Assistance and Economic Development”,
American Economic Review, Vol. 56, pp. 679-733.
Christiaensen, L.J., Demery, V. andKuhl, J. (2010), “The (evolving) role of agriculture in poverty reduction – an empirical perspective”, Journal of Development Economics, Vol. 96, pp. 239–254.
Cleeve, E. (2008), “How effective are fiscal incentives to attract FDI to Sub-Saharan Africa?”,The Journal of Developing Areas, Vol. 42 No. 1, pp. 135-153.
29
Coker, A. A. A., Akogun,E. O. , Adebayo, C.O., Mohammed, S., Nwojo,M., Sanusi, H, and Jimoh, H O. (2017), “Gender Differentials among Subsistence Rice Farmers and Willingness to undertake Agribusiness in Africa: Evidence and Issues from Nigeria”, African Development Review, Vol. 29 (Special Issue), pp.198–212.
Corden, W.M. (1986), “Booming sector and Dutch disease economics: Survey and consolidation”, Oxford Economic Papers, Vol. 36 No. 3, pp. 359-380.
Davis, G. (1995), “Learning to love the Dutch disease: Evidence from the mineral economies”,
World Development, Vol. 23 No. 10, pp.1765-1779.
Dao, M.Q. (2009), "Poverty, income distribution, and agriculture in developing countries",
Journal of Economic Studies, Vol. 36 Issue: 2, pp.168-183. https://doi.org/10.1108/01443580910955051
Deaton, A. (2013), The Great Escape: Health, Wealth and the Origins of Inequality. Princeton, NJ: Princeton University Press.
Dercon, S., and Christiaensen, L.J. (2005), “The Impact on Poverty of Policies to Stimulate Modern Input Adoption: The Case of Fertilizer in Ethiopia”. Mimeo, World Bank, Washington, DC.
Dethier, J.J., and Effenberger, A. (2012), “Agricultureanddevelopment:abriefreviewof the literature”, Economic Systems, Vol. 36 No. 2, pp. 175–205.
Diao, X., Hazell, P., Resnick, D., and Thurlow, J. (2007), “The role of agriculture in development: Implications for Sub-Saharan Africa”, IFPRI Research Paper No. 153.
Easterly, W. (1999), “The Ghost of Financing Gap: Testing the Growth Model Used in the International Financial Institutions”, Journal of Development Economics, Vol. 60, pp. 423-438.
Eicher, C. K. (2003), “Flashback Fifty years of donor aid to African agriculture”. Conference Paper No. 16 (December). https://rmportal.net/framelib/donor-aid-to-african-agriculture.pdf. Accessed 8/3/2017.
Easterly, W. (2006), The White Man’s Burden: Why the West’s Efforts to Aid the Rest Have Done So Much Ill, and So Little Good. New York: Penguin Press.
Evenson, R.E., and Gollin, D. (2003), “Assessing the impact of the green Revolution, 1960-2000”, Science, Vol. 300 No. 5620, pp. 758-762. DOI: 10.1126/science.1078710
Fardmanesh, M. (1991), “Dutch disease economics and oil syndrome: An empirical study”
30
Feed Africa-Strategy for agricultural transformation in Africa 2016-2025. African Development Bank Group (2016)
Fiamohe, R., Alia, D.Y., Bamba,Y., Diagne, A., and Amovin-Assagba, E. (2015),“Transmission of Rice Prices from Thailand into West African Markets: The Case of Benin, Mali, and Senegal”,
African Journal of Economic and Management Studies, Vol. 16 No. 1-2, pp.128-143.
Food and Agriculture Organization of the United Nations (FAO) http://www.fao.org/economic/ess/investment/expenditure/en/
Furceri, D., Loungani, P., Simon, J., and Wachter, S.M. (2016), “Global food prices and domestic inflation: some cross-country evidence”, Oxford Economic Papers, Vol. 68 No. 3, pp. 665–687.https://doi.org/10.1093/oep/gpw016
Gonzales, L.A., Kasryno, F., Perez,N.D. , and Rosegrant, M.(1993). Economic incentives and comparative advantage in Indonesian food crop production. In: Research Report 93, IFPRI, Washington, DC.
Gyimah-Brempong, K., and Racine, J. S. (2014), “Aid and Economic Growth: A Robust
Approach”, Journal of African Development, Vol. 16, No.1, pp. 1-35.
He, S. (2016), "Modeling China’s agriculture support policy effects", Journal of Economic Studies, Vol. 43 No. 5, pp.763-779, https://doi.org/10.1108/JES-05-2015-0071
Islam, N. (2011), “Foreign aid to agriculture: Review of facts and analysis”, International Food
Policy Research Institute. IFPRI Discussion Paper 01053,
file:///C:/Users/Tamara/Downloads/124881%20(1).pdf. Accessed on 08/29/2017.
Jones, S., Page, J., Shimeles, A, and Tarp, F. (2015), “Aid, Growth and Employment in Africa”,
African Development Review, Vol. 27 No. S1, pp. 1-4.
Kargbo, P. M., and Sen, K., (2014), “Aid Categories that Foster Pro-Poor Growth: The Case of
Sierra Leone”, African Development Review, Vol. 26, No.2, pp. 416-429.
Katunze, M., A. Kuteesa, D. Mijumbi, and D. Mahebe, D. (2017). “Uganda Warehousing Receipt System: Improving Market Performance and Productivity”, African Development Review, Vol. 29 No. S2, pp. 135-146.
Kaya, O., Kaya, I., and Gunter, L. (2012), “Development Aid to Agriculture and Economic Growth”, Review of Development Economics, Vol. 16 No.2, pp. 230–242.
Kaya, O., Kaya, I., and Gunter, L. (2013), “Foreign Aid and the Quest for Poverty Reduction: Is
Aid to Agriculture Effective?” Journal of Agricultural Economics, Vol. 64 No. 3, pp. 583–596.
31
Krueger, A.O., Schieff, M., and Valdes, A. (1988), “Agricultural incentives in developing countries: Measuring the effect of sectoral and economywide policies”, World Bank Economic Review, Vol. 1 No. 3, pp. 253-271.
Kuada, J. (2015). “Private Enterprise-Led Economic Development”, in J. Kuada (Ed.), Sub Saharan Africa The Human Side of Growth, Palgrave Macmillan: New York.
Kumi, E., Ibrahim, M., andYeboah, T., (2017), “Aid, Aid Volatility and Sectoral Growth in Sub
-Saharan Africa: Does Finance Matter?”,Journal of African Business, Vol. 18, No.4, pp. 435-456.
Mellor, J.W. (2001). Faster more equitable growth – agriculture, employment multipliers and poverty reduction. Agricultural Policy Development Project Research Report 4, Cambridge, MA.
Masud, N., andYontcheva, B. (2005), “Does Foreign Aid Reduce Poverty? Empirical Evidence from Nongovernmental and Bilateral Aid”, IMF Working Paper, No. 05/100, Washington, D.C.
Mavrotas, G. (2002), “Aid and Growth in India: Some Evidence from Disaggregated Aid Data”,
South Asia Economic Journal, Vol. 3 No. 1, pp. 19-48.
——— (2003), “Assessing Aid Effectiveness in Uganda: An Aid-disaggregation Approach”, Report tothe UK Department for International Development, London.
Mohamed, A. A., Rangkakulnuwat, P., and Paweenawat, S.W. (2016), “Decomposition of agricultural productivity growth in Africa”, African Journal of Economic and Management Studies, Vol. 7 No 4, pp. 497-509.
Moore, W., and Stanford, S.(2010), "Why do some countries have a long‐term dependence on food aid?",Journal of Economic Studies,Vol. 37No. 4, pp.438-454, https://doi.org/10.1108/01443581011073426
Moyo, D. (2009), Dead Aid: Why Aid is notworking and how there is a better way for Africa. New York: Farrar, Straus and Giroux.
Nandonde, F. A., andKuada, J. (2017), “International firms in Africa’s food retail business-emerging issues and research agenda”, International Journal of Retail & Distribution Management, Vol. 44 No. 4, pp. 448-464.
Ndyetabula, D. W., Sørensen,O.J. ,and Temu, A. A. (2016), “Agribusiness development and the role of value chain business associations: The case of dried fruits and vegetables in Tanzania”,
African Journal of Economic and Management Studies, Vol. 7 No. 4, pp. 510-534.
NEPAD. 2013. Agriculture and Food Security 2013 Report. CAADP
Nonvide, G. M. A. (2017), “Effect of Adoption of Irrigation on Rice Yield in the Municipality of
32
Nukpezah, J. A. and Blankson, C. (2017), “Microfinance Intervention in Poverty Reduction: A Study of Women Farmer-Entrepreneurs in Rural Ghana”, Journal of African Business, Vol. 18 No. 4, pp. 457-475. DOI: 10.1080/15228916.2017.1336915.
Onyeiwu, S., and Shrestha, H. (2004), “Determinants of foreign direct investment in Africa”,
Journal of Developing Societies, Vol. 20, pp. 89–106.
Page, J., and Shimeles, A. (2015), “Aid, Employment and Poverty Reduction in Africa”,
African Development Review, Vol. 27 No. S1, pp. 17–30.
Page, J., andSöderbom, M. (2015), “Is Small Beautiful? Small Enterprise, Aid and
Employment in Africa”, African Development Review, Vol. 27 No. S1, pp. 44–55.
Quartey P., andAfful-Mensah, G., (2014), Foreign Aid to Africa: Flows, Patterns and Impact, in Monga C and Lin J (eds), Oxford Handbook of Africa and Economics, Volume 2: Policies and Practices, Oxford University Press, Oxford, UK.
Ravallion, M. and Datt, G. (1999),“When is Growth Pro-poor? Evidence from the Diverse
Experiences ofIndia’s States”, WBPR Working Paper No. 2263.
Schultz, T.W. (1964), Transforming Traditional Agriculture. Yale University Press, New Haven, CT.
Simpasa, A., Shimeles, A. and Salami, A. O. (2015), “Employment Effects of Multilateral
Development Bank Support: The Case of the African Development Bank”, African Development Review, Vol. 27 No. S1, pp. 31– 43.
Svensson, J.(2000),“Foreign Aid and Rent-Seeking”, Journal of International Economics, Vol. 51, pp. 437–461.
Tchamyou, V. S., (2018), “Education, Lifelong learning, Inequality and Financial
access:Evidence from African countries”, Contemporary Social Science. DOI: 10.1080/21582041.2018.1433314.
Tchamyou, V. S., & Asongu, S. A., (2017),“Information Sharing and Financial Sector
Development in Africa”, Journal of African Business, Vol. 17, No.1, pp. 24-49.
The International Assessment of Agricultural Knowledge, Science, and Technology for Development (IAASTD), Island Press, 2nd ed. edition (January 31, 2009)
Timmer, C. P. (1997),“How Well do the Poor Connect to the Growth Process?”,Harvard Institute for International Development, CAER II Discussion Paper 17.
33
VanWeezel, S. (2016), “Food imports, international prices, and violence in Africa”, Oxford Economic Papers, Vol. 68 No. 3, pp. 758–781, https://doi.org/10.1093/oep/gpw015
Wamboye, E., Adekola, A., andSergi, B. S. (2013). “Economic Growth and the Role of Foreign
Aid in Selected African Countries”, Development, Vol. 56, No.2, pp. 155-171.
Whitfield, L., and G. Maipose. (2008), “Managing aid dependence: How African governments lost ownership and how they can regain”, in Global Economic Governance Programme Briefing Paper.http://www.geg.ox.ac.uk/sites/geg/files/Whitfield%20PB%20Managing%20Aid%20Depe ndence.pdf. Accessed 8/2/2017.
34 0 4 8 12 16 600 650 700 750 800 850 900
2002 2004 2006 2008 2010 2012 2014 Agriculture Value-Added per Worker
Official Development Assistance for Agriculture per Worker GDP per Capita
[image:35.612.127.557.119.484.2]Officail Development Assistance for Rural Developmnet per Capita
Figure 1. Median values of ODA for Agriculture, Agriculture Value-Added per Worker,
and Income Per Capita for the sample of 36 SSA countries
35
0 1 2 3 4
600 650 700 750 800 850 900
2002 2004 2006 2008 2010 2012 2014
Agricultural policy and administrative management Agriculture value-added per worker
Agricultural co-operatives per worker Agricultural development per worker
Agricultural education or training per worker Food crop production perworker
Industrial crops or export per worker Agricutural inputs
[image:36.612.165.554.132.467.2]Official development assistance for rural development per capita
Figure 2: Median values of select areas of official development assistance for agriculture (36 SSA countries)
A
g
ric
u
ltu
re
V
al
u
e-A
d
d
ed
p
er
w
o
rk
36
Table 1: A snapshot of Public Expenditure in Agriculture in Sub-Saharan Africa (2001-2015)
2001 2002 2003 2004 2005 2006 2007 2008 2009 2010 2011 2012 2013 2014 2015
ACGE 2.78 2.86 2.48 2.71 3.42 3.34 3.74 2.42 2.92 2.48 2.42 2.23 2.08 2.28 1.72
AGDP 12.19 12.23 16.26 14.02 13.75 14.12 14.30 14.89 15.72 14.04 13.91 14.06 13.83 9.84 13.23
AOIGE 0.23 0.23 0.15 0.19 0.25 0.24 0.26 0.23 0.19 0.18 0.17 0.16 0.15 0.23 0.13
Data Source: Food and Agriculture Organization of the United Nations
37 Table 2: Descriptive Statistics (US dollars)
Variable Obs Mean Std. Dev. Min Max
Agriculture value-added per worker 495 1314.79 1657.53 196.41 9745.69
GDP per capita 518 1345.37 1628.94 193.86 7627.85
ODA for agriculture per worker 462 19.70 34.51 -13.77 321.95
ODA for rural development per capita 461 1.22 1.88 -0.491 17.97
ODA for agricultural policy and administrative management per worker
451 3.06 7.85 -3.38 113.06
ODA for agricultural development per worker 452 3.51 6.16 -2.32 94.05
ODA for agricultural inputs per worker 330 0.520 1.21 -1.60 9.38
ODA for food crop production per worker 392 1.17 4.16 -0.620 76.1
ODA for industrial crops/export crops per worker 250 2.69 12.51 -0.217 123.6
ODA for agricultural co-operatives per worker 338 0.264 0.404 -0.339 3.68
Government Effectiveness 518 -0.734 0.549 -1.81 0.73