Munich Personal RePEc Archive
When Income Depends on Performance
and Luck: The Effects of Culture and
Information on Giving
Rey-Biel, Pedro and Sheremeta, Roman and Uler, Neslihan
15 January 2018
Online at
https://mpra.ub.uni-muenchen.de/83940/
1
When Income Depends on Performance and Luck:
The Effects of Culture and Information on Giving
Pedro Rey-Biel a Roman Sheremeta b,*
Neslihan Uler c
a Universitat Autònoma de Barcelona and Barcelona GSE
b Weatherhead School of Management at Case Western Reserve University
and the Economic Science Institute at Chapman University
c Department of Agricultural and Resource Economics, University of Maryland
January 15, 2018
Abstract
We study how giving depends on income and luck, and how culture and information about the determinants of others’ income affect this relationship. Our data come from an experiment conducted in two countries, the US and Spain – each of which have different beliefs about how income inequality arises. We find that when individuals are informed about the determinants of income, there are no cross-cultural differences in giving. When uninformed, however, Americans give less than the Spanish. This difference persists even after controlling for beliefs, personal characteristics, and values.
JEL Classifications: C91, D64, D83
Keywords: individual giving, information, culture, beliefs, laboratory experiment
* Corresponding author: Roman Sheremeta, Email: rms246@case.edu, Phone: (216) 368-4271.
2 1. Introduction
European governments are significantly more redistributive than the US government, as
evidenced by the (generally) more progressive tax systems and more generous social programs
espoused by European nations (Alesina et al., 2001; Alesina and Glaeser, 2004).1 Though
Americans’ total charitable giving is higher than that of many other countries, redistribution from
the rich to the poor is much more extensive in Europe than in the US – even after accounting for
significant differences in charitable giving.2 For example, on average, governments in EU
countries spend about twice the amount the US government does on individual consumption
(health care, housing, education, etc.).
Alesina and Glaeser (2004) argue that a simple comparison of giving rates between the US
and Europe is not sufficient evidence upon which to conclude that Europeans are more altruistic
than Americans.3 Instead, researchers should examine differences in giving rates controlling for
each culture’s beliefs about how income inequality arises and role, if any, luck plays in determining
income (Alesina et al., 2001; Benabou and Tirole, 2006; Fernández, 2010). Those who believe
economic outcomes mainly depend on individual effort may oppose redistribution towards poor
individuals, since they believe that poverty is most likely due to laziness. On the other hand, those
who believe that other factors not under an individual’s control (such as luck) determine economic
outcomes may be more in favor of redistribution to the poor. Put differently, observed differentials
in giving rates across nations/cultures may not reflect differences in inherent altruism, but rather
differences in beliefs about who is worthy of “charity.”
1 According to the OECD Better Life Index (2013), average governmental spending for EU countries was almost 13
percent of GDP, whereas American spending was about 6 percent.
2 According to the World Giving Index (2014), the US is the most charitable country in the world, with the charitable
sector being approximately 2 percent of GDP. Even after controlling for charitable giving, however, total redistribution is higher in Europe.
3 For example, Americans could derive higher utility from giving, or they may have a preference for being able to
3
To examine how individuals condition their giving on income and luck, and how culture
affects this relationship, we conduct a controlled laboratory experiment in the US and Spain.
According to the World Values Survey (1995), 68% of respondents in Spain said “poverty is due
to unfair society” while only 16% said “poverty is due to laziness and lack of willpower.” These
results place Spain on the other side of the spectrum with respect to the US, where these
percentages are 30% and 48%, respectively. Therefore, higher redistributive norms in Spain
compared to the US could be the result of differences in beliefs about how income inequality arises
(as opposed to differences in American and Spanish individuals’ innate willingness to give)
(Alesina and Angeletos, 2005). To test this hypothesis, we examine how giving differs across
cultures when individuals are uninformed about the determinants of others’ income. As opposed
to naturally occurring data, our controlled environment rules out (by construction) the possibility
of differences in government redistribution policies (Alesina and Glaeser, 2004). Hence, our
experiment is able to isolate the innate differences across cultures in preferences for giving, if any,
and how these preferences are impacted by beliefs about how income inequality arises.
To our knowledge, our paper offers the first cross-cultural comparison of giving between
two countries with opposing beliefs about the determinants of income. We employ a novel
experiment, in which beliefs about such determinants are elicited in an incentive compatible
manner. In addition to the cross-cultural aspect, the novel design of our study allows us to answer
other interesting questions that previous studies could not. For example, we are able to investigate
the determinants of giving and beliefs for each culture and study whether giving depends on
information about how others’ income is generated.
In our experiment, income is determined by individual performance and luck. In most
4
solely on individual performance (Konow, 2000; Andreoni, 2006; Vesterlund, 2006). In contrast,
in our experiment, income is determined by a combination of performance on a real-effort task
(counting the number of certain letters in a fixed number of sequences) and luck (a random shock)
which creates a more realistic setting, and allows us to study whether there are any interaction
effects between luck and performance on giving. More importantly, we vary the information
presented to individuals at the time of giving (i.e., whether individuals could observe how others’
income was determined or not). This allows us to study how individuals react to such information
(or the lack thereof). Finally, in cases where individuals do not observe the determinants of income,
we elicit individual beliefs about how the income of others is generated.
Before summarizing our findings, we want to emphasize that even though our study was
conducted at two select universities in the US and Spain, the survey that we conducted after the
experiment replicates the important patterns reported in the World Values Survey (with particular
regard to beliefs about the determinants of income, government responsibilities and religion). That
the results of our surveys across these dimensions are in line with the World Values Survey
strengthens the validity of our experimental results.
Coming back to our results, we find that both culture and information affect individual
giving. Our results indicate that while the overall amount of giving is similar between the two
countries when participants are informed about the determinants of others’ income, there exist
important cross-cultural differences when individuals are uninformed, with Americans giving
significantly less than Spanish participants. Moreover, the cross-cultural difference in giving
5
In Section 2 we summarize papers related to ours. We describe the experimental design
and procedures in Section 3, and present our main results in Section 4. The implications of our
results are discussed in Section 5.
2. Related Literature
Alesina and Angeletos (2005) provide a theoretical model suggesting that Europe has
higher redistribution policies than the US because Europeans believe that luck and connections
have strong effects on wealth, whereas Americans believe that personal effort determines wealth.
This study raises an important question. Can differing beliefs be an explanation for observed
cross-cultural differences?
There is a large literature on the relationship between how income is generated and
individual giving decisions. Many economic experiments study how individuals give when all
determinants of income are known (Andreoni, 2006; Vesterlund, 2006).4 Hoffman et al. (1994),
for example, show that in the dictator game, agents give less when they earn their right to be the
dictator. Similarly, Cherry et al. (2002) and Oxoby and Spraggon (2008) show that dictators give
(take) less when income is earned by the dictators (recipients) compared to when income is
determined by the experimenter. Konow (2000), Cappelen et al. (2007), Konow et al. (2009), Erkal
et al. (2011), Lefgren et al. (2016), Tonin and Vlassopoulos (2017) and Gee et al. (2017) study
different fairness principles when all determinants of income, such as effort and luck, are known.
There are three exceptions: Fong (2001, 2007) investigates the impact of beliefs on redistributive
preferences. Ubeda (2014) uses a similar experimental set-up to our “no information” treatment to
4 While most of these experimental studies involve a small number of participants interacting with each other, the
6
compare the consistency of different fairness rules. Caballero (2016) studies the impact of
information about opportunities on redistributive behavior. None of these papers, however, are
cross-cultural, and none elicit participants’ beliefs about the determinants of income.
Cross-cultural experiments have been used to understand giving norms across cultures
when determinants of income are known (Roth et al., 1991; Anderson et al., 2000; Henrich et al.,
2001; Cason et al., 2002; Guiso et al., 2006; Herrman et al., 2008; Jakiela, 2015; Almas et al.,
2016). In addition, the US and Spain have been the focus of other cross-cultural experimental
studies. Brandts et al. (2004), for example, find no significant differences in contributions to public
goods between the US and Spain, while Alm et al. (1995) and Alm and Torgler (2006) find higher
tax compliance in the US compared to Spain. In the context of cross-cultural studies, the most
related paper to ours is by Farina and Grimalda (2011), who study preferences for redistribution
in the US, Italy and Norway. In contrast to our paper, their focus is on taxes in a redistributive
environment. We, on the other hand, are interested in individual giving that eliminates the strategic
interactions inherent in studies of taxation. Moreover, the novelty of our study is that we examine
beliefs about the determinants of income and also control for them while investigating the cross-cultural differences in giving norms.
In summary, while there is a large literature devoted to understanding sharing norms and
how culture affects giving, there has not been any study that systematically compares sharing
norms across cultures where income is determined by both performance and luck, and where
information and beliefs regarding determinants of income are controlled for. While many studies
argue that the observed cultural differences are due to differing beliefs, our paper demonstrates
7 3. Experimental Design and Procedures
We conducted sixteen experimental sessions at Universitat Pompeu Fabra in Barcelona,
Spain and at the University of Michigan, USA.5 A total of 280 individuals participated in the study.
The computerized experimental sessions used z-Tree experimental software (Fischbacher, 2007).
Participants were given the instructions (available in Appendix A) at the beginning of the session
and the experimenter read the instructions aloud.6 At the end of the experiment, participants were
paid in private, and in cash.
Experiments were double-blind. Nobody, not even the experimenter, knew how much each
participant earned from the experiment. Participants earned approximately $20 (15€) on average,
and sessions (including the instruction time) lasted approximately 70 minutes. Instructions were
written in English and then translated into Spanish. Two independent assistants translated the
instructions back to English to check for any inconsistencies.
In our experiment, participants earn income based on performance and luck.7 In the first
stage of the experiment (the earning stage) all participants had 30 minutes to count the sum of “a”
and “d” characters contained in a series of 50-character sequences, which were presented to all
participants in the same order. This information was made common knowledge such that
differences in outcomes could not be attributed to possible differences in the difficulty of the task.8
Characters included letters, punctuation marks, numbers, and symbols. Each participant worked
5 Both universities share similar aspects: they are both among the largest universities in their countries, and they are
both public schools.
6 Two coauthors of this paper ran the initial sessions together to agree on the same experimental procedure, and then
followed it independently for the rest of the experiments.
7 While most papers in the literature do not have this property, there are some studies in which income is determined
by both performance and luck (i.e., Cappelen et al., 2007; Erkal et al., 2011; Rubin and Sheremeta, 2016).
8 There were 300 sequences, which is more than anyone could finish within the allocated time. The task is inspired by
8
on the task independently. Participants were told that their earnings (total income) were determined
by the sum of the number of correct counts (individual income from performance) and a random
shock (individual income from luck) drawn from a discrete uniform distribution (which could take
values -50, -25, 0, +25, or +50).9 Participants were also told that they could stop counting
characters or take a break whenever they wanted – in fact, for subjects who might not want to work
for the whole half an hour, newspapers were made available on each participant’s desk to reduce
stigma on shirking.
In the second stage of the experiment, the giving stage, participants were matched in pairs,
and each participant had an opportunity to give part of his/her income to another participant (a
two-player dictator game). Each participant received the information about their own income, their
own number of correct counts and their own random shock. In the INFO treatment, participants
also received the same information about their matched participant, while in the NOINFO
treatment, participants were only told about the total income of their matched participant (i.e., the
sum of the random shock and number of correct counts). While each member of the pair could
give any amount of their own income to their partner, only one person’s choice was actually
implemented. For each pair, the computer randomly determined which of the two participants’
decisions would count to determine payments.10 We followed a between-subjects design.
9 We used a piece rate scheme and a task not depending on cultural differences and/or skill in order to control for
preferences for competition across different cultures and to minimize the role of skill/knowledge on earnings. Some experiments employ tournaments to determine earnings, or rely on skill or knowledge-related tasks (Erkal et al., 2011; Cherry et al., 2002; Price and Sheremeta, 2015; Clingingsmith and Sheremeta, 2018). In cases where the random shock was negative and the number of correct counts was less than the absolute value of the random shock, the computer set earnings for the first part to zero.
10 Iriberri and Rey-Biel (2011) show that in modified dictator games, individuals give more when the role of dictator
9
Finally, the NOINFO treatment contained a (surprise) third stage, which was not present
in the INFO treatment. In this third stage, we used incentivized elicitation of participants’ beliefs
about the other participant’s random shock, rewarding an exact correct guess with 10 tokens.
At the end of the experiment, and while participants waited to be paid, they filled out a
questionnaire (available in Appendix B), eliciting self-reported measures about perceptions,
personal characteristics and values. At the end of the experiments, participants’ earnings were
converted to US Dollars or Euros at a conversion rate of 1 token = $0.15 or 1 token = 0.1€ (which
was very close to the currency exchange rate at the time).11 In the analysis that follows, all results
will be reported in tokens.
4. Results
4.1. Individual giving
Before examining individual giving, it is important to emphasize that, based on the
Wilcoxon rank-sum test, we do not find any significant differences in performance between
participants in Spain and the US (82.2 versus 79.1, p-value = 0.14).12 Therefore, any difference in
giving between the two countries cannot be attributed to aggregate differences in performance or
income (since income is generated based on performance). Looking at the level of individual
giving (see Table 1), we observe relatively lower average giving (an average of 3% of income)
and a lower proportion of positive giving (an average of 29% of all giving) than those levels
reported in many previous experimental studies (Camerer, 2003). This may be partially due to our
11 The average earning in the US was $20.0 (minimum of $5.0 and maximum of $26.9) and in Spain it was €14
(minimum of €7.8 and maximum of €40.8). In the US, subjects earned on average (and in absolute terms) $12.3 from exerting effort and $5.2 from luck, while in Spain, subjects earned on average €7.9 from exerting effort and €3.7 from luck.
10
double-blind experimental procedure, entitlements of earned income, and use of a strategy method
(Hoffman et al., 1994; Cherry et al., 2002; Iriberri and Rey-Biel, 2011).13
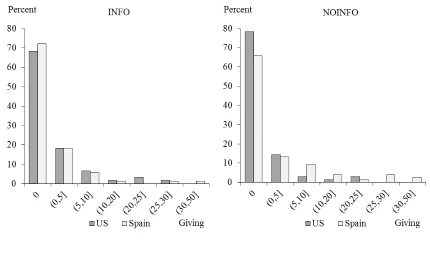
Figure 1 shows the average giving by treatment and country.14 Using the Wilcoxon
rank-sum test, we find no significant cross-cultural differences in giving in the INFO treatment (1.9 in
Spain versus 2.4 in US, p-value = 0.57). Moving from the INFO to the NOINFO treatment, we
find that Spanish participants increase their average giving from 1.9 to 4.4 (p-value = 0.21), while
Americans decrease their giving from 2.4 to 1.3 (p-value = 0.16).15 As a result, in the NOINFO
treatment, the average giving in Spain is higher than in the USA and the difference is statistically
significant based on the two-tailed Wilcoxon rank-sum test (4.4 versus 1.3, p-value = 0.04).
Although nonparametric tests give us insights about giving decisions across treatments and
countries, they are not entirely informative since they do not control for important variables, such
as individual performance, luck and beliefs. We thus turn to regression analysis to control for these
relevant factors in giving decisions. Since we have censored data, OLS regressions would give
inconsistent estimates. Therefore, we report Tobit regressions in the main text. We note, however,
that our results are also robust to running OLS estimations (see Appendix C).
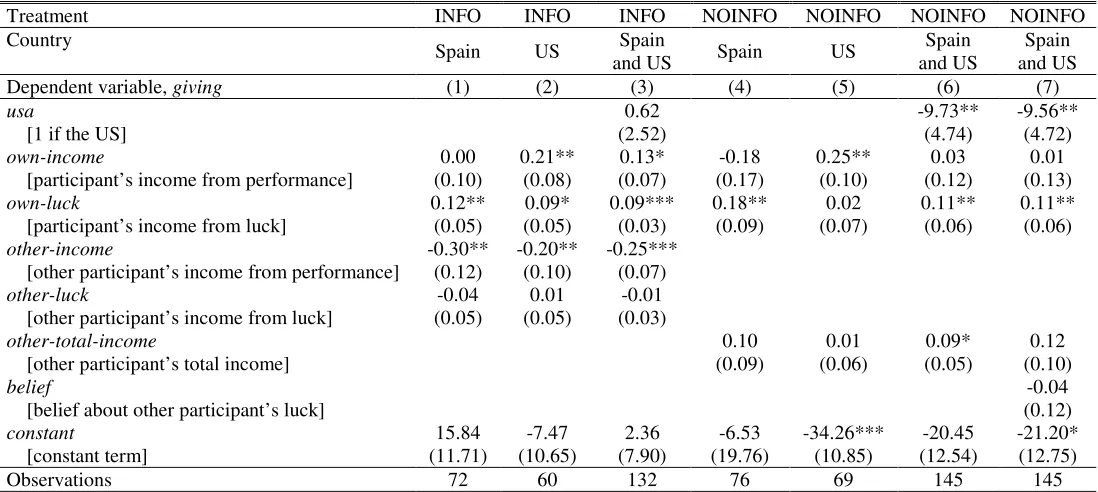
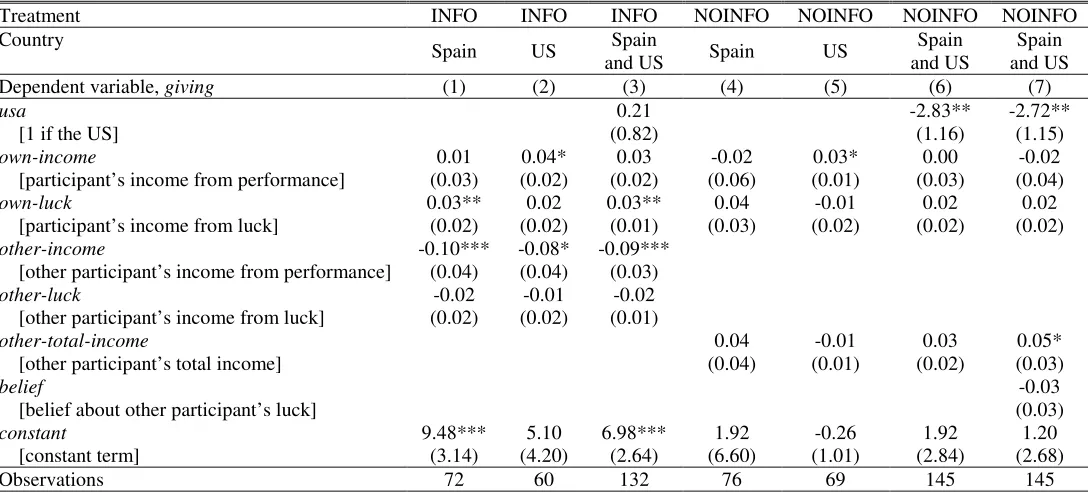
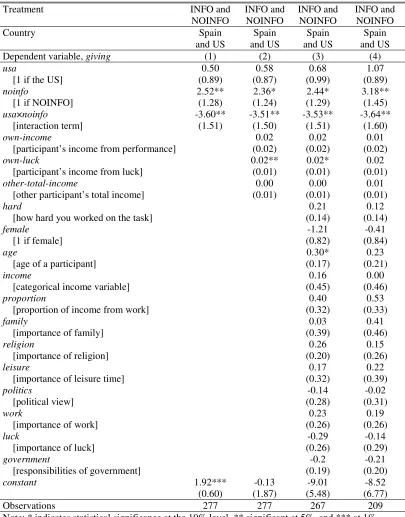
Table 2 reports Tobit regressions with robust standard errors, where the dependent variable
in all regressions is giving.16 Independent variables in regressions (1)-(3) are individuals’ income
13 Another reason is that we are using all the data, including people who are asked to make a decision on how much
to transfer to someone else who has a higher total income.
14 Results reported in the paper do not include the three outliers who gave all their earnings. Including or excluding
them only affect the averages, but do not affect the qualitative results of the paper. Results without eliminating the outliers can be requested from the authors.
15 We also ran Tobit regressions to test the effect of information by controlling for the participant’s own income from
performance, own income from shock and the paired participant’s net income. We cannot reject the hypothesis that Spanish participants did not change their giving between INFO and NOINFO (p-value = 0.14), but Americans significantly decrease their giving when uninformed (p-value = 0.05).
16 We choose to report Tobit regression analyses in the main text since the majority of giving in the INFO and NOINFO
11
from performance (own-income and other-income), individuals’ income from random shock (
own-luck and other-luck), and a dummy variable for USA sessions (usa). Regression (3) in Table 2 shows that controlling for own-income, other-income, own-luck and other-luck, the usa dummy is not statistically significant in the INFO treatment. The same conclusion stands when using OLS
regressions (see Table C1).
In the NOINFO treatment, participants were not informed about the other participant’s
income from performance or random shock, but only the other participant’s total income.
Therefore, instead of using other-income and other-luck variables, we use other-total-income as a dependent variable in regressions (4)-(7). Regression (6) shows that the usa dummy is statistically
significant at the 5% level when participants are uninformed. Regression (7) also controls for the
individual’s belief regarding the random shock of the paired participant (belief). The variable belief
takes values -50, -25, 0, 25 and 50. Even after controlling for beliefs, cross-cultural differences in
giving still exist. The main finding of the paper is presented in Result 1.
Result 1: When individuals are informed about the determinants of income, there are no
cross-cultural differences in giving. However, when uninformed, American participants give less
than Spanish participants.
Could the difference in the average giving between Spanish participants and American
participants in the NOINFO treatment be explained by the differences in the number of givers? To
answer this question, Figure 2 provides a comparison of giving distributions by treatment and
country. Using the two-sample test of proportions, we find that in the INFO treatment, the
proportion of positive giving in Spain is not different than in the US (28% versus 32%, p-value =
0.63). Similarly, we find no difference in the NOINFO treatment at the 95% confidence level (34%
12
variables (as in Table 2) shows that the probability of giving in Spain is not significantly different
from the probability of giving in the US, both in the INFO treatment (p-value = 0.71) and in the
NOINFO treatment (p-value = 0.16).17 Therefore, the difference in the average giving between
Spanish participants and American participants in the NOINFO treatment cannot be explained by
the differences in the number of givers.
4.2. The determinants of giving
Table 2 also provides information regarding the determinants of giving. Regression (1)
indicates that in the INFO treatment, Spanish participants condition their giving on own-luck and
other-income, with giving increasing in own luck and decreasing in the other’s income. Previous studies on two-person dictator games (e.g., Hoffman et al., 1994; Cherry et al., 2002; Cappelen et
al., 2007) suggest that individuals are more generous when their wealth depends solely on a
random shock, which would explain why participants who receive a positive shock increase their
giving. Also, it is intuitive that participants observing higher other-income may conclude that such
participants do not need additional income.18 Regression (2) shows that American participants,
similar to Spanish participants, condition their giving on own-luck and other-income. We also find
that Americans condition their giving on own-income, with giving increasing in own income. When we pool the data from both countries, as in regression (3) in Table 2, we find that own-luck
and other-income significantly impact giving. We also see that own-income effects giving, but it
is only marginally significant.
17 The estimation results are available from the authors upon request.
18 Perhaps individuals with low performance in the real-effort task receive higher transfers, partly because they
13
Next, we examine the determinants of giving in the context of the NOINFO treatment.
Regression (4) in Table 2 indicates that uninformed Spanish participants condition their giving
solely on own-luck, with giving increasing in their own luck. Regression (5) in Table 2 indicates that American participants condition their giving on own-income, with giving increasing in own
income. We find that neither Americans nor Spanish condition their giving on other-total-income
in the NOINFO treatment. Regression (6) shows that other-total-income has a marginally
significant effect on giving, but Regression (7) shows that the effect disappears once beliefs are
controlled for. Note that Regression (7) shows that individuals do not condition their giving on
their belief regarding the other participants’ random draw, which might be surprising. This is
consistent, however, with the observation that individuals condition their giving on own-luck, but do not condition their giving on other-luck in the INFO treatment. We provide a more in-depth
analysis of beliefs in Section 4.3. Result 2 summarizes the determinants of giving for each culture
and information condition.19
Result 2: When informed about how others’ income is generated, both American and
Spanish participants increase their giving in own luck and decrease in the other’s income.
American participants also condition their giving on own-income. When uninformed about how
others’ income is generated, Spanish participants increase their giving in own-luck, while Americans increase their giving in own-income.
19 Given that in our experiment, subjects only make one decision, we do not have enough statistical power to study
14 4.3. Beliefs about luck
While our initial analyses in Table 2 show that beliefs do not account for the differences
we observe in giving across cultures, this section gives a more detailed analysis, bolstering our
initial result.
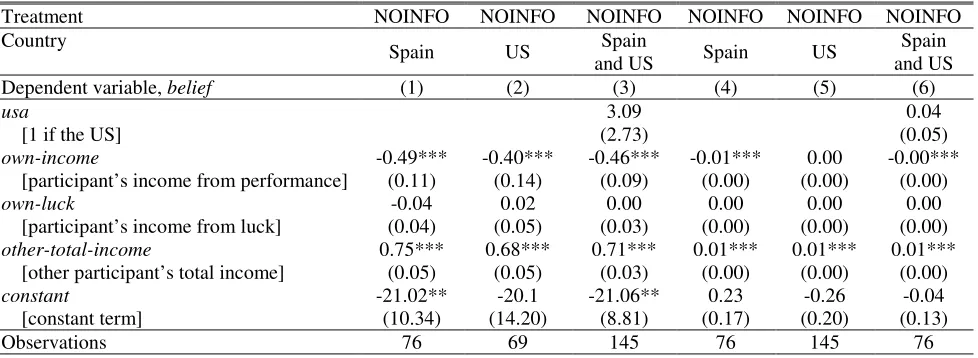
Recall that the variable belief takes values -50, -25, 0, 25 and 50. Since belief is a categorical and ordered variable, we use ordered logistic regressions to study the determinants of
beliefs. Table 3 reports the estimation results (OLS regressions are in Table C2 in Appendix C).
Not surprisingly, both in Spain (Regression 1) and in the US (Regression 2), we find a strong
positive correlation between belief and other-total-income. This indicates that when participants
observe higher total income, they tend to believe that it was significantly influenced by luck.
Interestingly, beliefs are also significantly correlated with own-income. Participants with lower
income (coming from lower performance) guess higher numbers. Regression (3) in Table 3 shows
that in our controlled study, there are no cross-cultural differences in forming beliefs regarding the
random shock.
Regressions (4)-(6) in Table 3 use a slightly different belief variable. Now the dependent variable belief has two categories: luck plays a positive role in generating income (belief = 1 if
participants believe that others’ random number was 25 or 50) or not (belief = 0 if participants believe that others’ random number was 0, -25 or -50). Again, we find a negative relationship
between belief and own-income, as well as a strong positive correlation between belief and
15
Result 3: When forming beliefs about how the income of others is generated, both Spanish
and American participants increase their beliefs when other-total-income increases, and decrease their beliefs when own-income increases.
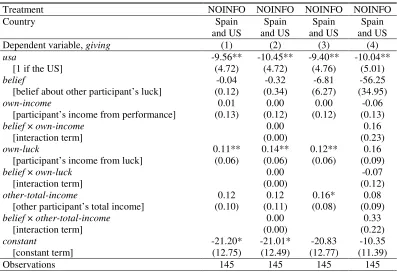
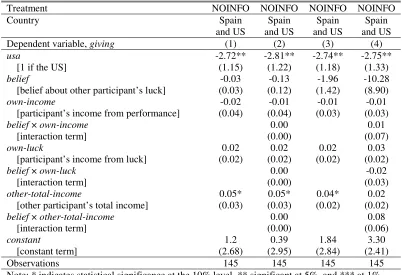
While we do not find any significant differences in beliefs across cultures, we provide a
stronger test to see whether beliefs can explain observed differences in giving between American
and Spanish participants in the NOINFO treatment, if we allow for the belief variable to interact
with other independent variables in a more flexible manner. Table 4 reports estimation results for
Tobit regressions (OLS regressions are in Table C3 in Appendix C). For convenience, Regression
(1) in Table 4 is the same as Regression (7) in Table 2. Recall that we found in the NOINFO
treatment that American participants give significantly less than Spanish participants, which is
indicated by the (negative) significance of the usa dummy. The only difference in Regression (2)
in Table 4 is that we add interaction terms with belief, where belief takes values -50, -25, 0, 25 and 50. Regressions (3) and (4) in Table 4 use the variable belief, where belief takes values 0 or 1. Table 4 shows that in all specifications, the usa dummy is negative and significant at the 5% level. Result 4: Difference in giving levels between American and Spanish individuals who are
uninformed about the determinants of income persists – even after controlling for their beliefs.
In sum, we do not observe any significant differences across cultures in forming beliefs
regarding the random shock. This demonstrates that our participants are similar in terms of how
they perform Bayesian updating.20 Nevertheless, we still observe differences in giving across
20 Note that this does not mean that there are no cultural differences in beliefs in a more general setting. In fact, in
16
cultures. We conjecture that even when beliefs do not differ substantially, low information
environments impose different giving norms across cultures.21
4.4. Personal characteristics and values
This section provides additional robustness checks for our results by pooling all the data
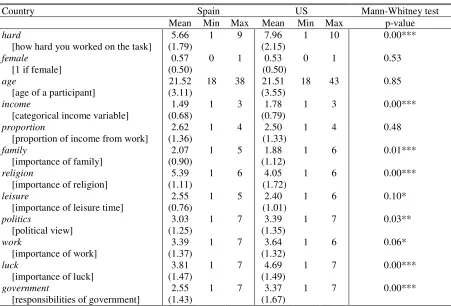
and controlling for personal characteristics and values. Table 5 shows the summary of personal
characteristics by country.22 First, we asked participants to report how hard they think they had worked on the real-effort task in our experiment, using a scale from 1 to 10. Participants also
reported their gender, age, birthplace, income, and what proportion of that income comes from
their own work, as well as their personal values regarding issues such as family, religion, leisure,
work, their political orientation (politics) and their attitude towards government responsibilities. The variables family, religion, and leisure take values from 1 to 6 where 1 corresponds to “extremely important” and 6 corresponds to “not important at all.” The variable work takes values from 1 to 7, where 1 corresponds to the participant thinking “Less importance placed on work in
our lives” is “extremely desirable” and 7 corresponds to the participant thinking the same change
is “extremely undesirable.” The variable politics takes values from 1 to 7, where 1 corresponds to
“extreme left” and 7 corresponds to “extreme right.” The variable government takes values from 1 to 7 where 1 corresponds to the participant completely agreeing that government should take
more responsibility to ensure that everyone is provided for, and 7 corresponds to the participant
completely disagreeing with this statement. Finally, participants were asked whether they agree
21 It may still be true that some part of the explanation as to why redistributive systems between the US and Europe
diverge is due to differing beliefs. Nevertheless, in a controlled environment such as ours, we show that participants in both cultures have similar beliefs, yet they still give differently.
22 Questionnaire data from session 8 of our experiment was lost due to a problem with the server. Thus, we only
17
with the statement “Hard work doesn´t bring success—it’s more a matter of luck and connections.”
The variable luck takes values from 1 to 7, where 1 corresponds to the participant completing agreeing with that statement and 7 corresponds to the participant completely disagreeing.23
Table 5 shows that although the gender and age composition of our participant pools are
similar, there are several important differences across cultures. First, we see that American
participants report higher numbers than Spanish participants when they are asked about how hard
they think they had worked on the real-effort task in our experiment, even though the number of
correct counts is very similar across the two countries.24 Second, American participants have
higher income, higher family values and put more importance on religion. Spanish participants are
more likely to believe that “hard work doesn’t bring success,” and that “the government should
take more responsibility to ensure everyone is provided for” and stated that they are more
left-oriented in politics.25
While our study was conducted at only one university per country, one can contrast the
survey results from our experiment with the World Values Survey to check whether our samples
are representative. We have investigated the 2005-2009 and 2010-2014 waves of the World Values
Survey. We find that the results from the survey in our experiment are consistent with the patterns
reported in the World Values Survey for the variables luck, religion, and government, suggesting
23 While we have also elicited birthplace, we later concluded that this variable was not serving our purposes well. For
example, instead of birthplace, a measure for where a participant was raised would be a better cultural proxy.
24 We check whether averages may be misleading by studying the distribution of answers for this question. We see
striking differences. Among the Spanish participants, only 1 reported a 9 and none reported a 10 in this question. Meanwhile, over 40% of American participants reported either a 9 or a 10. In addition, when we regress correct counts on the level of how hard a participant reported to work, there is a strong positive relationship for American participants (p-value < 0.01) but not for Spanish participants (p-value = 0.67). One explanation is that American participants put a higher value on being perceived as hardworking compared to Spanish participants.
25 American participants also report that they put more importance on leisure time, while Spanish participants agreed
18
that our sample of participants is representative of general populations of the US and Spain along
these dimensions. 26
Result 5: The survey responses by American and Spanish participants in our experiment
replicate the patterns reported in the World Values Survey regarding attitudes towards beliefs
about the determinants of income, government responsibility and religion.
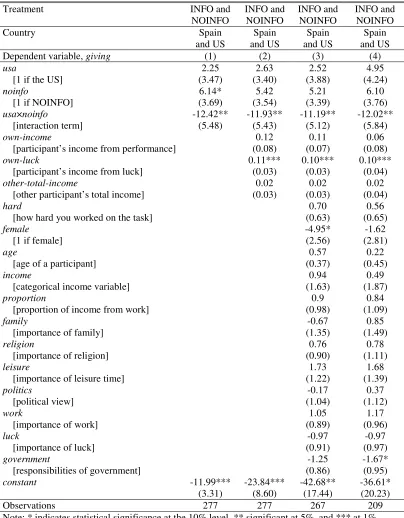
Next, we run a robustness check by controlling for personal characteristics and values.
Given relatively small number of observations generated in our experiments, we need to pool the
data from all treatments. We begin by estimating a simple Tobit regression where giving is the dependent variable, and the independent variables are a usa dummy, noinfo dummy, and a
usa×noinfo interaction. Table 6 reports estimation results for these Tobit regressions (OLS regressions are in Table C4 in Appendix C). Consistent with our previous non-parametric analysis,
Regression (1) shows sizable and significant interaction between usa and noinfo, suggesting that Americans give less than Spanish in the NOINFO treatment. Regression (2) adds relevant
experimental control variables, Regression (3) adds demographics, and Regression (4) drops
foreigners. These regressions show that even after controlling for personal characteristics and
values, the interaction effect is still negative and significant at the 5% level.
Result 6: Cross-cultural difference in giving between American and Spanish individuals
who are uninformed about the determinants of income persists even after controlling for personal
characteristics and values.
26 The variable family does not generate consistent predictions across these two waves. World Values Survey wave
19 5. Discussion
Despite abundant research on the subject, the reasons that Europeans redistribute more than
Americans remains largely a mystery. To address this issue, we designed a novel experiment to
study how individuals condition their giving on income and luck, and how culture and information
affect this relationship. We conducted our experiments in two countries, the US and Spain, that
have different beliefs about how income inequality arises. We find that both culture and
information affect individual giving. Giving is similar across cultures when individuals are
informed about how others’ income is generated. When individuals are uninformed, however,
American participants give less, while Spanish participants give more. Moreover, the
cross-cultural difference in giving persists even after controlling for individuals’ beliefs, personal
characteristics and values.
Of course, our results on cross-cultural differences in giving should be taken with caution
since we have only one location from each country (and use students as subjects). It is possible
that variations in location and geography could affect our results, or that the results would be
different if participants were drawn from a non-student population. Nevertheless, our main point
remains valid. Our study uses two very different participant pools, whose survey responses are
consistent with the findings of the World Values Survey. Moreover, our treatment manipulations
target the question of how these two different populations change their giving behavior in response
to information about how the income of others is generated.
Our study contributes to several areas of research. First, our study contributes to the
discussion about different fairness ideals such as strict egalitarianism, libertarianism, and liberal
egalitarianism (Konow, 2000; Cappelen et al., 2007; Fong and Oberholzer-Gee, 2011). While strict
20
egalitarians believe individuals should not be held responsible for circumstances beyond their
control. As in Cappelen et al. (2007, 2013), in a two-person dictator game, we find some evidence
for liberal egalitarianism both for Spanish and American participants, since when informed about
the determinants of others’ income, both groups conditioned their giving on own-luck (see Table
2).27 Our results are thus linked to Konow’s accountability principle (Konow, 1996; Konow, 2000), which states that rewards should be allocated in proportion to the relevant variables that an
individual can influence (i.e., earning income from performance) but not according to those that
he cannot influence (i.e., earning income from luck).
Our study also sheds light on why previous studies do not always agree on the relationship
between the level of income and giving: Eckel et al. (2007) and Smeets et al. (2015) find a positive
relationship; Auten et al. (2000), Erkal et al. (2011) and Tonin and Vlassopoulos (2017) find
nonlinear relationship between income and individual giving; Andreoni and Vesterlund (2001) and
Buckley and Croson (2006) find no significant relationship at all. In particular, the results of our
experiment suggest that the uncertainty about how income is generated and cultural differences
affect the relationship between income and giving. Therefore, our paper suggests that findings
from studies on generosity that took place in Europe may not always be consistent with findings
from studies in the US, and vice versa. This highlights the importance of replication in order to see
how much of the findings presented in this and other studies could be generalized.
There are important policy implications of our study. For example, one implication is for
charitable organizations in the US. Our paper suggests that Americans do not have different tastes
in terms of the level of giving when individuals are informed about the causes of poverty, but they
give less compared to Europeans when they are uninformed. This would also be consistent with
27 Cappelen et al. (2007) conducted their experiment in Norway, while Cappelen et al. (2013) conducted their
21
why Americans like to direct a big portion of their giving to underdeveloped nations where it is
obvious that poverty is caused by circumstances beyond individual control (Schraeder et al., 1998;
Alesina and Dollar, 2000). Charitable organizations could benefit from providing more
information and transparency to their potential donors (Easterly and Pfutze, 2008).
Finally, we see a number of fruitful avenues for future research. One of the puzzling
findings of our study is that when the income-generating process is uncertain, cross-cultural
differences in giving persist even after controlling for beliefs, personal characteristics, and values.
Therefore, an obvious question is how to explain such cross-cultural differences. First, it could be
the case that our belief-elicitation procedure and the corresponding measures of beliefs are noisy,
so that we are not able to fully capture true differences in beliefs. Replicating our findings in
different countries and geographical locations, as well as using non-student populations, would be
the first step. Second, although we have elicited the beliefs of participants, we did not elicit
individual confidence in such beliefs. Indeed, it could be the case that differences in beliefs may
be important only for those participants who are confident in their assessment about how the
income of others was generated. Therefore, it is important for future research to elicit not only
beliefs, but also individual confidence about such beliefs. Finally, there could be other
cross-cultural differences, such as preferences for uncertainty or ambiguity aversion, which could
potentially impact participants’ giving in the NOINFO treatment, but which we did not elicit in
22 References
Abeler, J., Falk, A., Goette, L., & Huffman, D. (2011). Reference points and effort provision. American Economic Review, 101, 470-492.
Alesina, A., & Angeletos, G.M. (2005). Fairness and redistribution. American Economic Review, 95, 960-980.
Alesina, A., & Dollar, D. (2000). Who gives foreign aid to whom and why? Journal of Economic Growth, 5, 33-63.
Alesina, A., & Glaeser, E.L. (2004). Fighting poverty in the US and Europe: A world of difference. Oxford: Oxford University Press.
Alesina, A., Glaeser, E., & Sacerdote, B. (2001). Why doesn't the US have a European-style welfare system? Brookings Papers on Economic Activity, 2, 187-277.
Alm, J. Sanchez, I., & De Juan, A. (1995). Economic and noneconomic factors in tax compliance. Kyklos, 48, 3-18.
Alm, J., & Torgler, B. (2006). Culture differences and tax morale in the United States and in Europe. Journal of Economic Psychology, 27, 224-246.
Almas, I., Cappelen, A. W., & Tungodden, B. (2016). Cutthroat capitalism versus cuddly socialism: Are Americans more meritocratic and efficiency-seeking than Scandinavians? Working Paper. Anderson, L.R., Rodgers, Y.V., & Rodriguez, R.R. (2000). Cultural differences in attitudes toward
bargaining. Economics Letters, 69, 45-54.
Andreoni, J. (2006). Philanthropy. Handbook of Giving, Reciprocity and Altruism, Amsterdam: North Holland, 1201-1269.
Andreoni, J., & Vesterlund, L. (2001). Which is the fair sex? Gender differences in altruism. Quarterly Journal of Economics, 116, 293-312.
Auten, G.E., Clotfelter, C., & Schmalbeck, R.L. (2000). Taxes and philanthropy among the wealthy. In J. Slemrod (Ed.), Does atlas shrug? The economic consequences of taxing the rich (pp. 392– 424). New York and Cambridge, MA: Russell Sage and Harvard University Press.
Benabou, R., & Tirole, J. (2006). Belief in a just world and redistributive politics. Quarterly Journal of Economics, 121, 699-746.
Brandts, J., & Charness, G. (2011). The strategy versus the direct-response method: A first survey of experimental comparisons. Experimental Economics, 14, 375-398.
Brandts, J., Saijo, T., & Schram, A. (2004). How universal is behavior? A four country comparison of spite and cooperation in voluntary contribution mechanisms. Public Choice, 119, 381-424. Buckley, E., & Croson, R. (2006). Income and wealth heterogeneity in the voluntary provision of
linear public goods. Journal of Public Economics, 90, 935-955.
Caballero, G. (2016). Opportunities and effort: ex-post redistribution in the lab. Working paper. Camerer, C. (2003). Behavioral Game Theory: Experiments on Strategic Interaction. Princeton:
Princeton University Press.
Cappelen, A.W., Hole, A.D., Sorensen, E.O., & Tungodden, B. (2007). The pluralism of fairness ideals: An experimental approach. American Economics Review, 97, 818-827.
Cappelen, A.W., Moene, K., Sorensen, E.O., & Tungodden, B. (2013). Needs vs entitlements – an international fairness experiment. Journal of the European Economic Association, 11, 574-598. Cason, T.N., Saijo, T., & Yamato, T. (2002). Voluntary participation and spite in public good
provision experiments: an international comparison. Experimental Economics, 5, 133-153. Cherry, T.L., Frykblom, P., & Shogren, J.F. (2002). Hardnose the dictator. American Economic
23
Clingingsmith, D., & Sheremeta, R. M. (2018). Status and the demand for visible goods: Experimental evidence on conspicuous consumption. Experimental Economics, forthcoming. Durante, R., Putterman, L., & van der Weele, L. (2014). Preferences for redistribution and
perception of fairness: An experimental study. Journal of the European Economic Association, 12, 1059-1086.
Easterly, W., & Pfutze, T. (2008). Where does the money go? Best and worst practices in foreign aid. Journal of Economic Perspectives, 22, 29-52.
Eckel, C.C., De Oliveira, A., & Grossman, P.J. (2007). Is more information always better? An experimental study of charitable giving and Hurricane Katrina. Southern Economic Journal, 74, 388-411.
Erkal, N., Gangadharan, L., & Nikiforakis, N. (2011). Relative earnings and giving in a real-effort experiment. American Economic Review, 101, 3330-3348.
Esarey, J., Salmon, T., & Barrilleaux, C. (2012). Social insurance and income redistribution in a laboratory experiment. Political Research Quarterly, 65, 685-698.
Farina, F., & Grimalda, G. (2011). Preferences for redistribution in the US, Italy, Norway: An experimental study. Working Paper.
Fernández, R. (2010). Does culture matter? Handbook of Social Economics. In Jess Benhabib, Alberto Bisin, Matt Jackson, eds., North Holland.
Fischbacher, U. (2007). z-Tree: Zurich toolbox for ready-made economic experiments. Experimental Economics, 10, 171-178.
Fong, C. (2001). Social preferences, self-interest, and the demand for redistribution. Journal of Public Economics, 82, 225-246.
Fong, C. (2007). Evidence from an experiment on charity to welfare recipients: Reciprocity, altruism and the empathic responsiveness hypothesis. Economic Journal, 117, 1008-1024.
Fong, C.M., & Oberholzer-Gee, F. (2011). Truth in giving: Experimental evidence on the welfare effects of informed giving to the poor. Journal of Public Economics, 95, 436-444.
Gee, L.K., Migueis, M., & Parsa, S. (2017). Redistributive choices and increasing income inequality: experimental evidence for income as a signal of deservingness. Experimental Economics, 20, 894-923.
Gneezy, U., & List, J. (2006). Putting behavioral economics to work: Field evidence on gift exchange. Econometrica, 74, 1365-1384.
Guiso, L., Sapienza, P., & Zingales, L. (2006). Does culture affect economic outcomes? Journal of Economic Perspectives, 20, 23-48.
Henrich, J., Boyd, R., Bowles, S., Camerer, C., Fehr, E., Gintis, H., & McElreath, R. (2001). In search of homo economicus: Behavioral experiments in 15 small-scale societies. American Economic Review, 91, 73-78.
Herrmann, B., Thoni, C., & Gächter, S. (2008). Antisocial punishment across societies. Science, 319, 1362-1367.
Hoffman, E., McCabe, K., Shachat, K., & Smith, V.L. (1994). Preference, property rights and anonymity in bargaining games. Games and Economic Behavior, 7, 346-380.
Iriberri, N., & Rey-Biel, P. (2011). The role of role uncertainty in modified dictator games. Experimental Economics, 2, 160-180.
Jakiela, P. (2015). How fair shares compare: Experimental evidence from two cultures. Journal of Economic Behaviour and Organization, 118, 40-54.
24
Konow, J. (2000). Fair shares: Accountability and cognitive dissonance in allocation decisions. American Economics Review, 90, 1072-1091.
Krawczyk, M. (2010). A glimpse through the veil of ignorance: Equality of opportunity and support for redistribution. Journal of Public Economics, 94, 131-141.
Lefgren, L., Sims, D., & Stoddard, O. (2016). Effort, luck and voting for redistribution. Journal of Public Economics, 143, 89-97.
Price, C.R., & Sheremeta, R.M. (2015). Endowment origin, demographic effects, and individual preferences in contests. Journal of Economics and Management Strategy, 24, 597-619.
Roth, A. Prasnihar, V., Okuno-Fujiwara, M., & Zamir, S. (1991). Bargaining and market behavior in Jerusalem, Ljubljana, Pittsburgh and Tokyo: An experimental study. American Economic Review, 81, 1068-1095.
Rubin, J., & Sheremeta, R.M. (2016). Principal-agent settings with random shocks. Management Science, 62, 985-999.
Schraeder, P.J., Hook, S.W., & Taylor, B. (1998). Clarifying the foreign aid puzzle: A comparison of American, Japanese, French, and Swedish aid flows. World Politics, 50, 294-323.
Sheremeta, R.M., & Uler, N. (2016). The impact of taxes and wasteful government spending on giving. Working Paper.
Smeets, P., Bauer, R., & Gneezy, U. (2015). Giving behavior of millionaires. Proceedings of the National Academy of Sciences, 34, 10641-10644.
Tonin, M., & Vlassopoulos, M. (2017). Sharing one’s fortune? An experimental study on earned income and giving. Journal of Behavioral and Experimental Economics, 66, 112-118.
Ubeda, P. (2014). The consistency of fairness rules: An experimental study. Journal of Economic Psychology, 41, 88-100.
25
Table 1: Earning and giving by treatment and country.
Treatment Number of
observations Population
Average earning from effort
Average (absolute) earning from luck
Average transfer Percentage of positive transfers Average positive transfer INFO NOINFO 132 145 ALL ALL 79.1 (18.4) 82.3 (17.2) 35.0 (19.0) 36.4 (18.3) 2.1 (5.1) 3.0 (7.7) 29.5% 28.3% 7.3 (7.1) 10.5 (11.6) INFO 72 Spain 81.5 (16.1) 34.0 (18.9) 1.9 (5.1) 27.8% 6.9 (7.7) NOINFO 76 Spain 83.0 (17.0) 35.2 (19.2) 4.4 (9.8) 34.2% 13.0 (13.2) INFO 60 US 76.3 (20.5) 36.3 (19.2) 2.4 (5.1) 31.7% 7.6 (6.5) NOINFO 69 US 81.6 (17.5) 37.7 (17.5) 1.3 (3.8) 21.7% 6.1 (6.2) Note: Standard deviation in parentheses.
Table 2: The determinants of giving by treatment and country.
Treatment INFO INFO INFO NOINFO NOINFO NOINFO NOINFO Country
Spain US Spain
and US Spain US
Spain and US
Spain and US Dependent variable, giving (1) (2) (3) (4) (5) (6) (7)
usa 0.62 -9.73** -9.56**
[1 if the US] (2.52) (4.74) (4.72)
own-income 0.00 0.21** 0.13* -0.18 0.25** 0.03 0.01 [participant’s income from performance] (0.10) (0.08) (0.07) (0.17) (0.10) (0.12) (0.13) own-luck 0.12** 0.09* 0.09*** 0.18** 0.02 0.11** 0.11** [participant’s income from luck] (0.05) (0.05) (0.03) (0.09) (0.07) (0.06) (0.06) other-income -0.30** -0.20** -0.25***
[other participant’s income from performance] (0.12) (0.10) (0.07) other-luck -0.04 0.01 -0.01 [other participant’s income from luck] (0.05) (0.05) (0.03)
other-total-income 0.10 0.01 0.09* 0.12
[other participant’s total income] (0.09) (0.06) (0.05) (0.10)
belief -0.04
[belief about other participant’s luck] (0.12) constant 15.84 -7.47 2.36 -6.53 -34.26*** -20.45 -21.20* [constant term] (11.71) (10.65) (7.90) (19.76) (10.85) (12.54) (12.75)
Observations 72 60 132 76 69 145 145
[image:26.612.33.582.338.584.2]26
Table 3: The determinants of beliefs in the NOINFO treatment by country.
Treatment NOINFO NOINFO NOINFO NOINFO NOINFO NOINFO Country
Spain US Spain
and US Spain US
Spain and US Dependent variable, belief (1) (2) (3) (4) (5) (6)
usa 0.31 0.62
[1 if the US] (0.33) (0.60)
own-income -0.08*** -0.06*** -0.07*** -0.14*** -0.03 -0.07*** [participant’s income from performance] (0.02) (0.02) (0.02) (0.04) (0.03) (0.02) own-luck -0.01 0.00 0.00 0.00 0.01 0.01 [participant’s income from luck] (0.01) (0.01) (0.00) (0.02) (0.01) (0.01) other-total-income 0.11*** 0.08*** 0.09*** 0.21*** 0.07*** 0.10*** [other participant’s total income] (0.02) (0.02) (0.01) (0.04) (0.02) (0.02)
Observations 76 69 145 76 69 145
Note: * indicates statistical significance at the 10% level, ** significant at 5%, and *** at 1%. Robust standard errors are in parentheses. Regressions (1)-(3) use belief = {-50, -25, 0, 25, 50} and regressions (4)-(6) use belief = {0, 1}.
Table 4: The impact of beliefs about luck on giving.
Treatment NOINFO NOINFO NOINFO NOINFO
Country Spain
and US Spain and US Spain and US Spain and US Dependent variable, giving (1) (2) (3) (4) usa -9.56** -10.45** -9.40** -10.04** [1 if the US] (4.72) (4.72) (4.76) (5.01) belief -0.04 -0.32 -6.81 -56.25 [belief about other participant’s luck] (0.12) (0.34) (6.27) (34.95) own-income 0.01 0.00 0.00 -0.06 [participant’s income from performance] (0.13) (0.12) (0.12) (0.13)
belief × own-income 0.00 0.16
[interaction term] (0.00) (0.23) own-luck 0.11** 0.14** 0.12** 0.16 [participant’s income from luck] (0.06) (0.06) (0.06) (0.09)
belief × own-luck 0.00 -0.07
[interaction term] (0.00) (0.12) other-total-income 0.12 0.12 0.16* 0.08 [other participant’s total income] (0.10) (0.11) (0.08) (0.09) belief × other-total-income 0.00 0.33 [interaction term] (0.00) (0.22) constant -21.20* -21.01* -20.83 -10.35 [constant term] (12.75) (12.49) (12.77) (11.39)
Observations 145 145 145 145
[image:27.612.109.506.343.615.2]27
Table 5: Personal characteristics by country.
Country Spain US Mann-Whitney test
Mean Min Max Mean Min Max p-value hard
[how hard you worked on the task]
5.66 (1.79)
1 9 7.96 (2.15)
1 10 0.00***
female [1 if female]
0.57 (0.50)
0 1 0.53 (0.50)
0 1 0.53
age
[age of a participant]
21.52 (3.11)
18 38 21.51 (3.55)
18 43 0.85
income
[categorical income variable]
1.49 (0.68)
1 3 1.78 (0.79)
1 3 0.00***
proportion
[proportion of income from work]
2.62 (1.36)
1 4 2.50 (1.33)
1 4 0.48
family
[importance of family]
2.07 (0.90)
1 5 1.88 (1.12)
1 6 0.01***
religion
[importance of religion]
5.39 (1.11)
1 6 4.05 (1.72)
1 6 0.00***
leisure
[importance of leisure time]
2.55 (0.76)
1 5 2.40 (1.01)
1 6 0.10*
politics
[political view]
3.03 (1.25)
1 7 3.39 (1.35)
1 7 0.03**
work
[importance of work]
3.39 (1.37)
1 7 3.64 (1.32)
1 6 0.06*
luck
[importance of luck]
3.81 (1.47)
1 7 4.69 (1.49)
1 7 0.00***
government
[responsibilities of government]
2.55 (1.43)
1 7 3.37 (1.67)
1 7 0.00***
28
Table 6: Personal characteristics and giving.
Treatment INFO and
NOINFO INFO and NOINFO INFO and NOINFO INFO and NOINFO
Country Spain
and US Spain and US Spain and US Spain and US Dependent variable, giving (1) (2) (3) (4)
usa 2.25 2.63 2.52 4.95
[1 if the US] (3.47) (3.40) (3.88) (4.24)
noinfo 6.14* 5.42 5.21 6.10
[1 if NOINFO] (3.69) (3.54) (3.39) (3.76) usa×noinfo -12.42** -11.93** -11.19** -12.02** [interaction term] (5.48) (5.43) (5.12) (5.84)
own-income 0.12 0.11 0.06
[participant’s income from performance] (0.08) (0.07) (0.08) own-luck 0.11*** 0.10*** 0.10*** [participant’s income from luck] (0.03) (0.03) (0.04) other-total-income 0.02 0.02 0.02 [other participant’s total income] (0.03) (0.03) (0.04)
hard 0.70 0.56
[how hard you worked on the task] (0.63) (0.65)
female -4.95* -1.62
[1 if female] (2.56) (2.81)
age 0.57 0.22
[age of a participant] (0.37) (0.45)
income 0.94 0.49
[categorical income variable] (1.63) (1.87)
proportion 0.9 0.84
[proportion of income from work] (0.98) (1.09)
family -0.67 0.85
[importance of family] (1.35) (1.49)
religion 0.76 0.78
[importance of religion] (0.90) (1.11)
leisure 1.73 1.68
[importance of leisure time] (1.22) (1.39)
politics -0.17 0.37
[political view] (1.04) (1.12)
work 1.05 1.17
[importance of work] (0.89) (0.96)
luck -0.97 -0.97
[importance of luck] (0.91) (0.97)
government -1.25 -1.67*
[responsibilities of government] (0.86) (0.95) constant -11.99*** -23.84*** -42.68** -36.61*
(3.31) (8.60) (17.44) (20.23)
Observations 277 277 267 209
29
Figure 1: Average giving by treatment and country.
[image:30.612.88.518.395.648.2]30
Appendix A – Instructions for the NOINFO treatment
Below you can find the instructions for the treatment with no information regarding the determinants of others’ income. Instructions for the treatment with information are identical with the exception that the screen in Part II containing information about the other subjects’ earnings also includes the number of correct answer and the random number of the paired subject. Instructions for the treatment with information did not contain a Part III of the experiment, where beliefs were elicited.
General Instructions
Thank you for agreeing to participate in this experiment. Several research agencies have provided funds for this research. Please make sure your cell phones are turned off to avoid interruptions during the proceedings.
This experiment deals with individual decision making. Your participation in this experiment is voluntary. As you know, you will be compensated for your participation; if you read the instructions carefully, you can, depending on yours and other participants’ decisions, earn a considerable amount of money in addition to the $7 participation fee. The currency used in the experiment is tokens. Tokens will be converted to US dollars at a rate of 1 token to 0.15 US dollars.
The experiment consists of two parts. You will be provided with instructions for Part I of the experiment. After Part I of the experiment is over, you will be provided with instructions for Part II. While you wait to be paid, you will be asked to fill out a questionnaire.
In our experiment, all records will be linked to an anonymous subject ID. At the end of the experiment, you will be paid privately and anonymously. The experimenter will get help from one of her assistants to distribute the payments. The assistant does not know which ID belongs to which participant. The assistant will place the earnings of participants in envelopes with matching ID numbers. After closing the envelopes, the assistant will pass the envelopes to the experimenter. Therefore, nobody, not even the experimenter, will be able to link your decisions to your name during or after the experiment.
Please do not communicate with the other participants during the experiments. Should you have any questions, please raise your hand. At the end of the experiment we will call you, one at a time, to pay you in private.
Pre-instructions
In the first part of this experiment you will be asked to count the sum of “a” and “d” characters in 50-character
sequences. Characters include letters, punctuation marks, numbers, and symbols. Below we provide some examples. Please make sure you understand how we have calculated the sum of “a” and “d” characters in each sequence.
sequence
# 50-characters sequence
total number of “a” and “d”
characters 1 aaaaaaaaadddaaaaaddaaaaaaaaaaaaaaaaaaaaaaaaaaaaaaa 50 2 7po6df^gaips78fadfsdfs&fsdasdftyhgdua*gfrtg(tratra 12 3 p0=jsjd8fjaalkjdflkjds890aaaaaaaatrhtr-taatrgtaaaa 19 4 Las9-fakjasklfjalsdjlkjaakljalksaljl=-ddt+gtraaart 14
[image:31.612.77.551.527.614.2]31
When you finish, the computer will display the correct sum of “a” and “d” characters next to each sequence. If all your answers are correct, both columns should be the same.
Even if you use the following page to make notes, please remember to input each number in the computer as soon as you have calculated it.
Instructions Part I
In this Part I of the experiment, you will be provided with 300 character sequences. During 30 minutes you will be asked to count the sum of “a” and “d” characters in each sequence. Your earnings from Part I will depend on your result. Your result will be computed by adding a random number X to the number of your correct counts:
(your result) = (your number of correct counts) + (your random number X)
where your random number X is randomly drawn by the computer and it can be either -50, -25, 0, +25, or +50. Each of these numbers is equally likely to be drawn and may differ for each participant. At the end of this part the computer will make one separate and independent random draw for each participant.
For example, if you correctly count the sum “a” and “d” characters in 82 sequences and the random number X selected by the computer is -25, your result will be 57=(82-25), while if the random number selected by the computer is +50 your result will be 132= (82+50). Numbers in this example are just for illustrative purposes and do not intend to indicate how the computer will choose the random number.
After the 30 minutes of the experiment, the computer will randomly draw your random number X and will calculate your result based on your random number and your number of correct counts. Then the computer will calculate earnings of each participant. Your earnings from Part I are calculated by multiplying your result by 1 token:
(your earnings in Part I) = (your result *1 token)
Note: if your random number is negative and the number of correct counts is less than your random number then your result will be negative. In such a case, the computer will set your earnings for this part of the experiment to zero.
32
ask you is to keep quite during the 30 minutes. In case you decide to take a break, we have left some newspapers for you to read (you are also allowed to take books and lecture notes and read).
The sentences are provided in paper sheets. You are allowed to use a pen. However, you are asked to enter the sum of “a” and “d” letters before the 30 minutes end to be able to get your earnings.
Please wait until the experimenter gives the start sign.
Instructions Part II
In this Part II of the experiment you are randomly paired with another participant. To preserve anonymity, neither of you will ever learn with whom you are paired with.
At the beginning of Part II, the computer will display your number of correct counts, your random number (which the computer randomly drew from -50, -25, 0, +25, or +50), and your result in Part I. Remember, the result from Part I is:
(your result) = (your number of correct counts) + (your random number X)
Finally, the computer will display your earnings. Remember, earnings from Part I are calculated by multiplying your result by 1 token:
(your earnings in Part I) = (your result) * (1 token)
The computer will also display the result, and the earnings in Part I of your paired participant. The computer WILL NOT show you the number of correct answer or the random number of your paired participant. Remember that your paired participant’s random number may be different from your random number since the computer makes two separate random draws: one for you and one for your paired participant.
An example of the display screen is shown below:
Once the computer displays the screen above, you will make a decision on how much you would like to transfer
33
suppose your earnings from Part I is 100 tokens and if the other participant’s earnings is 120 tokens. If you enter a transfer of 15 your final earnings will be 85 (=100-15), and the other participant’s final earnings will be 135 (=120+15).
Numbers in this example are just for illustrative purposes and do not intend to indicate how you should make your decisions.
Although both you and your paired participant will make the transfer decisions, the computer will randomly implement only one decision made by either you or your paired participant. However, you will not know whose decision will be implemented until the end of the experiment. Since your decision is implemented with 50% probability, you should pay careful attention to the transfer decision you make.
To summarize, if your decision is randomly picked, then your transfer will decrease your earnings and it will increase your paired participant’s earnings. However, you will not get anything from your paired participant’s transfer since his/her decision is not implemented. Similarly, if your paired participant’s decision is randomly picked, his/her transfer will increase your earnings, and it will decrease his/her earnings. However, you will not transfer anything to your paired participant since your decision is not implemented.
At the end of the experiment you will be paid the total amount of your final income in private and in cash.
In our experiment, all records will be linked to an anonymous subject ID. At the end of the experiment, you will be paid privately and anonymously. The experimenter will get help from one of her assistants to distribute the payments. The assistant does not know which ID belongs to which participant. The assistant will place the earnings of participants in envelopes with matching ID numbers. After closing the envelopes, the assistant will pass the envelopes to the experimenter. Therefore, nobody, not even the experimenter, be able to link your decisions to your name during or after the experiment.
Part III (only for the NOINFO treatment)
In the screen you just saw, the computer only showed you the result and the earnings in Part I of your paired participant. The computer did not show you the random number of your paired participant.
In this Part II we ask you to make a prediction about the random number of your paired participant. If your guessing is correct you will receive 10 extra experimental points which will add up to your final earnings. If your prediction is not correct you will not earn any additional point.
34 Appendix B – Questionnaire
1. How hard did you work in the first part of the experiment in a scale from 1 to 10? a. 1
b. 2 c. 3 d. 4 e. 5 f. 6 g. 7 h. 8 i. 9 j. 10
2. Gender a. male b. female
3. Age
4. Average Monthly Income (including all income sources such as parent’s expenses for you) a. less than $500
b. between $500-1000 c. more than $1000
5. What proportion of your income comes from your own work a. less than 20%
b. between 20% and 50% c. between 50% and 70% d. all or almost all
6. What is the importance of family in your life: a. extremely important
b. very important c. important
d. somewhat important e. not very important f. not important at all
7. What is the importance of religion in your life: a. extremely important
b. very important c. important
d. somewhat important e. not very important f. not important at all
8. What is the importance of leisure time in your life: a. extremely important
b. very important c. important