REVIEW ARTICLE
Brain Tumor Imaging in Clinical Trials
J.W. Henson S. Ulmer G.J. Harris
SUMMARY:There are substantial challenges in the radiologic evaluation of tumor size during clinical trials, and it is important for neuroradiologists to have a firm understanding of these issues. This review will examine measurement approaches, response criteria, selection of lesions for measurement, technical imaging considerations, interval between tumor measurements and response confirmation, and validity of imaging as a measure of efficacy.
E
normous effort has been invested in clinical trials for ma-lignant gliomas and brain metastases during the past 30 years. Phase I and phase III studies, with their respective goals of defining maximal tolerated dose and overall survival, do not rely on neuroimaging as a primary end point. Imaging is cru-cial in phase II studies, however, because radiographic re-sponse, in combination with clinical status, is used to assess therapeutic effect.1Phase II studies are usually conducted inpatients with progressive tumors, and serial imaging examina-tions are performed after initiation of treatment and com-pared with a baseline pretreatment study. Radiographic re-sponse for each patient is then assigned according to predetermined criteria.
Neuroradiologists should have a firm understanding of the issues involved in imaging brain tumors in clinical trials, not only with respect to review of quantitative imaging but also to assist in the optimal use of imaging in trial design.
Measurement Techniques
Two major approaches are available for the evaluation of con-trast-enhancing tumor size on serial imaging studies during clinical trials: 1) diameter-based measurement on a single-axial section containing the largest diameter of tumor, and 2) computer-assisted volumetric analysis of all sections contain-ing tumor.
Diameter Methods
Diameter-based approaches involve the measurement of ei-ther a single largest diameter (1D or Response Evaluation Cri-teria in Solid Tumors [RECIST; http://ctep.cancer.gov/guide-lines/recist.html]) or 2 orthogonal diameters (2D or Macdonald criteria) on a single axial section (Fig 1).2-4
RECIST (1D).Imaging response guidelines called RECIST were published in 2000 to replace the 1981 World Health Or-ganization (WHO) guidelines.2,3The new criteria were de-signed as a uniform, simplified, and conservative standard to determine response to therapy for solid tumors. RECIST has not been widely adopted for clinical trials involving brain
tu-mors, mainly because of the historic use of 2D criteria (see below).
RECIST measures the longest single linear enhancing di-ameter across a lesion in the axial plane (Fig 1). This measure-ment is repeated with each study, always by using the longest diameter, even if it varies from the original orientation or sec-tion. Minimal measurable lesion diameter is 10 mm or at least 2 times the imaging section thickness, to reduce the variability due to volume averaging and variations in section selection between studies. Cystic or necrotic foci of tumor and lepto-meningeal lesions are considered nonmeasurable according to the written criteria. When multiple lesions are analyzed, the individual diameter measurements are recorded separately and then summed for response evaluation. RECIST response criteria are described below (see “Response Criteria”).
Macdonald Criteria (2D).Most trials for patients with ma-lignant gliomas use the WHO-based “Macdonald criteria.”4A
measurement is made of the maximal enhancing tumor diam-eter on a single axial gadolinium-enhanced T1-weighted sec-tion, and then the largest perpendicular diameter is measured on the same image (Fig 1). The product of the 2 diameters is calculated, and the measurements are repeated with each scan. Measurements from multiple lesions are summed. The Mac-donald criteria do not specifically address the presence of ne-crotic portions of lesions. Macdonald response criteria are dis-cussed below.
Computer-Aided Volumetric Methods
In the computer-aided volumetric or perimeter approach, semiautomated tumor-segmentation software is used to de-termine the tumor volume. The computer generates a border between the enhancing and nonenhancing regions on all axial sections that contain enhancing tumor (Fig 1), by using a combination of image processing techniques such as histo-gram statistics and morphologic filtering. These images are reviewed, the perimeters are adjusted by a neuroradiologist, and the program calculates an enhancing volume, a nonen-hancing volume (ie, the centrally necrotic or cystic portion), and total or combined lesion volume in cubic centimeters by adding the lesion volumes from the stack of images.
Response Criteria
Once serial studies become available for lesion measurement during a clinical trial, the following terms are used to describe responses. The specific numeric values for each of these cate-gories are given in the Table.
Complete Response.Complete response (CR) is the disap-pearance of all enhancing tumor, including measurable and nonmeasurable areas. CR should be confirmed with a repeat study at 4 weeks.
From the Stephen E. and Catherine Pappas Brain Tumor Imaging Research Program (J.W.H., S.U.), Division of Neuroradiology (J.W.H.), 3D Imaging Service (J.W.H., G.J.H.), Department of Radiology (J.W.H., G.J.H.), and Neurology Service (J.W.H.), Massachusetts General Hospital, Boston, Mass; and Harvard Medical School (J.W.H., G.J.H.), Boston, Mass.
This work was supported by the Pappas Brain Tumor Imaging Research Program, Massa-chusetts General Hospital, and a grant form the National Cancer Institute to the Dana-Farber/Harvard Cancer Center, which supports Dr. Harris as Principal Investigator of the Tumor Imaging Metrics Core.
Please address correspondence to John W. Henson, MD, Stephen E. and Catherine Pappas Brain Tumor Imaging Research Program, Massachusetts General Hospital, 55 Fruit St, Yawkey Nine East, Boston, MA 02114; e-mail: [email protected]
DOI 10.3174/ajnr.A0963
REVIEW
Partial Response.Partial response (PR) is a specified per-centage decrease in the tumor measurement compared with the baseline scan (Table). PR should be confirmed with a re-peat study at 4 weeks.
Stable Disease.Stable disease (SD) includes changes that do not meet criteria for CR, PR, or progressive disease (PD).
Progressive Disease.PD is a specified percentage increase in tumor measurement compared with the lesion size that defines the nadir, or smallest measurement, in the serial stud-ies. PD should be confirmed with a repeat study at 4 weeks. Any unequivocally new lesion is also a criterion for PD. Crite-ria for new lesions should be defined by protocol.
Fig 1.Three enhancing foci in a patient with glioblastoma illustrate issues with lesion measurement during clinical trials. Lesion A is homogeneously enhancing and exceeds 10 mm in diameter and thus is ideal for serial measurement by RECIST or 1D (lower left), Macdonald or 2D (lower right), and volumetric (upper right) approaches. Lesion B is predomi-nantly necrotic and is amenable to volumetric measurement (upper right) because the enhancing and nonenhancing com-ponents can be segmented. Lesion C is too small in diameter (8 mm) for accurate serial measurement and should be followed as a nonmeasurable lesion (see text). Images are postgadolinium contrast-enhanced axial T1-weighted.
Comparison of response criteria for different measurement approaches
RECIST (1D)3 Macdonald (2D)4
Volumetric Extrapolated from RECIST*,†
Volumetric Extrapolated from Macdonald*,‡
CR Resolution of all enhancing tumor; confirm at 4 weeks
Resolution of all enhancing tumor; confirm at 4 weeks
Resolution of all enhancing tumor; confirm at 4 weeks
Resolution of all enhancing tumor; confirm at 4 weeks
PR§ ⱖ30% decrease in sum of maximal diameters; confirm at 4 weeks
ⱖ50% decrease in product of 2 orthogonal diameters; confirm at 4 weeks
ⱖ66% decrease in volume; confirm at 4 weeks
ⱖ65% decrease in volume; confirm at 4 weeks SD All others All others All others All others
PD储 ⱖ20% increase in sum of maximal diameters; confirm at 4 weeks
ⱖ25% increase in product of orthogonal diameters; confirm at 4 weeks
ⱖ73% increase in volume; confirm at 4 weeks
ⱖ40% increase in volume; confirm at 4 weeks Comment Single longest diameter of the
lesion or sum of longest diameters of multiple measurable lesions (see text)
Product of orthogonal diameters on section with largest tumor area; sum of products if multiple measurable lesions
Computer-assisted volumetrics using a perimeter methodology; sum of volumes if multiple measurable lesions
Use of these values would be equally stringent for PR comparing RECIST and Macdonald criteria but would be more stringent for PD compared with RECIST but comparable with Macdonald criteria
Note:—CR indicates complete response; PR, partial response; SD, stable disease; PD, progressive disease.
* “Extrapolated” refers to converting single diameter or orthogonal diameter measurements to a volume assuming a spheric lesion using the formula V⫽4/3r3. † Volume versus 1D (ie, cube of linear RECIST criteria).
‡ Volume versus 2D.
§ Percentage change from baseline (see text).
[image:2.594.52.379.45.375.2]Best Response.Best response is the largest reduction in tumor measurement during the study (compared with the ini-tial response). Best response may differ from iniini-tial response in patients with PR followed by a CR.
With diameter approaches, CR and PR were seen in ap-proximately 10% of patients in clinical trials for newly diag-nosed malignant gliomas5and in 1%–10% of patients with
progressive disease.6,7The criteria for measurement was not
well delineated in these studies. Given this low response rate and the fact that cytostatic therapies would not be expected to produce tumor shrinkage, some studies used the duration of SD as a measure of response, by means of either time to pro-gression (TTP) or propro-gression-free survival (PFS).1
TTP.TTP is the interval between the treatment start date and a subsequent imaging study that shows PD.
PFS.PFS is the percentage of patients who have not expe-rienced PD at a specified time point after beginning treatment (eg, 2-month PFS or 6-month PFS).
A common end point for phase II clinical trials is 6-month PFS. Phase II studies compare the percentage of patients with PFS to that of an historical control group. There are significant issues with the use of PFS in a phase II study, however, because it is difficult to identify an appropriate control group or to determine what constitutes a meaningful improvement over the historical comparison group. Most studies seek to demon-strate a response rate (CR⫹PR) of 20% or a 20% improve-ment of a measure of response over a historical comparison population.8
To our knowledge, correlations between quantitative pa-rameters of response criteria between 1D (RECIST), 2D (Mac-donald), and a volumetric approach have not been closely ex-amined. The Table provides a theoretic comparison based on an idealized spheric tumor. Some investigators have used a straight percentage-change approach, such that 50% reduc-tion is used for volume (3D) as in the area (2D or Macdonald) criteria. Another approach would be to use mathematic ex-trapolation between linear and volumetric measurements, such that a 50% decrease in area (2D) would be equal to a 65% decrease in volume (3D) for a PR. These issues can have an impact on the stringency of criteria for PR and PD. Further research regarding the range of deviation of tumors from the idealized spheric shape will be necessary to determine the best values for most accurate response rate comparisons, and vali-dation of each approach will be important. Nonetheless, sev-eral retrospective studies have compared these measurement approaches.
Comparison of Diameter and Volumetric Approaches Diameter approaches are simple to perform and have reason-ably low inter-reader variation.7However, the use of a linear
measurement on a single-axial image ignores the tendency of malignant gliomas to be highly irregular in shape, to progress in a pattern of eccentric nodular growth, and to have cystic and central necrotic areas that are unlikely to be affected by non-surgical treatment.
Volumetric approaches analyze the entire tumor by using multiple sections and have the ability to exclude nonenhanc-ing areas. Measurement variation is low.9In many patients
with malignant gliomas, irregular peripheral enhancement and extension along the subependymal regions can make it
very challenging to outline an enhancing volume. Two other issues with the volumetric approach are investment of time and the need for specialized technical skills and computer software.
At least 4 retrospective studies have compared diameter and volumetric approaches for the detection of response in neuro-oncology clinical trials.5,7,9,10 Three of these articles
concluded that there was no difference in the detection of response, as defined either by reduction in tumor size by a specified amount or by TTP (see the discussion of response criteria, below). Sorenson et al9found that computer-aided
volumetric analysis was more sensitive in the early detection of progression, especially with smaller lesions, and, in a subset analysis, concluded that a different response determination was indicated by volumetrics compared with a diameter method in one quarter of cases. In this article, however, the comparison was between volumetric analysis and a 3-diame-ter measurement approach, and for that reason, the data are difficult to compare with the other 3 studies that compared RECIST and Macdonald approaches. In the 3 other reports,5,7,10 the diameter measurements were made on 5-mm, skip 1-mm axial images (when specified), and the cri-teria for lesion inclusion were not specified in terms of mini-mal diameter and whether the lesion could be centrally ne-crotic. Nonetheless, the computer-assisted volumetric approach yielded a higher response rate than did the single linear (RECIST) measurements in the large retrospective study by Shah et al.7Specifically, PR would have been declared
in 8% of patients (n⫽284 studies) by using the 1D measure-ment compared with 17% PR rate by using the volumetric approach. The authors did not address the statistical signifi-cance of this finding. The studies did not find differences in measures of TTP or PFS. The lack of significant difference between techniques may reflect the inclusion of lesions of sub-stantial nonenhancing components, thereby decreasing the sensitivity for response in the enhancing component.
Choosing a Measurable Lesion in Clinical Trials
Definition of a measurable lesion is of major importance in those clinical trials that have an imaging end point. As noted previously, there are many factors that make some lesions ideal for serial measurement and render others less valuable. At present, most clinical trial protocols do not specify criteria for lesion selection.
Enhancement
Malignant gliomas are histopathologically and radiographi-cally heterogeneous in appearance, with geographiradiographi-cally irreg-ular margins, variable enhancement, regions of central ne-crotic or cystic change, and surrounding T2-weighted hyperintensity (Fig 1). Brain metastases are typically more spheric and lend themselves more easily to analysis. Contrast enhancement provides the best currently available measure of tumor size. A component of the lesion that is as homoge-neously enhancing as possible should be selected for response assessment because cystic and necrotic portions of a lesion are unlikely to respond to interventions other than surgery. RE-CIST specifically excludes measurement of cystic lesions in systemic cancers,3and this criterion should be adhered to as
Central necrotic or cystic areas within a region of enhance-ment are less of an issue with computer-assisted volumetric assessment (Fig 1, and see below) because the computer soft-ware can segment and quantitate enhancing and nonenhanc-ing components. In a malignant glioma with irregular nodular enhancement, it may be better to choose the largest area of solidly enhancing tumor for measurement if the margins of the nodular focus can be clearly defined, rather than to try to outline the entire margin of the lesion. Protocols should define the maximal percentage of an enhancing focus that can be nonenhancing, as assessed visually on the section containing the largest lesion diameter (eg, 80% for volumetric studies).
Minimal Diameter for Inclusion of Measurable Lesions Specification of a minimal lesion diameter for measurable le-sions aims to reduce the potential for variation in the measure-ment of smaller lesions due to section selection and volume averaging. In accordance with RECIST, the minimal lesion diameter should be greater than or equal to 2 times the section thickness. With a routine T1-weighted image in which the sections are 5 mm, skip 1 mm, the minimal diameter would be 12 mm. The use of 3-mm, skip 0-mm gadolinium-enhanced T1-weighted images and specification of a 10-mm minimal lesion diameter would be more in keeping with RECIST criteria.
Multicentric Lesions
Approximately one third of malignant gliomas are multicen-tric at the time of diagnosis, and in half of these cases, there are discrete foci of enhancement.11The approach in this situation
is to measure and record each separately enhancing lesion that meets inclusion criteria and the sum the measurements.
Nonmeasurable Lesions
The concept of nonmeasurable lesions at baseline can be im-portant in clinical trials because tumor progression may occur in these sites. A nonmeasurable lesion might include foci of enhancement that are less than the specified smallest diameter (Fig 1), the region of T2-weighted hyperintensity surrounding enhancing tumor, discrete foci of nonenhancing T2-weighted hyperintensity that represent multicentric tumor, hemor-rhagic or predominantly cystic or necrotic lesions, and lepto-meningeal tumor. Hemorrhagic lesions often have intrinsic T1-weighted hyperintensity that could be misinterpreted as enhancing tumor, and for this reason, the precontrast T1-weighted image must be examined at baseline to prevent this error. Notes regarding nonmeasurable lesions should be re-corded on the imaging case report form for each study.
Postoperative Changes
Many patients entering clinical trials have undergone recent resection of tumor, whether at initial diagnosis or at the time of progression. This introduces a special set of considerations in choice of region for measurement. Gadolinium-enhanced MR imaging should be performed within the first 72 hours following surgery to minimize postoperative enhancement along the margin of the surgical cavity.12
Hyperintense T1-weighted postoperative blood products along the surgical margin can make it difficult to determine whether there is residual enhancing disease. Surgical cavities
should not be included in tumor measurement, but it is often difficult to determine the edge of the operative margin. Com-parison of T1-weighted images before and after gadolinium enhancement with fast spin-echo (FSE) T2-weighted images gives the most useful information in this regard.
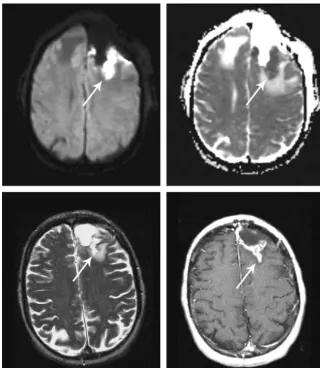
Areas of restricted diffusion along the margin of the surgi-cal cavity are present on diffusion-weighted images (DWI) in up to two thirds of patients on immediate postoperative scans following surgery for malignant gliomas and usually represent areas of infarction (Fig 2).13 Enhancement of the infarcted
tissue occurs in approximately one half of cases, can be seen within 1–2 weeks of surgery, and is a finding that can easily be misinterpreted as progressive tumor if the presence of the perioperative infarct is not realized. Thus, it is important to obtain and review the immediate postoperative DWI when new enhancement appears within 2– 4 weeks of surgery.13,14
Enhancing foci that have been treated with radiosurgery are usually excluded from measurement because of the possi-bility of radiation necrosis.
Technical Considerations
The same imaging technique must be used at every time point (ie, MR imaging and CT measurements must not be mixed and use of differing magnet strengths should be avoided). Measurements are typically made in the axial plane. The ac-quisition of 3-mm, skip 0-mm T1-weighted contrast-en-hanced images would improve resolution, particularly when dealing with smaller enhancing nodules. Higher resolution images increase the acquisition time from 3 minutes to 5– 6 minutes for 3-mm, skip 0-mm sections, but the improved res-olution is a strong argument in favor of these images.
Postcontrast axial images should be acquired at a standard-ized time interval after gadolinium injection, starting no less than 5 minutes after injection. Other sequences not affected by gadolinium (eg, FSE T2-weighted images and DWI performed for a total of 6 minutes) can be routinely acquired after con-trast injection to optimize scanner resources and to standard-ize the postcontrast interval. The same dose of gadolinium should be used for every study.
Timing of Imaging Studies and Confirmation of Response The frequency of imaging should take into account the inter-val during which a response might be detected as well as an estimate of the likely duration of response. In the large retro-spective study of Hess et al,6the median time to response (CR
⫹PR) in progressive malignant gliomas in patients was 14 weeks, with 74% of responses occurring by 26 weeks. A base-line study is usually required within 14 days before initiation of protocol treatment. In some cases, this will be the immedi-ate postoperative examination or, in others, a routine fol-low-up study demonstrating PD on current therapy. Fol-low-up studies in patients with malignant gliomas are commonly performed after every second cycle of treatment, which is usually every 8 weeks.
Validity of Imaging End Points in Clinical Trials
Radiographic response correlates with survival in newly diag-nosed anaplastic oligodendroglioma, in which response, longer survival, and loss of heterozygosity of chromosome 1p are relat-ed.15For newly diagnosed anaplastic astrocytomas, a study by the
Radiation Therapy Oncology Group16showed that patients with
no progression at 6 months had a median survival of 67 months versus a median survival of 19 months for patients who had shown progression by 6 months. Thus, for anaplastic gliomas, there is evidence that response to initial treatment correlates with survival. A study by Galanis et al5of the relationship between
response and survival in patients with newly diagnosed “enhanc-ing gliomas” (n⫽36; with low-grade glioma⫽25%, anaplastic astrocytomas⫽14%, and glioblastoma⫽61%) found no rela-tionship between the 2 categories of response (PR and SD) and survival but did observe a correlation between PD and shorter survival. However, these were studies of adjuvant therapy soon after diagnosis, not salvage therapy at the time of progression, whereas most phase II trials are conducted in patients with PD in the salvage setting.
Radiographic response is often used as an end point in the phase II setting with the assumption that it is a valid surrogate measure for improved overall survival. Grant et al17reviewed the
imaging studies of 136 patients with progressive gliomas follow-ing 2 cycles of nitrosourea-based therapy and found no correla-tion between TTP and survival. However, this study also docu-mented a relationship between PD and shorter survival. Shah et
al7found an association between 2-month PFS and survival but
no relationship between 6-month PFS and overall survival in pa-tients entered into a number of different clinical trials for progres-sive malignant gliomas. The latter fact suggests that 6 months may be too long an interval for response assessment in patients with progressive malignant gliomas. Two other large retrospec-tive studies have demonstrated a posiretrospec-tive correlation between re-sponse, PFS, and overall survival in patients with progressive high-grade gliomas.6,18Overall, the data support the validity of
response as a predictor of survival. Any measurement approach that is more sensitive to response would likely provide the best measure of effect.
Challenges with Novel Therapeutics
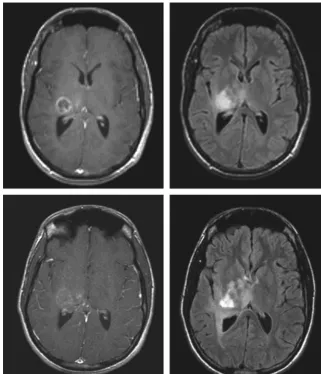
This review has focused on the use of gadolinium enhance-ment as the most useful characteristic for the measureenhance-ment of brain tumors in clinical trials. New therapies currently in clin-ical testing and moving into daily clinclin-ical practice highlight the shortcomings of enhancement as a measurement tool. A par-ticularly instructive example relates to the fact that inhibitors of vascular endothelial growth factor (VEGF), such as bevaci-zumab, produce a rapid decrease in the degree of contrast enhancement within malignant gliomas and in the extent of surrounding hyperintense T2-weighted signal intensity (Fig 3).19These effects, which are consistent with decrease in the
[image:5.594.52.373.41.409.2]clinical trials. It is very important to incorporate advanced techniques such as perfusion and permeability imaging20and
diffusion imaging into clinical trials of these agents to develop better ways of measuring biologic effects.
Conclusions
The measurement of brain tumors in clinical trials should be performed according to a standardized set of criteria. Sensitive volumetric measurement techniques are likely to improve the chance of identifying agents that effect tumor growth. New imaging techniques are needed to measure the effects of novel brain tumor therapies.
References
1. Batchelor T, Stanley K, Andersen J.Clinical trials in neuro-oncology.Curr Opin Neurol2001;14:689 –94
2. Miller AB, Hoogstraten B, Staquet M, et al.Reporting results of cancer treat-ment.Cancer1981;47:207–14
3. Therasse P, Arbuck SG, Eisenhauer EA, et al.New guidelines to evaluate the response to treatment in solid tumors: European Organization for Research and Treatment of Cancer, National Cancer Institute of the United States, Na-tional Cancer Institute of Canada.J Natl Cancer Inst2000;92:205–16 4. Macdonald DR, Cascino TL, Schold SC, et al.Response criteria for phase II
studies of malignant glioma.J Clin Oncol1990;8:1277– 80
5. Galanis E, Buckner JC, Maurer MJ, et al.Validation of neuroradiologic re-sponse assessment in gliomas: measurement by RECIST, two-dimensional, computer-assisted tumor area, and computer-assisted tumor volume meth-ods.Neuro Oncol2006;8:156 – 65
6. Hess KR, Wong ET, Jaeckle KA, et al.Response and progression in recurrent malignant glioma.Neuro Oncol1999;1:282– 88
7. Shah GD, Kesari S, Xu R, et al.Comparison of linear and volumetric criteria in assessing tumor response in adult high-grade gliomas.Neuro Oncol2006;8:38 – 46
8. Simon R.Optimal two-stage designs for phase II clinical trials.Control Clin Trials1989;10:1–10
9. Sorensen AG, Patel S, Harmath C, et al.Comparison of diameter and perimeter methods for tumor volume calculation.J Clin Oncol2001;19:551–57 10. Warren KE, Patronas N, Aikin AA, et al.Comparison of one-, two-, and
three-dimensional measurements of childhood brain tumors.J Natl Cancer Inst 2001;93:1401– 05
11. Ulmer S, Mavrakis A, Barker FG, et al.Incidence of multifocal lesions in ma-lignant glioma as detected by MRI.Neurology2006;66:A431
12. Forsyth PA, Petrov E, Mahallati H, et al.Prospective study of postoperative magnetic resonance imaging in patients with malignant gliomas.J Clin Oncol 1997;15:2076 – 81
13. Ulmer S, Braga TA, Barker FG, et al.Clinical and radiographic features of peritu-moral infarction following resection of glioblastoma.Neurology2006;67:1668 –70 14. Smith JS, Cha S, Mayo MC, et al.Serial diffusion-weighted magnetic resonance imaging in cases of glioma: distinguishing tumor recurrence from postresec-tion injury.J Neurosurg2005;103:428 –38
15. Cairncross JG, Ueki K, Zlatescu MC, et al.Specific genetic predictors of che-motherapeutic response and survival in patients with anaplastic oligodendro-gliomas.J Natl Cancer Inst1998;90:1473–79
16. Prados MD, Seiferheld W, Sandler HM, et al.Phase III randomized study of radiotherapy plus procarbazine, lomustine, and vincristine with or without BUdR for treatment of anaplastic astrocytoma: final report of RTOG 9404.Int J Radiat Oncol Biol Phys2004;58:1147–52
17. Grant R, Liang BC, Slattery J, et al.Chemotherapy response criteria in malig-nant glioma.Neurology1997;48:1336 – 40
18. Ballman KV, Buckner JC, Brown PD, et al.The relationship between six-month progression-free survival and 12-month overall survival end points for phase II trials in patients with glioblastoma multiforme.Neuro Oncol2007;9:29 –38 19. Pope WB, Lai A, Nghiemphu P, et al.MRI in patients with high-grade gliomas
treated with bevacizumab and chemotherapy.Neurology2006;66:1258 – 60 20. Mills SJ, Patankar TA, Haroon HA, et al.Do cerebral blood volume and
con-trast transfer coefficient predict prognosis in human glioma?AJNR Am J Neu-roradiol2006;27:853–58
[image:6.594.51.373.42.416.2]