MT Quality Estimation for Computer-assisted Translation:
Does it Really Help?
Marco Turchi, Matteo Negri, Marcello Federico FBK - Fondazione Bruno Kessler,
Via Sommarive 18, 38123 Trento, Italy
{turchi,negri,federico}@fbk.eu
Abstract
The usefulness of translation quality es-timation (QE) to increase productivity in a computer-assisted translation (CAT) framework is a widely held assumption (Specia, 2011; Huang et al., 2014). So far, however, the validity of this assumption has not been yet demonstrated through sound evaluations in realistic settings. To this aim, we report on an evaluation in-volving professional translators operating with a CAT tool in controlled but natural conditions. Contrastive experiments are carried out by measuring post-editing time
differences when: i) translation
sugges-tions are presented together with binary
quality estimates, and ii) the same
sug-gestions are presented without quality in-dicators. Translators’ productivity in the two conditions is analysed in a principled
way, accounting for the main factors (e.g.
differences in translators’ behaviour, qual-ity of the suggestions) that directly impact on time measurements. While the gen-eral assumption about the usefulness of QE is verified, significance testing results reveal that real productivity gains can be observed only under specific conditions.
1 Introduction
Machine translation (MT) quality estimation aims
to automatically predict the expected time (e.g. in
seconds) or effort (e.g. number of editing
opera-tions) required to correct machine-translated sen-tences into publishable translations (Specia et al., 2009; Mehdad et al., 2012; Turchi et al., 2014a; C. de Souza et al., 2015). In principle, the task has a number of practical applications. An intu-itive one is speeding-up the work of human trans-lators operating with a CAT tool, a software
de-signed to support and facilitate the translation pro-cess by proposing suggestions that can be edited by the user. The idea is that, since the suggestions can be useful (good, hence post-editable) or use-less (poor, hence requiring complete re-writing), reliable quality indicators could help to reduce the time spent by the user to decide which action to take (to correct or re-translate).
So far, despite the potential practical benefits, the progress in QE research has not been followed by conclusive results that demonstrate whether the use of quality labels can actually lead to noticeable productivity gains in the CAT framework. To the best of our knowledge, most prior works limit the analysis to the intrinsic evaluation of QE perfor-mance on gold-standard data (Callison-Burch et al., 2012; Bojar et al., 2013; Bojar et al., 2014). On-field evaluation is indeed a complex task, as
it requires: i) the availability of a CAT tool
ca-pable to integrate MT QE functionalities,ii)
pro-fessional translators used to MT post-editing,iii)
a sound evaluation protocol to perform
between-subject comparisons,1andiv)robust analysis
tech-niques to measure statistical significance under
variable conditions (e.g.differences in users’
post-editing behavior).
To bypass these issues, the works more closely related to our investigation resort to controlled and simplified evaluation protocols. For instance, in (Specia, 2011) the impact of QE predictions on translators’ productivity is analysed by measuring the number of words that can be post-edited in a fixed amount of time. The evaluation, however, only concentrates on the use of QE to rank MT outputs, and the gains in translation speed are mea-sured against the contrastive condition in which no QE-based ranking mechanism is used. In this arti-ficial scenario, the analysis disregards the relation
1Notice that the same sentence cannot be post-edited
twice (e.g. with/withoutquality labels) by the same translator without introducing a bias in the time measurements.
between the usefulness of QE and the intrinsic
fea-tures of the top-ranked translations (e.g. sentence
length, quality of the MT). More recently, Huang
et al. (2014) claimed a10%productivity increase
when translation is supported by the estimates of an adaptive QE model. Their analysis, however, compares a condition in which MT suggestions are presented with confidence labels (the two factors are not decoupled) against the contrastive condi-tion in which no MT suggescondi-tion is presented at all. Significance testing, moreover, is not performed.
The remainder of this work describes our on-field evaluation addressing (through objective measurements and robust significance tests) the two key questions:
• Does QE really help in the CAT scenario?
• If yes, under what conditions?
2 Experimental Setup
One of the key questions in utilising QE in the CAT scenario is how to relay QE information to the user. In our experiments, we evaluate a way of visualising MT quality estimates that is based on a color-coded binary classification (green vs. red) as an alternative to real-valued quality labels. In our
context, ‘green’ means that post-editing the
trans-lation is expected to be faster than transtrans-lation from
scratch, while ‘red’ means that post-editing the
translation is expected to take longer than trans-lating from scratch.
This decision rests on the assumption that the two-color scheme is more immediate than real-valued scores, which require some interpretation by the user. Analysing the difference between al-ternative visualisation schemes, however, is cer-tainly an aspect that we want to explore in the fu-ture.
2.1 The CAT Framework
To keep the experimental conditions as natural as possible, we analyse the impact of QE labels on translators’ productivity in a real CAT environ-ment. To this aim, we use the open-source Mate-Cat tool (Federico et al., 2014), which has been slightly changed in two ways. First, the tool has been adapted to provide only one single transla-tion suggestransla-tion (MT output) per segment, instead of the usual three (one MT suggestion plus two Translation Memory matches). Second, each sug-gestion is presented with a colored flag (green for
good, red for bad), which indicates its expected quality and usefulness to the post-editor. In the contrastive condition (no binary QE visualization), grey is used as the neutral and uniform flag color.
2.2 Getting binary quality labels.
The experiment is set up for a between-subject comparison on a single long document as follows. First, the document is split in two parts. The first part serves as the training portion for a bi-nary quality estimator; the second part is
re-served for evaluation. The training portion is
machine-translated with a state-of-the-art,
phrase-based Moses system (Koehn et al., 2007)2 and
post-edited under standard conditions (i.e.
with-out visualising QE information) by the same users involved in the testing phase. Based on their post-edits, the raw MT output samples are then la-beled as ‘good’ or ‘bad’ by considering the HTER (Snover et al., 2006) calculated between raw MT
output and its post-edited version.3 Our labeling
criterion follows the empirical findings of (Turchi et al., 2013; Turchi et al., 2014b), which indicate
an HTER value of0.4as boundary between
post-editable (HTER ≤ 0.4) and useless suggestions
(HTER>0.4).
Then, to model the subjective concept of qual-ity of different subjects, for of each translator we train a separate binary QE classifier on the labeled samples. For this purpose we use the Scikit-learn implementation of support vector ma-chines (Pedregosa et al., 2011), training our mod-els with the 17 baseline features proposed by Spe-cia et al. (2009). This feature set mainly takes into account the complexity of the source sentence
(e.g. number of tokens, number of translations per
source word) and the fluency of the target
trans-lation (e.g. language model probabilities). The
features are extracted from the data available at prediction time (source text and raw MT output) by using an adapted version (Shah et al., 2014) of the open-source QuEst software (Specia et al., 2013). The SVM parameters are optimized by cross-validation on the training set.
With these classifiers, we finally assign quality
flags to the raw segment translations in the test
2The system was trained with 60M running words from
the same domain (Information Technology) of the input doc-ument.
3HTER measures the minimum edit distance (# word
Average PET
(sec/word) coloredgrey 8.0869.592 p= 0.33
% Wins
[image:3.595.78.286.63.119.2]of colored 51.7 p= 0.039
Table 1: Comparison (Avg. PET and ranking)
be-tween the two testing conditions (withandwithout
QE labels).
portion of the respective document, which is even-tually sent to each post-editor to collect time and productivity measurements.
2.3 Getting post-editing time measurements.
While translating the test portion of the docu-ment, each translator is given an even and ran-dom distribution of segments labeled according to the test condition (colored flags) and segments la-beled according to the baseline, contrastive condi-tion (uniform grey flags). In the distribucondi-tion of the data, some constraints were identified to ensure the soundness of the evaluation in the two
condi-tions: i)each translator must post-edit all the
seg-ments of the test portion of the document,ii)each
translator must post-edit the segments of the test
set only once,iii)all translators must post-edit the
same amount of segments with colored and grey labels. After post-editing, the post-editing times are analysed to assess the impact of the binary col-oring scheme on translators’ productivity.
3 Results
We applied our procedure on an English user man-ual (Information Technology domain) to be trans-lated into Italian. Post-editing was performed in-dependently by four professional translators, so that two measurements (post-editing time) for each segment and condition could be collected.
Training and and test respectively contained 542
and847segments. Half of the847test segments
were presented with colored QE flags, with a
ra-tio of green to red labels of about75%‘good’ and
25%’bad’.
3.1 Preliminary analysis
Before addressing our research questions, we per-formed a preliminary analysis aimed to verify the reliability of our experimental protocol and the consequent findings. Indeed, an inherent risk of presenting post-editors with an unbalanced distri-bution of colored flags is to incur in unexpected
subconscious effects. For instance, green flags could be misinterpreted as a sort of pre-validation, and induce post-editors to spend less time on the corresponding segments (by producing fewer changes). To check this hypothesis we compared the HTER scores obtained in the two conditions (colored vs. grey flags), assuming that noticeable differences would be evidence of unwanted psy-chological effects. The very close values mea-sured in the two conditions (the average HTER is
respectively 23.9and24.1) indicate that the
pro-fessional post-editors involved in the experiment did what they were asked for, by always changing what had to be corrected in the proposed sugges-tions, independently from the color of the associ-ated flags. In light of this, post-editing time varia-tions in different condivaria-tions can be reasonably as-cribed to the effect of QE labels on the time spent by the translators to decide whether correcting or re-translating a given suggestion.
3.2 Does QE Really Help?
To analyse the impact of our quality estimates on translators’ productivity, we first compared the av-erage post-editing time (PET – seconds per word) under the two conditions (colored vs. grey flags). The results of this rough, global analysis are re-ported in Table 1, first row. As can be seen, the av-erage PET values indicate a productivity increase
of about1.5seconds per word when colored flags
are provided. Significance tests, however, indicate
that such increase is not significant (p > 0.05,
measured by approximate randomization (Noreen, 1989; Riezler and Maxwell, 2005)).
An analysis of the collected data to better un-derstand these results and the rather high average
PET values observed (8to9.5secs. per word)
evi-denced both a large number of outliers, and a high
PET variability across post-editors.4 To check
whether these factors make existing PET differ-ences opaque to our study, we performed further analysis by normalizing the PET of each
transla-tor with therobust z-scoretechnique (Rousseeuw
and Leroy, 1987).5 The twofold advantage of
4We consider as outliers the segments with a PET lower
than 0.5 or higher than30. Segments with unrealistically short post-editing times may not even have been read com-pletely, while very long post-editing times suggest that the post-editor interrupted his/her work or got distracted. The average PET for the four post-editors ranges from2.266to
13.783. In total,48segments have a PET higher than30, and
6segments were post-edited in more than360seconds.
46 47 48 49 50 51 52 53 54 55 56
0.1 0.2 0.3 0.4 0.5 0.6 0.7 0.8 0.9 1
%
W
in
s o
f C
ol
or
ed
HTER
LONG MEDIUM SHORT
46 47 48 49 50 51 52 53 54 55 56
0.1 0.2 0.3 0.4 0.5 0.6 0.7 0.8 0.9 1
%
W
in
s o
f C
ol
or
ed
HTER
[image:4.595.73.531.63.196.2]LONG MEDIUM SHORT
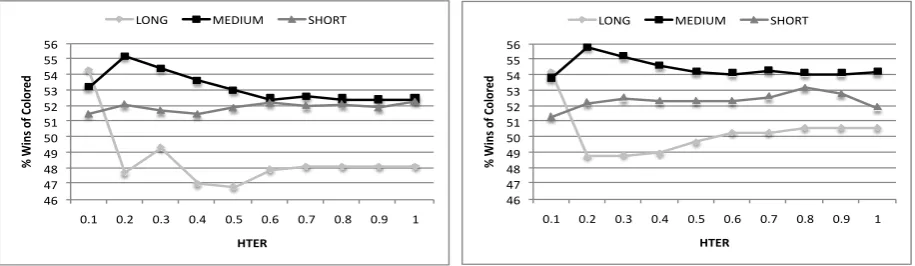
Figure 1: % wins of colored with respect to length and quality of MT output. Left: all pairs. Right: only pairs with correct color predictions.
this method is to mitigate idiosyncratic differences in translators’ behavior, and reduce the influence of outliers. To further limit the impact of out-liers, we also moved from a comparison based on average PET measurements to a ranking-based method in which we count the number of times the segments presented with colored flags were post-edited faster than those presented with grey
flags. For each of the (PET colored, PET grey)
pairs measured for the test segments, the
percent-age of wins (i.e. lower time) of PET colored is
calculated. As shown in the second row of Ta-ble 1, a small but statistically significant difference between the two conditions indeed exists.
Although the usefulness of QE in the CAT framework seems hence to be verified, the extent
of its contribution is rather small (51.7%of wins).
This motivates an additional analysis, aimed to verify if such marginal global gains hide larger lo-cal productivity improvements under specific con-ditions.
3.3 Under what Conditions does QE Help?
To address this question, we analysed two im-portant factors that can influence translators’ pro-ductivity measurements: the length (number of tokens) of the source sentences and the quality (HTER) of the proposed MT suggestions. To
this aim, all the (PET colored, PET grey) pairs
were assigned to three bins based on the length of
the source sentences: short (length≤5), medium
(5<length≤20), and long (length>20). Then, in
each bin, ten levels of MT quality were
identi-fied (HTER ≤0.1, 0.2,. . ., 1). Finally, for each
bin and HTER threshold, we applied the
ranking-the PET of each segment ranking-the post-editor median and dividing by the post-editor median absolute deviation (MAD).
based method described in the previous section. The left plot of Figure 1 shows how the “% wins of colored” varies depending on the two factors on all the collected pairs. As can be seen, for MT sug-gestions of short and medium length the
percent-age of wins is always above50%, while its value is
systematically lower for the long sentences when
HTER>0.1. However, the differences are
statis-tically significant only for medium-length
sugges-tions, and when HTER>0.1. Such condition, in
particular when 0.2<HTER≤0.5, seems to
rep-resent the ideal situation in which QE labels can actually contribute to speed-up translators’ work. Indeed, in terms of PET, the average
productiv-ity gain of 0.663secs. per word measured in the
[0.2−0.5] HTER interval is statistically
signifi-cant.
Although our translator-specific binary QE clas-sifiers (see Section 2) have acceptable
perfor-mance (on average80%accuracy on the test data
for all post-editors),6 to check the validity of our
conclusions we also investigated if, and to what extent, our results are influenced by classification errors. To this aim, we removed from the three bins those pairs that contain a misclassified
in-stance (i.e. the pairs in which there is a mismatch
between the predicted label and the true HTER
measured after post-editing).7
The results obtained by applying our ranking-based method to the remaining pairs are shown in the right plot of Figure 1. In this “ideal”, error-free scenario the situation slightly changes (unsurpris-ingly, the “% wins of colored” slightly increases,
6Measured by comparing each predicted binary label with
the ‘true’ label obtained applying the0.4HTER threshold as a separator between good and bad MT suggestions.
7The three bins contained 502, 792, 214 pairsbefore
especially for long suggestions for which we have the highest number of misclassifications), but the overall conclusions remain the same. In particular, the higher percentage of wins is statistically sig-nificant only for medium-length suggestions with
HTER>0.1 and, in the best case (HTER≤0.2) it is
about56.0%.
4 Conclusion
We presented the results of an on-field evalua-tion aimed to verify the widely held assumpevalua-tion that QE information can be useful to speed-up MT post-editing in the CAT scenario. Our results suggest that this assumption should be put into perspective. On one side, global PET measure-ments do not necessarily show statistically
signif-icant productivity gains,8 indicating that the
con-tribution of QE falls below expectations (our first
contribution). On the other side, an in-depth anal-ysis abstracting from the presence of outliers and the high variability across post-editors, indicates that the usefulness of QE is verified, at least to
some extent (our second contribution). Indeed,
the marginal productivity gains observed with QE at a global level become statistically significant in specific conditions, depending on the length (be-tween 5 and 20 words) of the source sentences and
the quality (0.2<HTER≤0.5) of the proposed MT
suggestions (our third contribution).
Acknowledgements
This work has been partially supported by the EC-funded projects MateCat (FP7 grant agreement no. 287688) and QT21 (H2020 innovation pro-gramme, grant agreement no. 645452).
References
Ondrej Bojar, Christian Buck, Chris Callison-Burch, Christian Federmann, Barry Haddow, Philipp Koehn, Christof Monz, Matt Post, Radu Soricut, and Lucia Specia. 2013. Findings of the 2013 Workshop
on Statistical Machine Translation. InProceedings
of the 8thWorkshop on Statistical Machine
Transla-tion, WMT-2013, pages 1–44, Sofia, Bulgaria.
Ondrej Bojar, Christian Buck, Christian Federmann, Barry Haddow, Philipp Koehn, Johannes Leveling, Christof Monz, Pavel Pecina, Matt Post, Herve Saint-Amand, Radu Soricut, Lucia Specia, and Aleˇs Tamchyna. 2014. Findings of the 2014 workshop
8Unless, for instance, robust and non-arbitrary methods to
identify and remove outliers are applied.
on statistical machine translation. InProceedings of the Ninth Workshop on Statistical Machine
Transla-tion, pages 12–58, Baltimore, Maryland, USA.
Jos´e G. C. de Souza, Matteo Negri, Marco Turchi, and Elisa Ricci. 2015. Online Multitask Learning For
Machine Translation Quality Estimation. In
Pro-ceedings of the 53rd Annual Meeting of the Associa-tion for ComputaAssocia-tional Linguistics), Beijing, China.
Chris Callison-Burch, Philipp Koehn, Christof Monz, Matt Post, Radu Soricut, and Lucia Specia. 2012. Findings of the 2012 Workshop on Statistical Ma-chine Translation. InProceedings of the 7th
Work-shop on Statistical Machine Translation (WMT’12), pages 10–51, Montr´eal, Canada.
Marcello Federico, Nicola Bertoldi, Mauro Cettolo, Matteo Negri, Marco Turchi, Marco Trombetti, Alessandro Cattelan, Antonio Farina, Domenico Lupinetti, Andrea Martines, Alberto Massidda, Hol-ger Schwenk, Lo¨ıc Barrault, Frederic Blain, Philipp Koehn, Christian Buck, and Ulrich Germann. 2014.
The MateCat tool. InProceedings of COLING 2014,
the 25th International Conference on Computational Linguistics: System Demonstrations, pages 129– 132, Dublin, Ireland.
Fei Huang, Jian-Ming Xu, Abraham Ittycheriah, and Salim Roukos. 2014. Adaptive HTER Estimation
for Document-Specific MT Post-Editing. In
Pro-ceedings of the 52ndAnnual Meeting of the
Associa-tion for ComputaAssocia-tional Linguistics (Volume 1: Long Papers), pages 861–870, Baltimore, Maryland.
Philipp Koehn, Hieu Hoang, Alexandra Birch, Chris Callison-Burch, Marcello Federico, Nicola Bertoldi, Brooke Cowan, Wade Shen, Christine Moran, Richard Zens, Chris Dyer, Ondˇrej Bojar, Alexandra Constantin, and Evan Herbst. 2007. Moses: Open Source Toolkit for Statistical Machine Translation. In Proceedings of the 45th Annual Meeting of the
ACL on Interactive Poster and Demonstration Ses-sions, pages 177–180, Stroudsburg, PA, USA.
Yashar Mehdad, Matteo Negri, and Marcello Fed-erico. 2012. Match without a Referee: Evaluating MT Adequacy without Reference Translations. In
Proceedings of the Machine Translation Workshop (WMT2012), pages 171–180, Montr´eal, Canada.
Eric W. Noreen. 1989. Computer-intensive methods for testing hypotheses: an introduction. Wiley Inter-science.
Fabian Pedregosa, Gal Varoquaux, Alexandre Gram-fort, Vincent Michel, Bertrand Thirion, Olivier Grisel, Mathieu Blondel, Peter Prettenhofer, Ron Weiss, Vincent Dubourg, Jake Vanderplas, Alexan-dre Passos, David Cournapeau, Matthieu Brucher, Matthieu Perrot, and douard Duchesnay. 2011.
Scikit-learn: Machine Learning in Python. Journal
Stefan Riezler and John T Maxwell. 2005. On some Pitfalls in Automatic Evaluation and
Signifi-cance Testing for MT. In Proceedings of the ACL
workshop on intrinsic and extrinsic evaluation mea-sures for machine translation and/or summarization, pages 57–64.
Peter J Rousseeuw and Annick M Leroy. 1987.Robust
regression and outlier detection, volume 589. John Wiley & Sons.
Kashif Shah, Marco Turchi, and Lucia Specia. 2014. An efficient and user-friendly tool for machine
trans-lation quality estimation. In Proceedings of the
Ninth International Conference on Language Re-sources and Evaluation (LREC’14), Reykjavik, Ice-land.
Matthew Snover, Bonnie Dorr, Richard Schwartz, Lin-nea Micciulla, and John Makhoul. 2006. A Study of Translation Edit Rate with Targeted Human An-notation. InProceedings of Association for Machine Translation in the Americas, pages 223–231, Cam-bridge, Massachusetts, USA.
Lucia Specia, Nicola Cancedda, Marc Dymetman, Marco Turchi, and Nello Cristianini. 2009. Es-timating the Sentence-Level Quality of Machine
Translation Systems. In Proceedings of the 13th
Annual Conference of the European Association for Machine Translation (EAMT’09), pages 28–35, Barcelona, Spain.
Lucia Specia, Kashif Shah, Jos´e G.C. de Souza, and Trevor Cohn. 2013. QuEst - A Translation
Qual-ity Estimation Framework. In Proceedings of the
51stAnnual Meeting of the Association for
Compu-tational Linguistics: System Demonstrations, ACL-2013, pages 79–84, Sofia, Bulgaria.
Lucia Specia. 2011. Exploiting Objective Annotations for Minimising Translation Post-editing Effort. In
Proceedings of the 15thConference of the European
Association for Machine Translation (EAMT 2011), pages 73–80, Leuven, Belgium.
Marco Turchi, Matteo Negri, and Marcello Federico.
2013. Coping with the Subjectivity of Human
Judgements in MT Quality Estimation. In
Proceed-ings of the 8th Workshop on Statistical Machine
Translation, pages 240–251, Sofia, Bulgaria. Marco Turchi, Antonios Anastasopoulos, Jos´e G. C. de
Souza, and Matteo Negri. 2014a. Adaptive Qual-ity Estimation for Machine Translation. In Proceed-ings of the 52nd Annual Meeting of the Association for Computational Linguistics (Volume 1: Long Pa-pers), pages 710–720, Baltimore, Maryland, USA. Marco Turchi, Matteo Negri, and Marcello Federico.
2014b. Data-driven Annotation of Binary MT