Hedge fund activism, voice, and value
creation
Karpouzis, Efstathios and Bouras, Chris and Kanas, Angelos
University of Piraeus
6 March 2019
Online at
https://mpra.ub.uni-muenchen.de/92576/
Efstathios Karpouzis
1,*, Chris Bouras
1, Angelos Kanas
1,2Abstract
We construct a novel hand-collected large data set of 205 U.S. hedge funds and 1031 activist events over the period 2005-2013, which records both the Schedule 13D filing date and the voicing date, and explore the role of voicing in value creation. We employ alternative inferential statistical approaches, including parametric, non-parametric, and heteroscedasticity-robust tests along with bootstrapping. We reveal that the voice date is important in creating short-term firm value, and provide strong evidence that voicing is associated with positive abnormal returns. These abnormal returns are approximately 1.11%, and are higher than the abnormal returns around the Schedule13D date by approximately 64%. There is also evidence of positive voice abnormal returns for voicing events which lead Schedule 13D events. The results are robust to models of abnormal returns allowing for leverage effects, and to alternative inferential statistical procedures. These findings suggest that voicing leads to information revelation, with implications for U.S. stock market arbitrage and the regulation for hedge fund activism information disclosure.
Keywords: Hedge Fund activism, Schedule13D, voice, abnormal returns, information revelation.
JEL Classifications: G14, G23, G3
6 March 2018
_______________
1: University of Piraeus
2: Parliamentary Budget Office, Hellenic Parliament
1. Introduction
Hedge fund activism is an investment strategy where a hedge fund intervenes in a target firm
with a minority stake and influences the firm’s internal decisions. The main objective of this intervention is to reduce agency costs, increase firm’s performance and maximize shareholder
value. Prior literature suggests that increased management monitoring by shareholder activists
reduces agency and incentive costs (Brav et al. (2008); Gilson and Gordon (2013)), especially when activists gain board representation (Goodwin (2016)). Top activist investors target firms
with higher agency costs and are more successful in their activist goals when engaging in monitoring management (Krishnan et al. (2016)). Taking the Schedule 13D1 filing date as the
critical date of an activist event, empirical contributions have documented that the stock
market reacts favorably to activism, yielding positive average abnormal returns for target firms around that date, and suggesting that hedge fund activism creates value (Becht et al.
(2008); Brav et al. (2008a); Brav et al. (2008b); Clifford (2008); Klein and Zur (2009); Greenwood and Schor (2009); Boyson and Mooradian (2011); Gow et al. (2014); Bebchuk et
al. (2015); Becht et al. (2017))2. Although short-term effects have been examined around the
Schedule 13D filing date, there is hardly any evidence on the short-term abnormal returns surrounding the amendment dates.
The present paper departs from the previous literature in that it considers as critical dates of
an activist event not only the Schedule 13D date but also the amendment date that contains voice. We define this date as voice date. In fact, we expect voice to carry at least the same
importance as the Schedule 13D. The motivation for considering the voice date arises from the fact that this is the date when a hedge fund clearly asks, proposes, differentiates or
demands operational, strategic, corporate governance or capital allocation changes in the
“Item 4” section3. Through voice, activists become more specific about their objectives by
revealing their internal assessment and disclosing specific plans or proposals for the target firm. So, we hypothesize that voice functions as an information revelation mechanism. In
1 Schedule 13D is commonly referred to as a “beneficial ownership report”. The term "beneficial owner" is defined under SEC rules and includes any person who directly or indirectly shares voting power or investment power (the power to sell the security) - (SEC). Investors, who acquire beneficial
ownership of more than 5% of a voting class of a company’s equity securities registered under Section
12 of the Securities Exchange Act of 1934, are required to disclose a Schedule 13D with the SEC within 10 days from the transaction (https://www.sec.gov/fast-answers/answerssched13htm.html). 2 As the event window becomes longer, abnormal returns increase (Brav et al. (2008); Krishnan et al. (2016)). Interestingly, positive abnormal returns are obtained even when hedge funds had previously disclosed a smaller stake at the target firm through the 13F filing (Brav et al. (2008)). Moreover, significant performance improvements are obtained when hedge funds switch from passive (Schedule 13G filing) to active (Schedule 13D filing) with no ownership change (Brav et al. (2015)). These
performance improvements occurred due to the hedge fund’s decision to switch from passive to active;
otherwise they would not have been implemented.
contrast, if the hedge fund activists do not state any specific plans or proposals through the
Schedule 13D or Schedule 13D/A filings, we define those interventions as non-voice. In these interventions, activists may either make amendments for beneficial ownership changes or not
make amendments at all until exit. So far, the vast majority of existing literature assumes that the activism engagement process is initiated by the Schedule 13D filing and terminates with
exit. However, Schedule 13D filings which do not contain voice, simply signal an activist intention, which may occur or not. The stock price of the targeted firm at Schedule 13D filing date should reflect the expected value of two mutually exclusive events: the specific
intervention activist purpose and the lack of such disclosed purpose. On the other hand, voice
specifies the activism field since hedge funds disclose specific proposalsand/or plans. The stock price of the targeted firm at voice date should reflect the expected value of a successful,
a failed or a settlement outcome, multiplied by the corresponding probabilities of occurrence. Although both dates are considered as dates of the activism engagement process initiation,
they reflect different expected future outcomes. The goal of this paper is to investigate how investors react to hedge fund activism (voice) and to the announcement of a possible activism (Schedule 13D filing without voice). These two different initiation engagement dates are also
compared in terms of abnormal return behavior.
Further motivation for focusing on the voice date is provided by the following examples of anecdotal evidence. On August 22, 2011, Starboard Value LP filed a Schedule 13D indicating
an 8.9% beneficial ownership of Mips Technologies Inc. In the “Item 4” section, the reporting persons expressed their belief that that the shares were undervalued and did not have any
plans or proposals4. On September 13, 2011, Starboard Value LP filed a Schedule 13D/A
stating that they delivered a letter to the board of the company on September 12, 2011
nominating specific people for election to the company’s Board of Directors, and urging the company to discontinue pursuing acquisitions, focus on improving its operating performance
and consider buying back shares. As a result, the stock return of Mips Technologies on that date (September, 12) was 6.19%, much higher than that on the Schedule 13D filing date (August, 22) which was 0.46%. This echoes the relatively important role of voice in driving
market responses. We consider this event as a voice event, and set September 12, 2011 as voice date where Starboard Value LP delivered the letter to Mips Technologies Inc5.
4https://www.sec.gov/Archives/edgar/data/1059786/000092189511001772/sc13da106297098_09122
011.htm
The second example refers to Atlantic Investment Management Inc. (AIM) filing a Schedule
13D on September 14, 2012, indicating a 5,05% beneficial ownership of Rockwood Holdings, Inc. On that date, the firm’s stock return was +1.84%. In the “Item 4” section, the reporting
persons stated that they acquired the stock for investment purposes and did not have any current plans6. On November 19, 2012, AIM filed an amendment where a beneficial owner
increase was stated to 6.05% without amending the “Item 4” section. On that date, the stock return was +2%. AIM exited on January 29, 2013 filing a Schedule 13D/A stating a beneficial ownership of 4.89%. On the exit date the stock return was +0.5% We consider this as a
non-voice event since AIM did not state any specific plans in any of its filings’ “Item 4” section,
and use the initial Schedule 13D date as the non-voice date.
We carefully collected a large sample of 205 U.S. hedge funds and 1031 activist events over the period 2005-2013. This data set is novel because it records both the Schedule 13D and the
voice dates, and includes 379 voice and 652 non-voice events. Using this sample, we explored whether positive abnormal returns exist surrounding the voice date. Our findings strongly
suggest that there exist positive abnormal returns not only surrounding the Schedule 13D date
but also the voice date, suggesting value creation around the voice date as well. The abnormal returns around the voice date are approximately 1.11%, and are higher than the abnormal returns around the Schedule 13D date by approximately 64%. These findings are robust to
alternative asset pricing models controlling for size, book to market, momentum, and GARCH-in-Mean effects. They are also robust to alternative parametric and non-parametric
statistical procedures for inference on the significance of abnormal returns, including the Wilcoxon signed rank test, and the rank test procedure of Corrado (1989) and Corrado and
Zivney (1992). The abnormal returns of Schedule13D and voice dates are also statistically compared by means of a battery of heteroscedasticity and skewness-robust tests. We
document significant differences in the market inefficiency patterns.
Our interpretation is
that the Schedule 13D date reveals only partial information, with the remainder of
information being revealed at voice.
As we record both the voice and the Schedule 13Ddates, we also consider the case of 93 events in which the voice date leads the Schedule 13D filing date by less than 10 trading days. We find evidence that for these events as well there
exist positive voice abnormal returns, suggesting that voicing, regardless of whether it occurs before or after the Schedule 13D date, entails information revelation which triggers market
response. These results are in line with Becht et al. (2017) who, using a sample of international activist events, found that positive short-term abnormal returns exist surrounding
the amendment dates when activists disclose outcomes, such as board representation and
takeovers, through amendments.
Our results have implications for information revelation, market quality and arbitrage
opportunities, and regulation for hedge fund activism mandatory disclosure. The voice date and the Schedule 13D date, which in general do not coincide, are two important hallmarks of
mandatory disclosure regulation for hedge fund activism. Positive abnormal returns on both dates, and not only the Schedule 13D date, indicate opportunities for arbitrage. Arbitrage is
detrimental for stock market quality. As mandatory disclosure regulation should, in principle, aim at improving market quality, our findings point to the need of revisiting the way that hedge fund activism related information is disclosed in the market. This need is in line with
the ongoing debate on whether mandatory disclosure regulation has net positive or negative effects on stock market quality (Enriques and Gilotta (2015); Greenstone et al. (2006)), as
well as with recent legal scholars' recommendations for significant modification of U.S. securities markets regulation (Mahoney (1997)).
The remainder of the paper is as follows. Section 2 discusses the data set and the voice date. Section 3 outlines the methodology for abnormal returns, spells out the hypotheses to be
tested, and discusses the statistical procedures. Section 4 reports the empirical findings, discusses their implications, and makes a regulatory policy recommendation. Section 5
provides several robustness checks, including various GARCH-type models for calculating abnormal returns, and non-parametric tests for statistical inference. Section 6 concludes.
2. The data set, and voice dates.
2.1. Compiling the data set
We obtained Schedule 13D filings between January 1, 2005 and December 31, 2013 using the
Historical SEC Edgar Archives from the Edgar Database of the SEC7. Our
search for “SC
13D” gave us 11.700 filers from a total of 19.352 filings8.
The next step was to identify the hedge funds9. Although in the literature there is not a
commonly accepted definition for hedge funds (Brav et al. (2008a)), we formed our sample of
hedge funds following Brunnermeier and Nagel (2004), and Griffin and Xu (2009). We
7https://www.sec.gov/cgi-bin/srch-edgar
8 We manually downloaded the list of Schedule 13D filers searching for “SC 13D” per month for the research period since there is a limitation of 4000 documents.
9The term 'hedge fund' refers to privately organized pooled investment vehicles, administered by
professional managers, and not widely available to the public. Hedge funds do not fall in the regulation
searched the Investment Adviser Public Disclosure website10 for each of the “Reporting
Persons”11 of the Schedule 13D filings and included in our sample only firms that were
registered as investment advisers with the SEC and thus, filed the ADV form12. Next, we
searched the “Item 5” section (“Information About Your Advisory Business - Employees,
Clients, and Compensation”) and included in our sample only those firms that at least 50% of their clients were “Other Pooled Investment Vehicles (e.g., hedge funds)” or “High Net
Worth Individuals” and charged performance-based fees.
On the basis of these steps, we identified 321 “pure-play” hedge funds13 which filed a total of
2.098 Schedule 13D filings. We excluded from our sample financial firms14, private firms and
activist events that were still live at the end of December 2013. Our final sample consists of
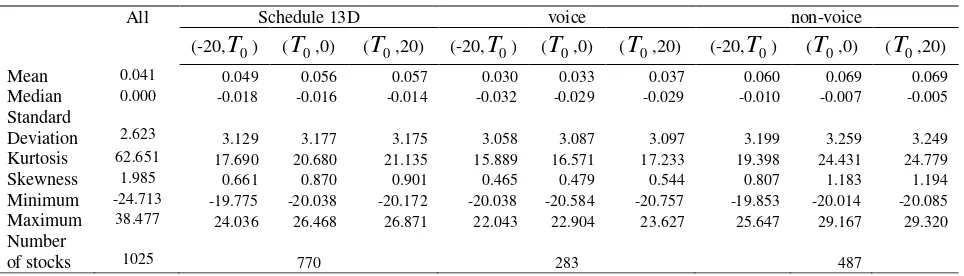
205 hedge funds and 1.031 activist events (379 voice and 652 non-voice events). The stock prices of our sample were downloaded from Thomson DataStream (TDS). Descriptive
statistics for all stock returns and for the stock returns that comprise each event-based category are reported in Table 1, and indicate evidence of non-normality.
2.2. Voice dates
Hedge funds follow different strategies in order to maximize shareholder value and increase
firm’s performance. These strategies concern the hedge funds’ plans or proposals for the
target firm and the timing of their disclosure. Plans or proposals must be disclosed in the
“Item 4” section, and contain changes in a firm’s corporate governance (i.e. changes in board structure and composition), strategy (i.e. sell of company, spin-off of a subsidiary), capital
allocation (i.e. buy back shares, special dividends) and operational performance. There are many cases though, where hedge funds exit the target firm without publicly stating any of the
above objectives.
The timing of disclosure varies according to the activists’ strategies. Activists could disclose
their objectives either in their initial Schedule 13D filing following a more offensive agenda, or later by filing an amendment stating their objectives publicly15. Since investors have a
10https://www.adviserinfo.sec.gov/IAPD/default.aspx
11 The ‘Reporting Persons” are stated in the “Item 2’ section (“Identity and Background”) of the Schedule 13D filing.
12 Form ADV is the uniform form used by investment advisers to register with both the Securities and Exchange Commission (SEC) and state securities authorities. For example, David Knott was the filer of a Schedule 13D filing on January 11, 2008 concerning Pet DRx Corp. The “Reporting Persons” of this filing where David Knott and Dorset Management Corporation (DMC). DMC fulfilled our criteria.
If we had not followed this procedure, we would have excluded David’s Knott Schedule 13D filings
from our sample.
13 Ben-David, Itzhak, et al. (2013) 14 SIC code 6000 to 6799
day window to file their beneficial ownership with the U.S. Securities and Exchange
Commission (SEC), the disclosure date, which we define as the voice date, does not necessarily match with the Schedule 13D or the Schedule 13D/A filing date.
We search for voice in “Item 4” section (Purpose of Transaction) of the initial Schedule 13D, its amendments (Schedule 13D/A) and the attached Exhibits. Activist interventions are
usually followed by amendments (Schedule 13D/A) where hedge funds make material
changes in facts set forth in the initial Schedule 13D filing16
.
If a hedge fund states the exactdate of voice in these filings we consider this date as the voice date, otherwise we use the
filing date. We hypothesize that voice events generate positive short-term abnormal returns, since important information becomes available to investors at the voice date. We include in our sample only the first voice incident of an activist intervention.
In our voice events, the average difference between the identified voice date and the Schedule 13D date is + 40 trading days or 56 calendar days, namely the voice date lags the Schedule
13D date by 40 trading days. Importantly, we identified 93 events in which voicing leads
Schedule 13D by 1 to 10 trading days, namely the voice day is in the space (-1, -10) of the
Schedule 13D day. This point is taken into consideration when assessing the statistical significance of abnormal returns of voice; by looking not only at all voice events but also at
this category of voice events leading the Schedule 13D events by 1 to 10 days.
3. Methodology
3.1. Abnormal returns of targeted firms
Our objective is to explore whether there exist statistically significant abnormal returns for the targeted firm around the hedge fund activism announcement date (Schedule 13D date), the
announcement of voice activism (voice date), and the ex-post announcement that hedge fund activism did not eventually happen in terms of voice (non-voice). The time period of interest
for which we observe the three event types, denoted as the event period, covers 20 pre-event days (day -20 to day -1), the event date (day 0), and 20 post-event days (day 1 to day 20). The
event window is expanded by 20 days prior to the event in order to capture possible information leaks, and by 20 days after the event to account for possible delayed response of
investors to announcements.
16 Such changes may include changes in their beneficial ownership and plans or proposals stated in
Abnormal returns are assessed in terms of the realized returns and the returns that would be
normally expected by the market. Following Brown and Warner (1980), an abnormal return
it
AR
is defined as the difference between the actual returnR
itof stock i at the event day tand the expected stock return at the event day t predicted by an estimated asset pricing model:
AR
it
R
it
E
R
itD
t
(1)
where
R
it
100
*
log
P
itP
it1
,
P
it is the actual price of stock i at event day t , i= 1,2,…,Nwith N the total number of stocks, while
E
R
itD
t
denotes the expected stock returns giventhe information set
D
t available at time period t. The expected returns represent the “normal”returns, namely the returns that would be anticipated if no event took place. The expected returns are predictions for the event day, generated by an asset pricing model fitted to the
actual stock returns over an estimation window. The estimation window represents the sample proportion of the data that precedes the event period. In this paper, the length of the
estimation window is determined in terms of data availability. In particular, the estimation period for each stock starts at the first available stock return observation, and ends 21 days
before the announcement date. Our results are also verified by using an estimation window of fixed length to calculate the abnormal returns.
Abnormal stock returns of the targeted firms are calculated using the market model and the multi-factor model of Carhart (1997). The market model assumes that the returns of each
stock are linearly related to the market portfolio returns. The following linear regression model is estimated by least squares
Rit a0
1
RmtRft
uit (2)where
R
mtdenotes the S&P 500 market index returns, and Rftdenotes the risk –free rate.In the Carhart (1997) model, the conventional market model is enhanced by the size, value,
and momentum factors:
Rit a0
1
Rmt Rft
2SMBt
3HMLt
4MOMt uit, (3)where
SMB
tdenotes the size factor - the difference between the returns on portfolios basedon stocks with small market capitalization and stocks with big market capitalization,
HML
trepresents the value factor - the difference between the returns on portfolios based on stocks
represents the momentum factor - the difference between the returns on portfolios of the
winners and losers of the previous year.
We finally consider the GARCH-in-Mean model, as asset pricing theory suggests that higher
risk has to be compensated with a higher expected return. Thus, we include a measure of stock return volatility as a term in the generating mechanism of expected returns. Lundblad
(2007) provides evidence supporting the adoption of the GARCH-in-Mean model, and shows
that market’s risk premium and conditional volatility are positively related. Ang et al. (2006) document that market volatility is a priced factor of the cross-sectional stock returns and therefore, market volatility should be included in a pricing model in addition to the market factor. Adrian and Rosenberg (2008) decompose market volatility into two factors, and find
that the CAPM extended by these two factors price stock returns better than other pricing models. Motivated by these empirical findings, we consider the following specification for
the returns generating mechanism17
2 3 4 5,
1
0 mt ft t t t it it
it
a
R
R
SMB
HML
MOM
h
u
R
(3a)
it 1/2,
itit
h
u
(3b)
, 1 2 2
1 1
0
it it
it k u h
h
(3c)
where
it is a sequence of random variables which are assumed to be independent andidentically distributed as Student’s t with unknown degrees of freedom, while
h
it is thesequence of conditional variances which evolve as a GARCH (1, 1) process. The constant
k
0,as well as the ARCH and GARCH coefficient parameters
i,
i
1
,
2
,
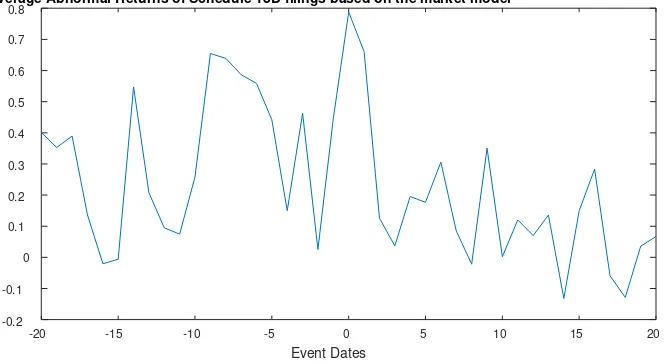
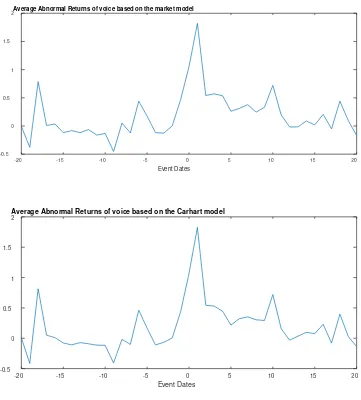
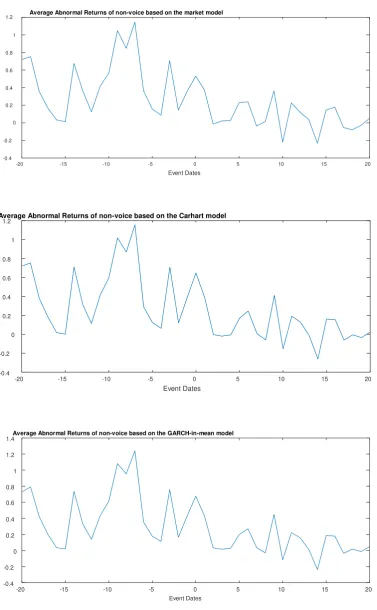
are estimated using the quasi-maximum likelihood method.Figures 1, 2, and 3 provide a pictorial representation of the abnormal returns for the Schedule
13D, voice and non-voice events, calculated using these 3 alternative models for the period
(-20, +20) in relation to each event. Based on these abnormal returns, we next proceed to formulating and testing the hypotheses of interest.
3.2. Market responses to Schedule 13D, voice, and non-voice: Hypotheses and testing.
Our objective is to investigate the stock market response to the announcement of voice
activism initiation in relation to other hedge fund activism announcements, such as the initial Schedule 13D filings announcement (Schedule 13D), and the announcement where hedge
funds did not eventually disclose any plans or proposals (non-voice) until exit. This is done by testing the following null hypotheses:
H
0A:
St
0
,
againstH
1A:
St
0
, (4)
H
0B:
Vt
0
,
againstH
1B:
Vt
0
, (5)
H
0C:
NVt
0
,
againstH
1C:
NVt
0
, (6)where
jt
E
AR
jt,
j
V
,
S
,
NV
,
denotes the expected value of the abnormal returns ofthe specific event-based category j at event date t, with V, S, NV denoting the stocks which comprise the voice, Schedule 13D and non-voice event categories, respectively.
The null hypothesis
H
0A states that the stock market does not respond to the announcementof hedge fund activism initiation based on the information at the Schedule 13D filings announcements. Similarly, the stock market is hypothesized not to respond to voice
announcements or the announcements of hedge fund activism which eventually does not take
place under null hypotheses
H
0B andH
0C, respectively. The null hypotheses (4)-(6) areformulated based on the fact that an event will have no impact on stock returns if the average of the cross-sectional abnormal returns at the particular date is equal to zero.
Parametric and non-parametric tests are employed to examine the no mean event effect hypotheses. The parametric t-statistic is defined as
* *t t
s
N
test
t
(7)where
1
,
1
*
Ni it
t
AR
N
and
Nt
t it
t
AR
N
s
1
2 * *
1
1
.The test-statistic is computed by regressing the abnormal returns on a constant and then
testing the statistical significance of the constant parameter. Under the null hypothesis that the mean abnormal returns are equal to zero, the test statistic is distributed as Student’s t with N–
We also consider an additional testing approach which relies on the non-parametric Wilcoxon
signed-rank test (Wilcoxon (1945)). According to Kolari and Pynnönen (2010), the Wilcoxon test outperforms the parametric test in terms of finite sample power especially when it is
applied to data which are fat tailed- distributed. This test takes into account both the sign and the magnitude of the abnormal returns, while it does not require normality of the abnormal
returns to achieve proper specification under the null hypothesis. Consider the statistical measure for a specific event day t:
0
,1
N i it it it it t I AR m AR K AR m AR W (8)where
m
AR
it
is the median of the cross-sectional abnormal returnsAR
it, K
. denotes the ranking order of the data according to their relative magnitude,I
AR
it
A
R
~
it
0
is an indicator function that assigns the value 1 when the conditionAR
it
A
R
~
it
0
is satisfied and 0 otherwise. It is assumed that none of the absolute values are equal, while these values are non-zero. The signed-ranked test statistic is defined as , 1/2 12 ) 1 2 )( 1 ( 4 ) 1 ( N N N N N W z t t W . (9)Under the null hypothesis that the abnormal returns are generated from a distribution whose median is zero, zW,t is distributed as standard normal18. 3.3. Testing for different market reaction across different hedge fund activism events Further, we investigate the possibility that the market reacts differently to those events by testing the following hypotheses:
H
0D:
Vt
St
0
,
againstH
1D:
Vt
St
0
, (10)
H
0D:
Vt
St
0
,
againstH
1DR:
Vt
St
0
, (11)
H
0D:
Vt
St
0
,
againstH
1DL:
Vt
St
0
, (12)
H
0E:
Vt
NVt
0
,
againstH
1E:
Vt
NVt
0
, (13)
H
0E:
Vt
NVt
0
,
againstH
1ER:
Vt
NVt
0
, (14)
H
0E:
Vt
NVt
0
,
againstH
1EL:
Vt
NVt
0
, (15)where
jt
E
SAR
jt
,
j
V
,
S
,
NV
,
denotes the expected value of the standardizedabnormal returns of the specific event-based category j at event date t. The sample mean is
used to estimate
jt . The standardized abnormal returns for each stock i are defined as
it
,it it AR AR SAR
(16a)
where
1 1 2 1 1 L t it it u k L AR
is the standard deviation of the regression prediction errorsof each stock, k denotes the degrees of freedom, and L1 is the estimation window length. The
parameter k is equal to one, four and five when the market model, the Carhart model, and the GARCH-in-Mean models are used, respectively. The standardization of the abnormal returns
by their standard deviation allows conducting reliable inference on the difference between
their sample means because these samples have unequal lengths. A standard two sample t-test of unequal variances that has been widely used in the literature is applied to the standardized abnormal returns to test hypotheses (10)-(15). In particular, the two sample t-test of Welch
(1947) is defined as
S S V V St Vt W N s N s t 2 2
(16b)where sV2 and sS2 are the sample variances of the cross-sectional standardized abnormal
returns of voice and Schedule 13D event-based stocks respectively, while
N
VandN
Sare thetotal number of stocks of voice and Schedule 13D event-based categories, respectively. Under the null hypothesis that the difference of the two means is equal to zero, the test statistic is
distributed as Student’s t with v degrees of freedom, where
,
1
1
1
1
2 2 2 2 2 2 2
S S V s V V S V s VN
N
s
s
N
N
N
s
s
N
v
(17)with
. denoting the function that rounds down to the nearest integer the data. The t-test forthe difference
Vt
NVt
is defined similarly. The simulation results of Ruxton (2006)3.4. Heteroscedasticity-robust and non-normality-robust tests
Several studies on testing the mean equality hypothesis raise concerns about possible
inferential biases associated with the application of the existing test procedures under the presence of non-normality and heteroscedasticity. For instance, Algina et al. (1994) show that
the Welch test faces size distortions when applied to data which are non-normally distributed. Descriptive statistics of stock returns, presented in Table 1, do indicate departures from
normality; moreover, heteroscadisticity is a common feature in stock returns.
To allow for these stock returns characteristics in our testing procedure, we consider the
Yuen’s (1974) trimmed mean based test. Wilcox (1997) documented that the Yuen’s (1974) test is well sized and demonstrates enhanced power under a sequence of local alternatives.
More recently, Keselman et al. (2004) proved that a modified version of Yuen’s test, introduced by Guo and Luh (2000) and implemented in conjunction with bootstrap
confidence intervals, performs satisfactorily in finite samples. Their test is also based on trimmed means and it ensures robustness to skewness.
The two-sample trimmed mean tests of Yuen (1974), and Guo and Luh (2000) are applied to the standardized abnormal returns in order to evaluate hypotheses (10)-(15). The test
procedures are summarized below. Let SARj(1) SARj(2)...SARj(N)be the standardized
abnormal returns of the event-based category j placed in ascending order. The sample trimmed mean of the category j is defined as
j
j
q N
q k
k j j
jt SAR
h 1
) ( * 1
, (18)where
q
jdenotes the lower and upper cut-off point of the distribution of the standardizedabnormal returns, with
q
j
gN
, where
is the percentage of trimming applied to the tailsof the distribution, and
h
j
N
2
q
j. Following the simulation results of Keselman et al.(2004), we set g equal to 10%. The Winsorized variance of the standardized abnormal returns is estimated as the sample variance of the Winsorized standardized abnormal returns:
N
k
W j jk
W j SAR
N 1
2 *
2
1
1
where ) ( ) ( ) ( ) 1 ( ) 1 ( ) 1 ( * , , , j j j j j j q N j jk q N j q N j jk q j jk q j jk q j jk SAR SAR if SAR SAR SAR SAR if SAR SAR SAR if SAR
SAR , (20)
and
N k
jk
W j SAR
N 1
* 1
. (21)Yuen’s (1974) test is defined as
1/2* * S V St Vt Y p p t
, (22)where
(
1
)
2(
1
)
\
Wj j jj
N
h
h
p
.Guo and Luh (2000) proposed a modified version of Yuen’s test which filters out non -parametrically possible excess skewness by using a Hall (1992) transformation to the original
test statistic. Their test is defined as
Vt St W W W W Vt St W W Vt St
W Ht (
*
*)
6
2
3
4
*
* 2
2 27
8
*
* 3
(22a)where 32
2 3 S S V V W h h
, 1
,1 3 * 3
N k W j jk j SAR N
and
W2 pV pS.Under the null hypothesis of mean equality, both test statistics are distributed as Student’s t
with degrees of freedom equal to
2
2(
1
)
2(
1
)
*
S S V V SV
p
p
h
p
h
p
. (23)Bootstrap critical values are employed for inference. The bootstrap simulations were conducted on the basis of the following steps: First, calculate the zero-mean series
* jt jt jt
SAR
L
for the standardized abnormal returns of each event-based category j. Thistransformation ensures that the empirical distributions of both samplesLjtshare a common
measure of location. Second, generate bootstrap series L~jtof length N by randomly sampling
using the bootstrap samplesL~jt. Fourth, calculate the test statistic tY(or tH) using the actual
data Ljt.Fifth, repeat the first three steps of the procedure B times. A sequence of B
pseudo-test values
B b Ybt 1
~
(or
B b Hb
t 1
~
) is generated. In our empirical investigation, 2500 bootstrap
replications are used. Sixth, the null hypothesis of mean equality is rejected at level α if the
condition tY
~tY,~tY(1)
is not satisfied, with~
t
Yand ~tY(1)representing the lower α andupper (1 –α) percentile of the distribution of
t
~
Yb Bb1, respectively.4. Empirical findings, implications, and regulatory policy recommendation
4.1. Abnormal returns around the Schedule 13D announcement
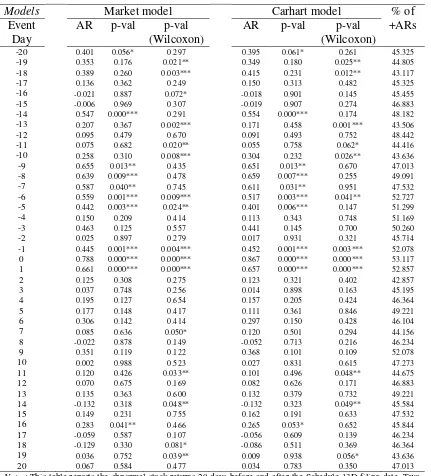
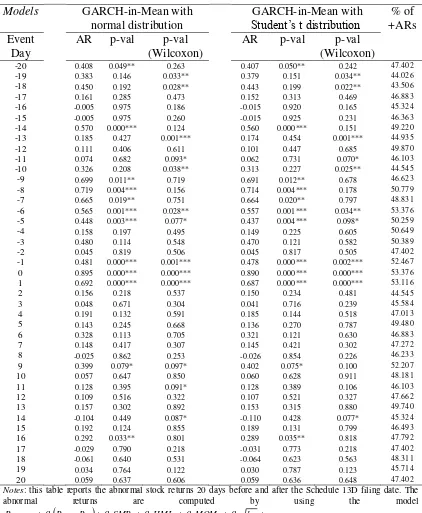
The results for testing the null hypothesis reflected in (4), namely that the stock market does not respond to the announcement of hedge fund activism initiation based on the information at the Schedule 13D filings announcements, is reported in Table 1a for the market model and
the Carhart (1997) model of abnormal returns, and in Table 1b for the GARCH-in-Mean model with the normal distribution and the t-distribution. Tables 1a and 1b report the
abnormal stock returns 20 days before and after the announcement date of the Schedule 13D filings, the p-values on the statistical significance of the abnormal returns based on the
parametric t-test in (7) (denoted as “p-val”), and the p-value of the non-parametric Wilcoxon signed rank test in (9). The last column in each Table presents the percentage of the positive
abnormal returns for the event date.
The results from Table 1a show that over the period (-1, +1) the abnormal returns are
statistically different from zero at the 1% level, under both models of abnormal returns. In addition, there is evidence of statistical significance of abnormal returns for a period starting 9
trading days prior to the Schedule 13D date, which is justified by the fact that the hedge fund has a deadline of 10 days to disclose the information. The rejection of the null hypothesis in
(4), that the stock market does not respond to the Schedule 13D filings announcements, is supported by both the parametric t-test and the non-parametric Wilcoxon test. The statistically
significant abnormal returns to Schedule 13D announcements are positive, suggesting short-term value creation. Table 1b, for the GARCH-in-Mean model under the normal and under
the Student’s t-distribution, presents very similar results, suggesting statistically significant positive abnormal returns around the Schedule 13D announcement date.
Becht et al. (2017), Bebchuk et al. (2015), Klein and Zur (2008), and Clifford (2008)
considered the periods 2000-2010, 1994-2007, 2003-2005, and 1998-2005, respectively. As, according to Klein and Zur (2009), results may differ across samples, the current results, for a
period up to 2013 and including events which occurred within the 2007-2009 financial crisis, can be interpreted as extending the earlier results for a recent period which encompasses the
turbulent span of a major financial crisis.
4.2. Abnormal returns around voice
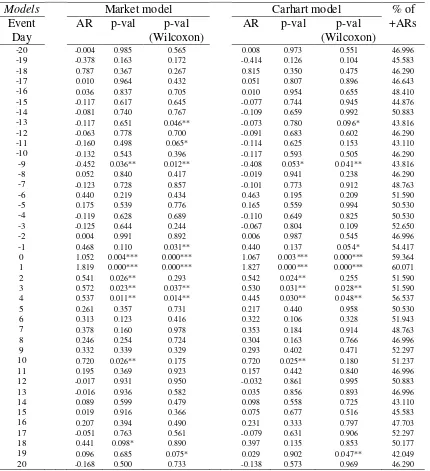
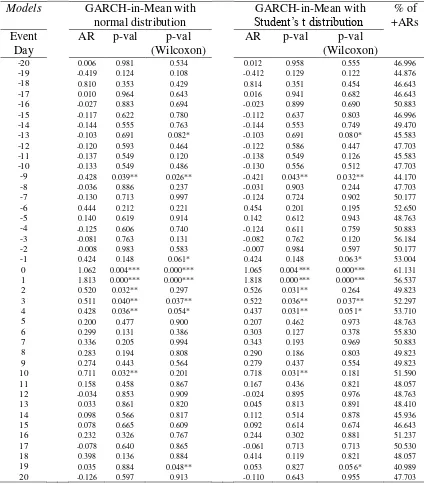
The results from testing the null hypothesis (5), namely that the stock market does not
respond to voice announcements, are reported in Tables 2a (for the market model and the Carhart model) and 2b (for the GARCH-in-Mean model). The message from these Tables is
as follows. Statistically significant, in most cases at the 1% level, abnormal returns exist over the period (0, +4), and on date -9, regardless of the abnormal returns model and the test
statistic employed. The abnormal returns are positive, and are approximately 1.11%. Importantly, compared to the abnormal returns around the Schedule 13D, the voice abnormal returns are higher by approximately 64%. Thus, voicing yields short-term value creation19.
As voicing involves information disclosure about the objectives of the hedge fund activists, it
is also related to the literature on mandatory disclosure of information in financial markets which is at the forefront of regulatory efforts to improve market quality. There is an ongoing
discussion about the limits and costs of mandatory disclosure as well as about the challenges faced by policymakers with regard to mandatory disclosure (Enriques and Gilotta, 2015).
Several studies have found that information disclosure, in general, creates value to shareholders (Akhigbe and Martin, 2006). Our findings are in line with such findings. However, our findings go further in suggesting that the two-step mechanism of disclosure of
hedge fund activism (disclosure at Schedule 13D and disclosure at voice, at two chronologically different dates) may create anticipation by stock market participants of
arbitrage profits. Although some benefits of disclosure do exist (like shareholder value
creation), much has been written about potential unintended consequences of disclosure leading authors to search for an optimal level of disclosure in terms of promoting market
quality. Goldstein and Yang (2017) argued that one form of disclosure regulation is when
investors are required to disclose information about their holdings in firms that might pertain to activism or intentions of activism, which is exactly the case of voicing examined here. Our
results point at two chronologically different but linked (through mandatory regulation) event dates of hedge fund activism, which creates stock market inefficiencies and arbitrage and
reduces instead of improving market quality.
These results show that the news disclosed at voice entails information revelation which is
reflected into the stock market by a positive response. According to Suominen (2001),
information revelation has empirical implications related to conditional volatility (i.e. GARCH-type), which justifies the adoption of the GARCH-in-Mean model for abnormal
returns20. Furthermore, as the average voice date comes chronologically after the average
Schedule 13D announcement date, the anticipation by market participants of subsequent
voicing, created by the Schedule 13D announcement, can result in arbitrage due to the positive abnormal returns around voicing identified in our results. This point is related to the contention that there are many aspects to consider when evaluating the effects of information
disclosure and the optimal regulation of the level and form of disclosure (Goldstein and Yang (2017, p. 122)).
4.3. Difference between abnormal returns of Schedule 13D and voice
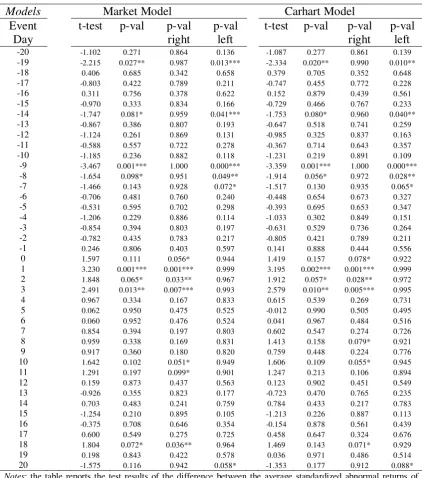
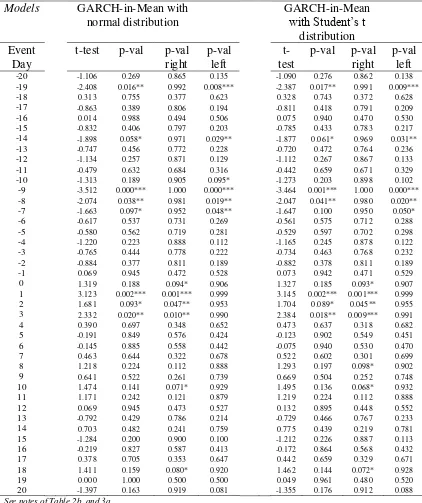
We next turn to testing the hypotheses in (10)-(12), namely that the market reacts differently to the Schedule 13D and voice events. The results are reported in Tables 3a (market and
Carhart models) and 3b (GARCH-in-Mean). The Tables report the test results of the difference between the average standardized abnormal returns of the voice and the average
standardized abnormal returns of the Schedule 13D filing dates. In hypotheses (10)-(12), Vt
denotes the average standardized abnormal returns of the voice, while St denotes the average abnormal returns of the Schedule 13D filings dates. We report the p-value of the t-statistic
when the alternative hypothesis is H1:Vt St0(Hypothesis in (10)). In those Tables, “
p-val right” denotes the p-value of the t-statistic when the alternative hypothesis is
0 :
1 Vt St
H (Hypothesis in (11)) and “p-val left” denotes the p-value of the t-statistic
when the alternative hypothesis is H1:Vt St0 (Hypothesis in (12)).
The results suggest that, based on the “p-val”, the difference of the abnormal returns is statistically significant over the period (+1, +3) under all 3 models of abnormal returns. Based
on the “p-val right”, the statistically significant difference reveals that the abnormal returns of voice are significantly higher than the returns of Schedule 13D21. These results indicate that
the announcement made and information disclosed at the Schedule 13D does not reveal the
full but only partial information, with the remainder of information being revealed at voice.
Our previous finding that the abnormal returns of voice are significantly higher than the returns of Schedule 13D is supported by the heteroscedasticity-robust tests of Yuen (1974), and Guo and Luh (2000). As shown in Tables 3c (for the market model), 3d (for the Carhart
model), and 3e (for the GARCH-in-Mean model), both the Yuen (1974) and the Guo and Luh
(2000) tests indicate that the abnormal returns of voice are different from the Schedule 13D returns (based on the p-val); moreover, the former are higher that the latter (based on the p-val
right). The information disclosed at voice does reveal further news which is important and reflected in the market, supporting the conjecture that voice is related to information
revelation in the U.S. stock market. Finally, this statistically significant difference between the voice and the Schedule 13D abnormal returns is approximately 0.4%, and is interpreted as an average arbitrage profit that can be obtained between the two dates.
These findings are in line with the dynamic trading models of Kyle (1985) and Ostrovsky
(2012). Information revelation occurs when an informed trader, through his actions, takes advantage of his information and eventually moves the price of the stock to its correct value
(Ostrovsky (2012)). In Kyle’s (1985) dynamic trading model, the informational content of prices is examined along with the value of information to an informed trader, and price
innovations are modelled as a consequence of information revelation with the informed trader acting in such a way so that his information is incorporated into prices. In our framework, the informed trader is the hedge fund and his actions include the hedge fund activism and
information disclosure at both the Schedule 13D and the voice date. Our results are an empirical manifestation of Kyle’s findings, in which hedge fund (informed trader) through
hedge fund activism information revelation actions moves the security price to a new level.
4.4 Abnormal returns of voice when voicing leads Schedule 13D filings
As our sample records both the voice and the Schedule 13D dates, we identify 93 voice events
which chronologically took place prior to the Schedule 13D filing date by 10 trading days or
less. The voice abnormal returns over the period (-20, +20) for the events are calculated using
the 3 models, and results are reported in Table 3f. Based on inference from both the parametric and the non-parametric Wilcoxon tests, the results show that, at the 5% level, there
exist statistically significant abnormal returns 1 trading day prior to the voicing date (-1), under all 3 models. These returns are positive, in line with the previously documented results
in Tables 2a and 2b. The main message which emerges is that voicing on its own creates short-term value, and not necessarily as a result of the Schedule 13D filing. Markets respond to hedge fund voicing, regardless of whether this occurs prior to or after the Schedule 13D,
which signals significant voice-related information revelation.
4.5. Abnormal returns of non-voice, and testing the difference between voice and non-voice
As hedge funds aim to change the strategy, the management, or the governance of a target
company, they may get in conflict with the managers or the dominant shareholders who control the target company (Pacces (2016)). The choice between voicing and non-voicing (i.e.
exiting the target firm) can be the outcome of this conflict as a rational decision by the hedge
fund activist. This decision is dependent on whether the hedge fund can influence the target, whether the hedge fund needs to influence the target, or whether the expected gain of influencing the target exceeds the cost. Parameters which affect this choice include the extent
to which the target firm already operates at maximum performance, and the degree to which other investors in the target firm are dissatisfied with the management (Admati and Pfleidere
(2009); Kedia et al. (2017)).
The results from testing the null hypothesis in (6), regarding the abnormal returns of non-voicing, are reported in Tables 4a (market model and the Carhart model) and 4b
(GARCH-in-Mean). The results indicate that non-voice is also related to positive abnormal returns over the period (-1, +1). These results are qualitatively similar to those reported in Tables 1a and 1b for the full sample of Schedule 13D announcements. Positive abnormal returns for non-voice
could be interpreted as suggesting that the hedge fund activist, after monitoring the firm’s
operations, realizes that there is no scope of improving action. As contended by Brav et al.
(2008b, p. 1748), some hedge fund activists hope to facilitate value enhancing changes in the
target company as minority shareholders without taking control of the target firm’s board of
directors. Non-voicing may signal to the stock market that the target firm’s value is already high enough so no value enhancing changes can be made. This can be the case when the
The positive abnormal returns may also be attributed to a relatively small degree of
dissatisfaction of other institutional investors in the target firm (Kedia et al. (2017)). The fact that the existing management is strong and in close agreement regarding its vision about the
future of the firm. So, the hedge fund’s exiting from the target firm (non-voicing) is perceived
by the market as good news about the target firm’s condition or its management.
Another justification of the positive abnormal returns of non-voice (exit) is provided by Admati and Pfleiderer (2009). Over the period from the date of the Schedule 13D to the date
of exit, the threat of exit can be a form of activism (Admati and Pfleiderer (2009)). Palmiter
(2002, pp. 1437–38) suggests that large shareholders may be able to affect managerial
decisions through the “threat (actual or implied) of selling their holdings and driving down the price of the targeted company”. If managers’ compensation is linked to share prices, and if the exit of a large shareholder has a negative price impact, then the presence of a large
shareholder, who is potentially able to trade on private information, may help discipline the management and improve corporate governance (Admati and Pfleiderer (2009)). So, exiting may imply that, through the threat of exit, the objective of improving corporate performance
has been accomplished.
Combining the results on positive abnormal returns for voice and non-voice suggests that stock market participants can obtain positive abnormal returns in any state of nature following
the Schedule 13D announcement, namely regardless of whether the hedge fund is eventually engaged to the target (voice) or exits (non-voice). This further indicates that the disclosure of
information at the Schedule 13D announcement creates anticipation to market participants that, regardless of the eventual voice-exit decision, arbitrage profits (abnormal returns) are to be generated sometime during the course of the hedge fund’s holding of the minority stake.
In other words, information revelation occurs at either the voice or the exit decision.
We next turn to testing the null hypotheses reflected in (13)-(15), namely that the previously
identified abnormal returns for voice and non-voice are different (Hypothesis (13)). If we find that they are, we can test whether the voice returns are higher than the non-voice returns (Hypothesis (14)), or the opposite (Hypothesis (15)). The results are reported in Tables 5a (for
the market and the Carhart models) and 5b (for the GARCH-in-Mean model). In line with Table 3a, these Tables report the test results of the difference between the average
standardized abnormal returns of the voice and the average standardized abnormal returns of
the non-voice. Denoting byVt the average standardized abnormal returns of the voice and
of the t-statistic when the alternative hypothesis is (“p-val”)H1:Vt NVt0. In addition,
they report the “p-val right” denoting the p-value of the t-statistic when the alternative hypothesis is
H
1:
Vt
NVt
0
, and the “p-val left” denoting the p-value of the t-statisticwhen the alternative hypothesis is
H
1:
Vt
NVt
0
.The results from these Tables suggest that the voice abnormal returns are different from the non-voice returns over the period (0, +3) at the 5% or 1% level, regardless of the abnormal
returns model. Thus, Hypothesis (13) is rejected in favour of its alternative. Moving on to identifying which abnormal returns are higher, the “p-val right” indicates that the difference
between the voice returns and the non-voice returns is strongly significant over the period (0, +3). Thus, we conclude that the voice average abnormal returns are higher than the non-voice average abnormal returns at the 1% level at or post the event22. These findings suggest that
the announcement at voice reveals more influential information than the non-voice announcement does. Stock markets respond more aggressively to voice than to Schedule 13D,
signalling richer information revelation at voice events.
4.6. Basic implications, and regulatory policy recommendation
As discussed above, there is an ongoing debate on the limits and costs of the regulation of
mandatory disclosure in stock markets, and whether this regulation has net positive or negative effects on stock market quality (Enriques and Gilotta, (2015)), Greenstone et al.
(2006)). As a consequence, policy makers face the challenge of searching for an optimal level of disclosure in terms of promoting market quality (Goldstein and Yang (2017)). Our results
have implications for regulation specifically related to mandatory disclosure of hedge fund activism events, and for policy making. The voice date and the Schedule 13D date, which in
general do not coincide, are two important hallmarks of mandatory disclosure in regulation for the hedge fund activism. We find that both dates, and not only the Schedule 13D date, are
important in short-term value creation. In addition, disclosure of non-voice is also related to value creation. All of these cases of value creation involve positive abnormal returns around the corresponding event dates. The positive abnormal returns at Schedule 13D events, voice
events, and non-voice events, in conjunction with the fact that these events are disclosed at different dates, indicate opportunities for arbitrage. Arbitrage is detrimental for the U.S. stock
market quality. However, in principle, mandatory disclosure regulation should aim at improving, not decreasing, stock market quality. Therefore, based on the criterion of
promoting stock market quality, our findings point to the need of revisiting the way that
hedge fund activism related information is disclosed in the stock market. This need is also in line with legal scholars' recommendations for significant modification of U.S. securities
markets regulation (Mahoney, (1997), Romano (1998), Palmiter (1999)).
One way of restructuring the mechanism of mandatory disclosure of information for hedge fund activism events is the introduction of gradual disclosure of information on hedge fund activism. Under such an arrangement, regulators would require hedge fund activists to file
several 'progress reports' or 'preliminary intention reports' at fixed time intervals until their
final decision to voice or non-voice. In these reports, they will update market participants on their intention to engage into or exit from the target firm. In this way, instead of the full
voice/non-voice information reaching the market at only one day (i.e. the event day), gradual dissemination of information may reduce the positive abnormal returns around the voice and
non-voice dates, limit arbitrage opportunities, and thus improve market quality. Gradual dissemination means that market participants would act on several dates (the dates
corresponding to the disclosure of the various ‘preliminary intention reports’) and not
necessarily only on the one date corresponding to the one-off event disclosure (Schedule 13D date or voice date or non-voice date). This would reduce the number of market participants
acting only on the event date and thus, reduce the amount of abnormal returns on that date. In addition, within the framework of Kyle (1985), gradual dissemination means that the single
informed trader (hedge fund activist) would, due to gradual information revelation, have less power to drive through his one-off action (e.g. disclosure of voice or non-voice) the price to a
new level. Importantly, this regulatory policy recommendation is in line with the research design of the Securities Act Amendments of 1964 which points to 'gradual dissemination of news' by firms filing with the SEC (Greenstone et al., (2006), page 415).
5. Robustness
5.1. Asymmetric (leverage) volatility effects and GARCH models for abnormal returns
Suominen (2001) has shown that information revelation in stock markets suggests that the expected price variability looks similar to a conditional variance GARCH-type model. In this section, we add another aspect of modeling time-varying volatility, namely allowing for
asymmetric or leverage effects in the GARCH model, namely for the fact that negative shocks have a greater impact on stock return volatility than positive shocks. The most well-known
GARCH-type models incorporating asymmetric effects are the exponential GARCH (EGARCH) (Nelson, 1991) and the GARCH-GJR (Glosten et al. 1993).
2 3 4 5,
10 mt ft t t t it it
it
a
R
R
SMB
HML
MOM
h
u
R
(24)
it 1/2,
itit
h
u
(25)
log
,log 1/2 3 1
1 1 2 2 / 1 1 1 1 0 it it it it it it h h u h u S k
h
(26)where
it is a sequence of independent and identically distributed as Student’s t withunknown degrees of freedom random variables,
2 2 1 2 1/22 / 1 1 1 2 / 1 1 1 k k k h u h u S it it it it
, k are the degrees of freedom, Γ(.) is theGamma function, and
h
it is the sequence of conditional variances which evolve as anEGARCH(1,1) process. Thus, abnormal returns are calculated based on the
EGARCH-in-Mean model reflected in (24)-(26). The constant
k
0 and the coefficients
i,
i
1
,
2
,
3
,
areestimated using the quasi-maximum likelihood method.
Under the GARCH-GJR model, the following representation is considered:
2 3 4 5,
1
0 mt ft t t t it it
it
a
R
R
SMB
HML
MOM
h
u
R
(27)
it 1/2,
itit
h
u
(28)
0
2 ,1 1 3 1 2 2 1 1
0
it it it it
it k u h I u u
h
(29)where
it is a sequence of random variables which are assumed to be independent andidentically distributed as Student’s t with unknown degrees of freedom,
I
u
it1
0
is anindicator function that assigns the value 1 when
u
it
0
and 0 otherwise, and
h
it is the sequence of conditional variances. Thus, abnormal returns are calculated based on theGJR-GARCH-in-Mean model reflected in (27)-(29). All models are estimated using the quasi-maximum likelihood method.
The empirical results are reported in Table 6 for the Schedule 13D abnormal returns, Table 7
reports both the parametric and the non-parametric Wilcoxon signed rank test p-values. As
shown in Table 6, the Schedule 13D abnormal returns, based on the EGARCH-in-Mean and the GJR-GARCH-in-Mean models with the Student’s t-distribution, are statistically
significant for the periods (-1, +1) at the 1% level of significance. These findings are exactly the same as those reported in Tables 1a and 1b for the market model, the Carhart model, and
the simple GARCH-in-Mean model. Thus, the results on the significance of the Schedule 13D abnormal returns are robust to asymmetric conditional variance effects23.
Similar results are obtained from Table 7 for the voice abnormal returns. Under both the
EGARCH-in-Mean and the GJR-GARCH-in-Mean models, the voice abnormal returns are different from 0 and positive over the period (0, +4) at either the 5% or the 1% level, based on
both the parametric and the non-parametric tests. These findings are very similar to those under the previously examined three models in Tables 2a and 2b. Finally, Table 8, for the
non-voice abnormal re