Effect of Annealing Temperature on Structural, Optical
and Electrical Properties of Pure CdS Thin Films
Deposited by Spray Pyrolysis Technique
A. Hasnat1*, J. Podder2
1Department of Physics, Jagannath University, Dhaka, Bangladesh
2Department of Physics, Bangladesh University of Engineering and Technology, Dhaka, Bangladesh
Email: *mahasnat.phy@gmail.com
Received October 15, 2012; revised November 28, 2012; accepted December 16, 2012
ABSTRACT
Effect of annealing temperature on the properties of CdS thin films are carried out in this work. Nanocrystalline cad- mium sulphide (CdS) thin films were prepared using spray pyrolysis deposition (SPD) technique and the structural, op- tical and electrical properties were investigated for different annealing temperature (as deposited, 300, 400 & 500 C). The surface morphology and compositional properties studied by SEM and EDX respectively. The crystal structure of CdS thin film was studied by X-ray diffraction. The crystallite size and lattice constant of SPD CdS thin films were in- vestigated. The optical parameters such as transmittance, absorption coefficient and energy band gap of the films with thermal annealing temperature was investigated by UV/VIS spectrophotometer. The variation of band gap values of CdS thin film samples were found to be in the range of 2.51 to 2.8 eV. Electrical resistivity measurements were carried out in fourprobe Vander Pauw method at different temperature. So CdS films may be a good candidate for suitable ap-plication in various optoelectronic devices.
Keywords: Spray Pyrolysis; CdS; Annealing Temperature; Structural; Optical Band Gap
1. Introduction
The structural and optical properties of SPD CdS thin films depend on the parameters of relative concentration of the reactants for chemical reaction, thickness of the films, pH value of the aqueous solution and annealing temperature. In the SPD process, film growth occurs ei- ther 1) by an ion-by-ion condensation or 2) by adsorp- tion of the colloidal particles of CdS on the substrate [1,2]. The chemically deposited CdS film was found to consist of a continuous film relating to the ion-by-ion deposition of CdS [3,4]. The structural information’s of CdS thin films such as crystal structure, inter-planar dis- tance and lattice constant are determined by the X-ray diffraction (XRD). The optical parameters of optical ab- sorption coefficient and optical band gap are important to design the optoelectronic devices. In this study, nano- crystalline CdS thin films were deposited on glass sub- strates by SPD. The structural, optical and electrical properties of CdS thin films were investigated. Solar cells are the building blocks of photovoltaic systems. Solar cells are widely used in space program as power source for satellites as well as a major power source to
meet earth’s energy needs. Single crystalline CdS has been used extensively for space applications. Cadmium sulphide (CdS) is one of the attractive semiconductor materials and has been investigated for electronic and optoelectronic devices. The solar cells of CdS [5,6] and Cu(In,Ga)Se2 (CIGS) [7,8] have been researched to in-
crease the efficiency of cells. CdS thin films are prepared by vacuum evaporation [9,10], sputtering [11,12], screen printing [13,14], and CBD [1,3-5,15]. Among the various techniques, SPD is a simple and inexpensive solution deposition technique, in which thin film is prepared by chemical reaction. Also, it is possible to obtain uniform films with good adherence [16,17]. SPD CdS thin films are prepared by the decomposition of thiourea (SC(NH2)2)
in an alkaline solution containing a cadmium salt, such as cadmium acetate (Cd(CH3COO)2).
Other schemes for power generation viasolar cells in- clude thin film solar cells [18] and multi-junction solar cells. Multi-junction solar cells although more efficient have higher fabrication cost. Polycrystalline thin film CdS solar cells are one of the important candidates for large scale photovoltaic applications because of their low cost, high efficiency and stable performance and have been used for large area terrestrial applications [19-20].
Cadmium sulphide is an important material for the de- velopment of low cost photovoltaic devices for space as well as terrestrial applications [21]. Most of the reported work on CdS solar cells is focused on opto-electronic properties. There are only a few studies on the electrical properties of CdS solar cells [22]. In this paper, the elec-trical characteristics of CdS solar cells have been inves-tigated and the results are presented.
2. Experimental Details
Spray pyrolysis is basically a chemical process involves spraying aqueous solution onto a substrate held at high temperature. A simple glass nozzle was fabricated to give a fine and very small droplets of precursor solution which is driven by air from the compressor. In the pre-sent work, In order to prepare CdS thin films the aqueous solution of Cadmium acetate [Cd(CH3COO)2·2H2O] and
thiourea [NH2CSNH2]were used as a source of Cd and S
respectively. The deposition set up consists of four sec- tions, which include the precursor solution and carrier gas (air) assembly connected to the spray nozzle, the reaction chamber in which the substrate is heated, the pumping and exhausting gas scrubbing systems, and temperature controller with a Copper-Constantan ther-mocouple to control the substrate temperature. In this study, precursor solutions of 0.1 M concentration was used as raw material to deposit CdS thin films. The glass substrates were cleaned ultrasonically in acetone and methanol respectively for 10 minutes in each case. The solution was sprayed onto pre-cleaned glass substrate. The substrate temperature was maintained constant at 573 K. The normalized distance between the spray noz-zle and the substrate was fixed at 29 cm. The pressure of the carrier gas (air) was kept constant at 1 bar. The solu-tion flow rate was maintained 0.5 ml·min–1 throughout the experiment. The possible chemical reaction that takes place on the heated substrate to produce CdS (please see the formula below).
Characterization
The surface properties of the films were examined by using HITACHI S-3400N model Scanning Electron Microscope (SEM) attached with an EDX to measure quantitatively the sample stoichiometry. CuKα (λ = 1.54178 Å) source was used in XRD. The Optical trans- mission measurements were carried out within the wave- length range 300 to 1100 nm using UV-1601 PC SHI- MADZU scanning double beam spectrophotometer. The experimental accuracy of the transmittance is (±0.005%)
and wavelength is (±0.005%). The observed transmit- tance data were corrected relative to optically identical uncoated glass substrate. The thicknesses of the films were determined by using Fizeau-fringes method. Four- probe Vander Pauw method was used for electrical pro- perties measurements.
3. Results and Discussion
3.1. Surface Morphology
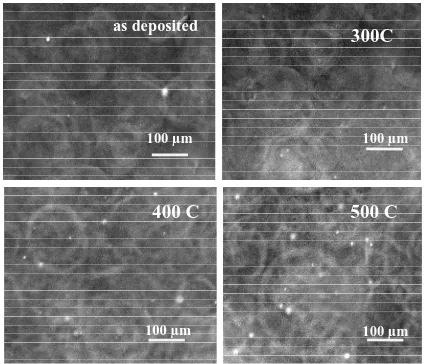
Figure 1 shows SEM micrograph samples annealed at different temperature. It shows that the surface is uniform and deposition covers the substrate well. After annealing, the surface roughness is increased. It means that sprayed particles (atoms) are adsorbed onto the substrate to form clusters as the primary stage of nucleation. Clusters have a higher energy than the individual atoms, so at higher annealing temperature growing nuclei come into contact to form island stage and appears as spheroid shape.
3.2. Compositional Studies
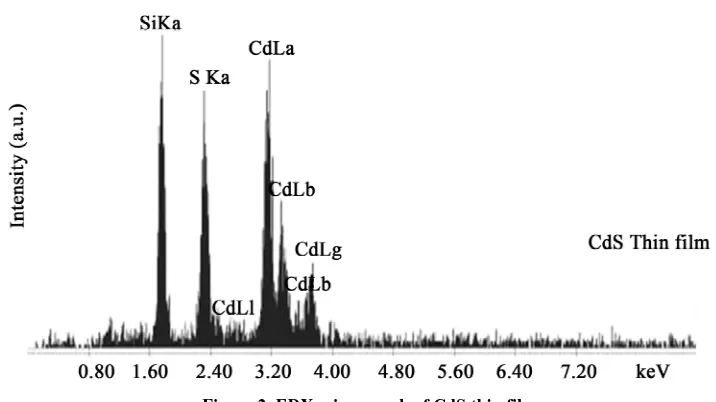
Energy Dispersive X-ray Diffraction (EDX) is analytical technique used for the elemental analysis or chemical characterization of a sample. Studying the EDX data we also get the information about the elements in the CdS thin films. Figure 2 shown that there are two strong peaks corresponding to Cd & S were found in the spectrum which confirms the high purity of the CdS thin films. An average atomic percentage of Cd and S were found to be 54.79 and 45.21 respectively. From the Table 1
300C
100 µm as deposited
100 µm
500 C
100 µm 400 C
[image:2.595.317.529.463.645.2]100 µm
Figure 1. SEM of the CdS thin films as-deposited and ther- mal annealed.
3 2 2
2 4 2 2 2
300 C Cd(CH COOH) 2H O+
CdS + CO + CH + Steam NH CSNH +H O
Decomposes
⋅
− − − − − → ↓ ↑ ↑ ↑
Figure 2. EDX micrograph of CdS thin films.
Table 1. EDX micrograph of CdS thin films.
Element Net Counts wt% wt% Error Atom% Atom% Error
S 11193 20.25 +/− 0.53 46.37 +/− 1.67
Cd 22580 79.95 +/− 2.40 53.63 +/− 1.57
Total 100.00 100.00
it is evident that for the films the amount of Cd and S are in stoichiometric. At high operating voltage the electron beam penetrates the film and reaches the glass surface, which results the Si peak.
3.3. Structural Properties
X-ray diffraction (XRD) has been taken on a number of annealing condition of cadmium sulfide thin films (as deposited, 300, 400 & 500 C) using monochromatic CuKα (λ = 1.54178 Å) radiation. Figure 3(a) shows six different fundamental peaks identified as (100), (002), (101), (102), (110) and (103) which indicates that this is a hexagonal wurtzite type structure. Grain size of the prepared CdS film for different annealed conditions was determined from the stronger peaks of (002) from each XRD patterns using Scherrer formula,
g
D = 0.9λ Δcosθ
where Dg is the average grain size, λ is the wavelength of
the radiation used as the primary beam of CuKα (λ = 1.54178 Å), θ is the angle of incidence in degree and Δ is the full width at half maximum (FWHM) of the peak in radian, which was determined experimentally after correction of instrumental broadening in the present case. Lattice parameters a and c where determined from the 2θ value. All the values of lattice parameters (a and c) and grain size of the film at different annealing temperature
for reflections of (002) are listed in Table 2. Average grain size of CdS thin films for different annealing temperature was determined in the range of 3.018 nm to 8.048 nm. Figure 3(b) shows the variation of grain size with annealing temperature.
3.4. Transmittance and Absorption Coefficient
The wavelength dependence of the optical transmittance spectra for annealed at different temperatures CdS are shown in Figure 4 measured at room temperature in air. From the transmittance spectra, it is clearly seen that the average optical transmission values in the visible region for all films are low. The average optical transmittance in the wavelength region (from 550 to 1100 nm) of as- deposited CdS thin films is about 80%, while after annealing at 300 C, 400 C, 500 C, the transmittance is 81%, 79%, and 72%, respectively. This effect of thermal annealing on the transmission of CdS films may be due to the some physical effects such as structural, surface irregularity, and defect density.
Figure 5 shows the absorption coefficient (α) that was analyzed using the following expression for near-edge optical absorption of semiconductors [7].
1 ln
T t
α
= (1)
3.5. Optical Band Gap
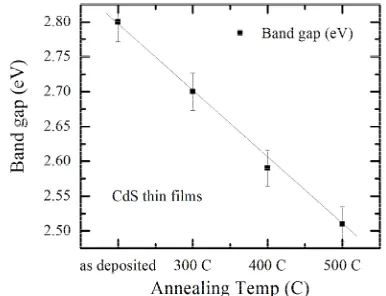
Figure 6 shows the effect of annealing conditions on band gap, where the band gap value is estimated by extrapolation of the straight line of the plot of (αhν)2
versus photon energy.
[image:3.595.59.287.318.395.2](a)
(b)
[image:4.595.59.285.81.484.2]Figure 3. (a) X-ray diffraction of CdS films for different annealing conditions; (b) Grain size of CdS thin films for different annealing conditions.
[image:4.595.320.525.85.228.2]Figure 4. Optical transmittance spectra of CdS thin films for different annealing temperature.
Figure 5. Absorption coefficient of CdS thin film s for dif-ferent annealing temperature.
[image:4.595.331.517.270.431.2]⋅
Figure 6. Variation of (αhν) 2 vs. photon energy (hν) for CdS films for different annealing temperature.
Figure 7. Variation of direct band gap with annealing tem-perature for CdS thin films.
are consistent with other published results such as results of George et al. [13].
3.6. Electrical Properties
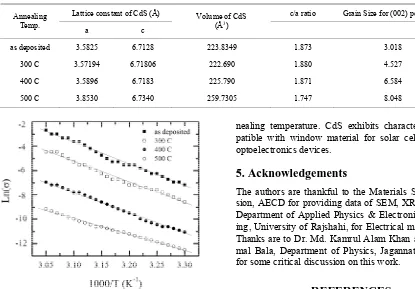
[image:4.595.325.518.471.619.2] [image:4.595.71.278.532.705.2]Table 2. Lattice constants, Volume, c/a ratio and Grain size of CdS thin films for different annealing temperature estimated from XRD.
Lattice constant of CdS (Å) c/a ratio Grain Size for (002) peak (nm) Annealing
Temp. a c
Volume of CdS (Å3)
as deposited 3.5825 6.7128 223.8349 1.873 3.018
300 C 3.57194 6.71806 222.690 1.880 4.527
400 C 3.5896 6.7183 225.790 1.871 6.584
500 C 3.8530 6.7340 259.7305 1.747 8.048
[image:5.595.57.286.464.549.2]Figure 8. lnσ versus 1/T graph for CdS thin films for dif-ferent annealing temperature.
Table 3. Variation of activation energy of CdS thin films with annealing temperature.
Annealing temperature Activation energy, ∆E (eV)
As deposited 0.68
300 C 0.51
400 C 0.42
500 C 0.28
energy. The lnσ versus 1/T graph for the CdS thin films are represented in Figure 8. From the slope, the acti- vation energy of the films of different concentrations has been calculated. Table 3 represents the variation of activation energy is from 0.28 to 0.68 of different con- centration for films.
4. Conclusion
From the obtained results, we can conclude the following. The grain size of the CdS structure was increased by annealing which in turn causes to decrease the energy band gap to be used in IR optoelectronic devices. An- nealing caused to increase the crystallinity of the resulted structures. The optical transmittance varied with the an-
nealing temperature. CdS exhibits characteristics com- patible with window material for solar cells and other optoelectronics devices.
5. Acknowledgements
The authors are thankful to the Materials Science Divi- sion, AECD for providing data of SEM, XRD and EDX, Department of Applied Physics & Electronics Engineer- ing, University of Rajshahi, for Electrical measurements. Thanks are to Dr. Md. Kamrul Alam Khan and Dr. Pari- mal Bala, Department of Physics, Jagannath University for some critical discussion on this work.
REFERENCES
[1] M. Contreras, M. Romero, B. To, F. Hasoon, R. Noufi, S. Ward and K. Ramanathan, “Optimization of CBD CdS Process in High-Efficiency Cu(In,Ga)Se2-Based Solar
Cells,” Thin Solid Films, Vol. 403-404, No. 579, 2002, pp. 204-211. doi:10.1016/S0040-6090(01)01538-3
[2] A. Davis, K. Vaccaro, H. Dauplaise, W. Waters and J. Lorenzo, “Optimization of Chemical Bath-Deposited Cadmium Sulfide on InP Using a Novel Sulfur Pretreat- ment,” Journal of the Electrochemical Society, Vol. 146, No. 3, 1999, pp. 1046-1053. doi:10.1149/1.1391719 [3] O. Vigil-Galan, J. Ximello-Quiebras, J. Aguilar-Her-
nandez, G. Contreras-Puente, A. Cruz-Orea, J. Mendoza- Alvarez, J. Cardona-Bedoya, C. Ruiz and V. Bermudez, “Passivation Properties of Cds Thin Films Grown by Chemical Bath Deposition on Gasb: The Influence of the S/Cd Ratio in the Solution and of the Cds Layer Thick-ness on the Surface Recombination Velocity,”
Semicon-ductor Science and Technology, Vol. 21, 2006, p. 76.
[4] M. Ilieva, D. Dimova-Malinovska, B. Ranguelov and I. Markov, “High Temperature Electrodeposition of Cds Thin Films on Conductive Glass Substrates,” Journal of
Physics: Condensed Matter, Vol. 11, No. 49, 1999, pp.
10025-10031. doi:10.1088/0953-8984/11/49/320
[5] A. Aschour, “Physical Properties of Spray Pyrolysed CdS Thin Films,” Turkish Journal of Physics, Vol. 17, No. 8, 2003, pp. 551-558.
doi:10.1016/j.jcrysgro.2007.03.041
[7] P. Boieriu, R. Sporken, Y. Xin, N. Browning and S. Si-vananthan, “Wurtzite CdS on CdTe Grown by Molecu- lar Beam Epitaxy,” Journal of Electronic Materials, Vol. 29, No. 6, 2000, pp. 718-722.
doi:10.1007/s11664-000-0212-3
[8] H. Uda, H. Yonezawa, Y. Ohtsubo, M. Kosaka and H. Sonomura, “Thin CdS Films Prepared by Metalorganic Chemical Vapor Deposition,” Solar Energy Materials
and Solar Cells, Vol. 75, 2003, pp. 219-226.
doi:10.1016/S0927-0248(02)00163-0
[9] M. Sasagawa and Y. Nosaka, “The Effect of Chelating Reagents on the Layer-by-Layer Formation of Cds Films in the Electroless and Electrochemical Deposition Proc- esses,” Electrochimica Acta, Vol. 48, No.5, 2003, pp. 483-488. doi:10.1016/S0013-4686(02)00714-4
[10] R. W. Birkmire, B. E. McCandless and S. S. Hegedus, “Optimization of Vapor Post-Deposition Processing for Evaporated CdS/CdTe Solar Cells,” Solar Energy, Vol. 12, 1992, pp. 37-45.
[11] G. Hodes, “Chemical Solution Deposition of Semicon- ductors Films,” Marcel Dekker, Inc., Basel, New York, 2003.
[12] J. Herrero, M. T. Gutierrez, C. Guillen, J. M. Dona, M. A. Martinez, A. M. Chaparro and R. Bayon, “Photovoltaic Windows by Chemical Bath Deposition,” Thin Solid
Films, Vol. 361-362, 2000, pp. 28-33.
doi:10.1016/S0040-6090(99)00830-5
[13] R. Zhai, S. Wang, H. Xu, H. Wang and H. Yan, “Rapid Formation of CdS, ZnS Thin Films by Microwave-As- sisted Chemical Bath Deposition,” Matarials Letters, Vol. 59, No. 12, 2005, pp. 1497-1501.
doi:10.1016/j.matlet.2005.01.008
[14] O. Oladeji, L. Chow, J. R. Liu, W. K. Chu, A. N. P. Bus- tamante, C. Fredricksen and A. F. Schulte, “Comparative Study of Cds Thin Films Deposited by Single, Continu- ous, and Multiple Dip Chemical Processes,” Thin Solid
Films, Vol. 359, No. 2, 2000, pp. 154-159.
doi:10.1016/S0040-6090(99)00747-6
[15] M. Ichimura, F. Goto and E. Arai, “Structural and Optical Characterization of Cds Films Grown by Photochemical
Deposition,” Journal of Applied Physics, Vol. 85, No. 10, 1999, pp. 7411-7417. doi:10.1063/1.369371
[16] C. D. Lokhande, A. Ennaoui, P. S. Patil, M. Giersig, M. Muller, K. Diesner and H. Tribursch, “Process and Char- acterisation of Chemical Bath Deposited Manganese Sulphide (MnS) Thin Films,” Thin Solid Films, Vol. 330, No. 2, 1998, pp. 70-75.
doi:10.1016/S0040-6090(98)00500-8
[17] S. Prabahar and M. Dhanam, “CdS Thin Films from Two Different Chemical Baths-Structural and Optical Analy- sis,” Journal of Crystal Growth, Vol. 285, No. 1-2, 2005, pp. 41-48. doi:10.1016/j.jcrysgro.2005.08.008
[18] L. D. Kadam and P. S. Patil, “Thickness-Dependent Properties of Sprayed Cobalt Oxide Thin Films,” Materi-
als Chemistry and Physics, Vol. 68, No. 1-3, 2001, pp.
225-232. doi:10.1016/S0254-0584(00)00367-9
[19] D. Fan, H. Wang, Y. Zhang, J. Cheng. B. Wong and H. Yan, “Preparation of Crystalline MnS Thin films by Chemical Bath Deposition,” Materials Chemistry and
Physics, Vol. 80, 2003, pp. 44-47.
doi:10.1016/S0254-0584(02)00518-7
[20] R. Mendoza-Pérez, G. Santana-Rodriguez, J. Sastre-Her- nandez, A. Morales-Acevedo, A. Arias-Carbajal, O. Vi- gil-Galan, J. C. Alonso and G. Contreras-Puente, “Effects of Thiourea Concentration on CdS Thin Films Grown by Chemical Bath Deposition for CdTe Solar Cells,” Thin
Solid Films, Vol. 480-481, 2005, pp. 173-176.
doi:10.1016/j.tsf.2004.11.060
[21] F. Y. Liu, Y. Q. Lai, J. Liu, B. Wang, S. S. Kuang, Z. A. Zhang, J. Li and Y. X. Liu, “Characterization of Chemi- cal Bath Deposited CdS Thin Films at Different Deposi- tion Temperature,” Journal of Alloys and Compounds, Vol. 493, No. 1-2, 2010, pp. 305-308.
doi:10.1016/j.jallcom.2009.12.088
[22] K. S. Ramaiah, R. D. Pilkington, A. E. Hill, R. D. Tom- linson and A. K. Bhatnagar, “Structural and Optical In-vestigations on CdS Thin Films Grown by Chemical Bath Technique,” Materials Chemistry and Physics, Vol. 68, No. 1-3, 2001, pp. 22-30.