Munich Personal RePEc Archive
Reform of the Personal Income Tax in
Spain: Effects on internal mobility of the
unemployed
González-Chapela, Jorge and Ortega-Lapiedra, Raquel
Centro Universitario de la Defensa de Zaragoza, Spain, Universidad
de Zaragoza,Spain
23 July 2019
Online at
https://mpra.ub.uni-muenchen.de/95308/
1
Reform of the Personal Income Tax in Spain:
Effects on internal mobility of the unemployed
Jorge González-Chapela
Centro Universitario de la Defensa de Zaragoza, Spain
Raquel Ortega-Lapiedra
University of Zaragoza, Spain
This paper examines whether, and to what extent, the internal mobility of the
unemployed in Spain was affected by a reform of the personal income tax that
introduced a mobility incentive targeted at this group. The reform introduced a distinct
change in the incentives to move for work for unemployed workers living in certain
regions of Spain. The reform’s effectiveness is assessed by means of a
difference-in-differences econometric approach, combined with nationally representative
administrative data. Results suggest that the reform led, at most, to relatively few new
migration flows, and account for the existence of differential migration trends between
the regions that adopted the reform and those that did not.
Keywords: Personal income tax, mobility, unemployed, Spain
2
Introduction
The application of Personal Taxes to individuals has been a topic of interest in the
process of modeling the economic behavior of families. For example, the U.S. Earned
Income Tax Credit (EITC), initiated in 1975, has been considered one of the best tools
to address the economic needs of low-income families by reducing poverty and income
inequality and increasing labor force participation (Kramer et al. 2019; Mammen et al.
2011). In Germany, Stöwhase (2016) analyzed how horizontal equity between families
in the tax-benefit-system is affected by the within-household distribution of earnings.
For the case of Spain, Escario and Molina (2004) and Labeaga et al. (2011) studied the
optimal fiscal policy on tobacco consumption, and the capacity of the Spanish
tax-system to reduce individual deprivation through a reform of the unemployment benefit
system, respectively.
Another European case of the impact of the reform of personal taxes on the
family behavior is the Spanish Personal Income Tax. On January 1, 2003, the Personal
Income Tax introduced a reduction to gross income for the registered Spanish
unemployed who moved to a new municipality in order to accept a job offer. The
so-called Reduction for Geographical Mobility (RGM) ranged from €2,400 to €3,500 in
the year of the move and the next, with no requirements as to the minimum duration of
the new job or stay, providing the taxpayer lived for tax purposes in a region other than
the Basque Country and Navarre (which have the power to regulate their own income
taxes). Taxpayer amounts filed for RGM in the tax form totaled €35.9 million in 2003
and €93.6 million in 2014.1 But whether and to what extent RGM stimulated the internal mobility of the unemployed, or served only to redistribute income to individuals
who would have moved anyway, is unknown. In any case, by inducing a sharp change
3
Spain, RGM provides a unique opportunity to examine the causal effect of a large-scale
program offering direct mobility incentives to the unemployed.
Given the requirements for claiming RGM (described below), the focus here will
be on internal migration of the contracted type (Silvers 1977; called “search then move”
migration by Molho 2001). According to Molho’s (2001) model of spatial job-search,
there are three reasons why this type of migration may have been stimulated by the
RGM. First, subsidizing the costs of migration stimulates the locally-based unemployed
to extend the area of search. Second, among those who do extend their search, RGM
increases the wage required to accept a local offer and decreases that required to induce
movement to a different area.2 And third, the unemployed may have been encouraged to search for jobs beyond their home municipality, as “move then search” migrants who
landed a job in the home area could not be entitled to RGM.
Spanish internal migration has been characterized as low by international
standards, as well as being poorly responsive to wages and unemployment; see, for
example, Bover and Velilla (2002). However, a growing trend in Spanish internal
migration has been observed since 1982 (Bover and Arellano 2002: Minondo et al.
2013). Furthermore, Mulhern and Watson (2009) conclude that its amenability to
traditional economic reasoning has improved since the labor market became more
flexible, and researchers made use of more disaggregated data and more sophisticated
modelling techniques.
Certain studies have analyzed the migration behavior of the unemployed in
Spain. Using microdata from the Spanish Migration Survey (MS) 1987-1991, Antolin
and Bover (1997) examined the influence of personal and regional unemployment on
male migration, finding that the probability of migration for a registered unemployed
4
RGM was targeted at registered job seekers may have something to do with this striking
result. Related work by Ahn et al. (1999), utilizing longitudinal data from the Spanish
Labor Force Survey (LFS) 1992-1994, found no significant differences between
unemployment benefits recipients and the only-registered unemployed in terms of
willingness to move for work.
During the period analyzed in this paper (1998-2007), the statistical reference
sources for the study of migratory movements in Spain were the Residence Variation
Statistics (RVS) and the Spanish Migration Survey (MS), both elaborated by the
National Statistics Institute (Instituto Nacional de Estadística, INE). Both the RVS and
MS measure changes in the municipality of residence. An advantage of the MS, which
was conducted in parallel with the LFS, is that it included information on migrant labor
force status. However, and mainly because determining family movement was not a
primary objective of the LFS (INE 2008), several studies have revealed that the MS
underestimated the number of migrants (e.g., see Martí and Ródenas 2004). Following,
among others, Devillanova and García-Fontes (2004) and Minondo et al. (2013), this
paper uses the Spanish Social Security’s Continuous Sample of Work Histories to
evaluate the effectiveness of RGM in fostering the geographical mobility of the
unemployed.
The rest of the paper is organized as follows. The next section describes the
intervention. The two sections that follow review the data, the selection of the sample,
the definition of the main variables, and the empirical strategy. In the spirit of a
difference-in-differences approach, we exploit the fact that RGM was not adopted in the
Basque Country and Navarre, in order to compare contracted labor migration rates
within and (in some specifications) into adopting and non-adopting territories of Spain.
5
RGM resulted in, at best, relatively few new migration flows. We conclude in the last
section.
The reform of the Spanish Personal Income Tax
The Spanish Personal Income Tax (PIT) Law 2002/46, with effective date January 1,
2003, introduced a reduction to gross income for taxpayers who, being unemployed and
registered as job seekers on Spain’s National System for Employment (NSE, the
Spanish public employment service), accepted a job offer in a municipality other than
that of their residence, and consequently moved to a new municipality. Officially
designed as a means of increasing labor mobility, the so-called reduction for
geographical mobility applied in the tax year of the move and the next,3 with no requirements as to the minimum duration of the accepted job or remaining in the new
municipality, but with the provision that the taxpayer resided for PIT purposes in an
autonomous region other than the Basque Country and Navarre.4
The Basque Country and Navarre, which, for historical reasons, have the power
to regulate their own income taxes, have not introduced RGM. Therefore, in terms of
the applicability of RGM, two territories can be distinguished that coincide with the two
models of regional financing in Spain: the so-called Common Fiscal Territory (CFT),
where the power to tax is attributed mainly to the central government, and the Basque
Country and Navarre (BCN), which enjoy broader taxing powers. The CFT is made up
of the regions shown in Figure 1 (other than the BCN) plus the Balearic Islands, the
Canary Islands, Ceuta, and Melilla.
For purposes of the PIT, the taxpayer’s region of residence is determined
countrywide by successively applying the following rules: i) Where the taxpayer stayed
6
her/his habitual dwelling is located); ii) where the taxpayer obtained the most gross
income over the tax year; and iii) the location of the taxpayer’s last residence declared
for PIT purposes. Thus, for example, if a registered unemployed individual living in
Barcelona (which is in the CFT) moved to Madrid (which is also in the CFT) to work
there from September 1, 2003, through August 31, 2004, he/she could apply RGM in
2003 and 2004. However, if the same individual was living in Bilbao (which is in the
BCN) and moved to Madrid to work there for the same period, he/she could apply RGM
in 2004 only. If the registered unemployed was living in Madrid and moved to Bilbao to
work there for the same period, he/she could apply RGM in 2003 only.
RGM could not be claimed if the taxpayer had signed a “discontinuously
permanent” work contract (widely used in Spain for seasonal work) and was just
seasonally unemployed, if the taxpayer was simultaneously working and receiving
unemployment benefits (due to, for example, a period of short-time work), or if the new
job was a grant-paid position. The tax agency could require the taxpayer to prove the
fulfillment of the conditions for claiming RGM. To this end, valid means of proof were
established in Spanish Law 2000/1 on Civil Procedure (with effective date January 8,
2001), and had to include a rental agreement as a valid means of proving the change of
municipality.
The reduction to gross income yielded by the RGM ranged from €2,400 to
€3,500, depending on the taxpayer’s net labor income and nonlabor income; see Table
1. Thus, for an individual taking the smallest possible RGM of €2,400 and a resulting
taxable income of €12,000 in both 2003 and 2004, the tax saving was of €600 (19
percent of the tax) in each of these years. As a comparison, the monthly unemployment
7
resulting taxable income of €24,000, the tax saving was of €726 in each of both years.
The amount of the RGM was increased slightly in 2007, coinciding with a reform of the
PIT (Spanish Law 2006/35, with effective date January 1, 2007). These amounts were
further increased by 2 percent in 2008 (except for the limit on non-labor income), and
remained unchanged until 2015, when RGM was converted into a deduction of total
labor income of €2,000 in the tax year of the move and the next.
The Advisory Panel on Income Tax Reform delivered its report to Spain’s
Secretary of Finance on April 3, 2002. Although aspects of the report were covered in
the media in the subsequent days, neither of the two measures recommended for
encouraging the geographical mobility of labor was specifically designed for
unemployed workers.6 Hence, it may not be too farfetched to say that it was not until the law 2002/46 was published on the Spanish Official Gazette (BOE) on December 19,
2002, that the specifics of RGM began to be known to the general public. This
circumstance raises the question of whether the slow diffusion of knowledge of RGM
led to sluggish growth of migration rates. This possibility (which is reinforced by the
data shown in Table 4 below) will be taken into account in the empirical specification.
Data and sample selection
Database
The data used here to assess the effect of the RGM come from the Continuous Sample
of Work Histories (Muestra Continua de Vidas Laborales, MCVL), an ongoing,
longitudinal dataset compiled annually by Spain’s Dirección General de Ordenación de
la Seguridad Social. In 2004, a 4-percent random sample of individuals affiliated with
Spanish Social Security, who were either working, receiving unemployment benefits
8
gathered these individuals’ complete Social Security affiliation history, including the
start and end dates of each affiliation spell, plus some information derived from the
Spanish Tax Agency and the Continuous Municipal Register. These original members
were then followed for each successive edition of the MCVL. If an original member had
no relationship with Social Security in the year of an MCVL iteration, he/she would be
replaced by another randomly selected individual who was affiliated with Social
Security during that year (and for whom the complete Social Security affiliation history
would be gathered). When an original member re-started her/his affiliation to the Social
Security, he/she would reappear in the MCVL edition of that year. We use the MCVL
data and fiscal information from the years 2004 to 2014.
The MCVL provides the province and the municipality (if the latter had more
than 40,000 inhabitants) of workplace establishments and public employment offices. In
Spain, every employee must be associated with a Social Security contribution account
code. This code is specific to each employer and each province, as Social Security
legislation requires employers to keep separate contribution account codes for each
province in which they operate. The municipality/province where the workplace
establishment is located is the municipality/province of destination. To claim UB, the
individual must first register in person as a job seeker at the public employment office
associated with her/his home address, a registration which is renewed periodically. At
the end of 2017, there were 711 public employment offices in Spain, covering all 50
provinces, plus Ceuta and Melilla. This figure has changed little since the mid 1990s
(cf. Toharia 1997). The municipality/province where the individual registers to claim
UB is the municipality/province of origin. Note that the municipality/province of origin
(destination) may not be the municipality/province where the individual lives when
9
Sample Selection
The selected spells of UB received were preceded and followed by non-overlapping
spells of employment and did not represent seasonal interruptions of the same job. As
UB recipients are registered as job seekers in the NSE, this group satisfies the
conditions for claiming the RGM in case of migration for work. The share of UB
recipients among the registered unemployed in Spain was 61% in 2003.7
Registering as a job seeker in order to claim UB seems a decision unrelated to
the propensity to migrate. However, individuals who searched prior to quit/layoff and
landed new jobs could have claimed UB in the interim of the job-to-job transition with
the primary intention of claiming RGM. If these individuals did not claim UB in the
absence of RGM, their behavior would upward-bias the estimated effect of RGM. This
reverse-causality argument will be investigated in the Results section.
The job prior to receiving unemployment benefits may have been left
involuntarily or voluntarily by the worker, but the spell of benefits must have been
terminated voluntarily (i.e. for work). The MCVL provides no information for periods
when the unemployed worker was not receiving UB, so that one cannot know whether,
after having exhausted UB, the individual continued to be registered at the NSE. (Even
if we could know this, the decision to renew the registration could be related to the
individual’s propensity to migrate for work.) Workers receiving Unemployment
Insurance (UI) benefits had an entitlement period ranging from 4 to 24 months.8 The duration of Unemployment Assistance (UA) benefits was 6 months renewable up to
maximum figures that depend on the contribution period and the age of the individual.
10
Individuals must have “accepted a job offer” to be able to apply RGM, but the
self-employed in the new job were excluded from the sample. To be included, the new
job must have started in the period 1998-2007, and the individual must be between 17
years and 61 years of age at the job start date. The decade 1998-2007 was a period of
steady economic growth in Spain, in which the unemployment rate decreased from 19
to 8 percent. The lower bound on age is because access to UB in Spain generally
required a minimum period of contribution of 6 months, with the minimum working age
being 16 years. The upper bound on age is intended to keep retirement considerations
low. Individuals aged 52 and older who were receiving UA benefits immediately before
the new job were excluded, as legislation effective in May 26, 2002, set specific
mobility incentives for this group.
Definition of Migration
As the province/municipality of residence is not available in the data, whether the
unemployed worker migrated or opted instead for commuting to the new workplace is
not clear-cut (see Giménez-Nadal and Molina 2014, 2016, 2019a, 2019b;
Gimémez-Nadal et al. 2018, 2019). To distinguish in practice between these cases, the following
rules are applied.
First, when the province of origin and destination were the same, it is assumed
that the individual commuted.9 Second, when the province of origin or destination was an island province (the Balearic Islands, Las Palmas, Santa Cruz de Tenerife), Ceuta, or
Melilla, it is assumed that the individual migrated.
Third, in contiguous Spain, when the municipality of origin and destination were
known (and were in different provinces), it is assumed that the individual migrated
11
when this distance was not greater than 120 km but the travel time by car was above the
99th percentile of one-way commuting time by car in the region of origin (listed in
Table 2). As an example of the consequences for sample selection of this criterion,
Table 3 shows straight-line distances and travel times by car between the 10
municipalities of the BCN identified in the data. 25 pairs of these municipalities (out of
the 29 possible different-province pairs) presented straight-line distances lower than 120
km. But 19 of these 25 pairs also presented travel times by car above the corresponding
99th percentile, and were, therefore, not excluded from the sample.
Fourth, in connection with Catalonia and the Region of Madrid, which were the
regions where the train was used most commonly by commuters in 2003, the individual
migrated whenever the travel time by train between two municipalities was above the
99th percentile of one-way commuting time by train in the region of origin.10 This criterion excluded the pairs Madrid – Ciudad Real, Madrid – Ávila, Madrid – Talavera
de la Reina, and Tarragona – Castellón.
Fifth, in contiguous Spain, when the municipalities of origin or destination were
unknown, it is assumed that the individual migrated whenever the province of origin
and destination were not contiguous. Finally, inter-provincial moves deemed to be
commuting were removed from the sample in order to sharpen our central comparison.
To what extent does the group of migrants so defined represent the treated
group? To investigate this issue, we gathered data from the Spanish Tax Agency’s
Statistic on Declarants of the Personal Income Tax and from the MCVL. The latter
provides information about factors reported to the tax agency that influence the amount
of withholding by the employer (though only for the year of that particular MCVL
edition). Table 4 presents the total number of employer reports with the RGM item filed
12
population number of migrants (in our sense) (columns 3 and 4), for each year of
2003-2007. The number of employer reports does not match the number of tax returns
because some employees did not communicate to the employer their entitlement to
RGM. That the number of tax returns falls short of the number of migrants may be due
to three reasons: migrants who were unaware of their entitlement to RGM, migrants
who were exempt from filing tax returns,11 and individuals classified as migrants who commuted or worked from home.12 The increase in the ratio of tax returns to migrants over time accords with the first reason. As to the third possibility, sources of data to
estimate the probabilities of misclassification are unknown.
Empirical Strategy
The challenge in estimating the effect of RGM is finding a control group that credibly
represents the mobility of UB recipients in its absence. According to the residence rules
for PIT purposes pointed out in the second section, RGM may have induced migration
flows within and into the CFT, and discouraged them within and into the BCN. Thus, a
test for evaluating the usefulness of RGM is to compare the difference, by territory of
destination, of UB recipients’ contracted migration rates before and after the
introduction of RGM. To do this, the following linear probability model (LPM) is
estimated by the method of ordinary least squares (OLS):
(
)
(
)
(
)
(
)
2007 1999 2007 2003 1998 2002.
ipt ipt t t ipt t p p py cft cft
cft
t
t
α δ θ
β ε = = ′ = + + × × × ×
+
−
+
−
+
∑
∑
z η (1)The binary variable
y
ipt is equal to 1 if UB recipient i’s job acceptance in province p13
effects, cftp is a dummy variable for accepting a job offer in a province of the CFT, and
ipt
z is a vector of control variables explained below. As discussed by Autor and Duggan
(2008), the parameter θ captures a linear trend in the CFT relative to BCN, prior to the
introduction of RGM, while
β
estimates any change in this trend following the intervention. The linear trend may not capture all non-cyclical movements in relativemigration rates, and may be unable to represent a slow diffusion of knowledge of RGM.
For a more flexible trend, we use a quadratic spline function, i.e. piecewise quadratic
polynomials with continuous first derivatives (Baum 2006):
(
)
(
)
(
)
(
)
(
(
)
)
2007 1 19992007 2 2007 2
2 1
1999 2003
1998
1998 2002
.
p ipt p
p p
ipt t
t
ipt
t t
y cft cft
cft cft
t
t
t
α δ θ
θ β ε
= = = ′ = + + × × + × × × ×
+
−
−
+
−
+
∑
∑
∑
z η (2)A problem with this approach is that RGM may have induced migration flows
into the BCN and might be irrelevant for certain migration flows into the CFT. Suppose,
for example, that UB recipients living in Madrid (Bilbao) and accepting job offers in
Bilbao (Madrid) consider their move to be short, so that their tax residence will not
change. Then, RGM would (not) have induced them to migrate. Hence, a more powerful
test for evaluating the efficacy of RGM may be given by comparing intra-territory
contracted migration rates before and after the introduction of RGM.
The differential change in migration flows within the CFT, relative to migration
flows within the BCN (denoted by
β
in equation 3), is expected to be positive after the introduction of RGM. To calculate this differential change, the following LPM (whichis analogous to that employed by Goodman 2017 to identify the internal migration
14
(
)
(
)
(
)
(
)
2007 1999 2007 2003 1998 2002.
ipt ipt t t ipt t p p py cft cft
cft
t
t
α δ θ
β ε = = ′ = + + × × × ×
+
−
+
−
+
∑
∑
z η. (3)
The binary variable
y
ipt is equal to 1 if UB recipient i’s job acceptance in year tresulted in migration to a province of the same territory as her/his province of origin,
and equal to 0 if i did not migrate or migrated to a province of the other territory.
Abusing somewhat the notation, the province of origin is denoted by p in equation (3),
so
cft
p is here a dummy variable for receiving UB in a province of the CFT. For more flexible trends than in the linear case, the following model is also estimated:(
)
(
)
(
)
(
)
(
(
)
)
2007 1 1999 2007 2007 2 2 2 1 1999 2003 19981998 2002
.
p ipt p
p p
ipt t
t
ipt
t t
y cft cft
cft cft
t
t
t
α δ θ
θ β ε
= = = ′ = + + × × + × × × ×
+
−
−
+
−
+
∑
∑
∑
z η (4)We would like to emphasize that the term cftp captures time-constant
differences in the propensity to migrate between the CFT and the BCN, stemming for
example from different industry structures, culture, or institutions. Also, although the
MCVL includes earnings data obtained from income tax records, we discarded an
empirical approach exploiting differing “treatment intensity” across individuals or
provinces because income in the year of the move and the next is not predetermined to
the decision to migrate.
In equations (1)-(4), zipt includes the province-year unemployment rate plus
individual characteristics that may significantly affect the decision to migrate of the
unemployed individual (see DaVanzo 1978; Goss and Paul 1990; Goss and Schoening
1984; Harkman 1989; Schlottmann and Herzog 1981; Tatsiramos 2009; see also Herzog
15
quadratic in age at the job start date (measured in deviations from 35 years), educational
attainment, whether the individual had previously migrated internally (i.e., whether the
province of origin differed from the province where he/she was first affiliated with
Social Security), whether the individual is an immigrant, whether the individual is male,
the occupational skill level of the previous job, whether the individual was voluntarily
unemployed, the duration (in weeks) of the UB spell, and whether the individual was
receiving UA benefits immediately before the new job. (Unfortunately, the MCVL does
not collect retrospective information on family factors affecting the decision to migrate:
e.g., DaVanzo 1978; Lansing and Mueller 1967; Mincer 1978; Van Dijk et al. 1989.)
Province-year unemployment rates can account for time-variant local economic
conditions relevant to the decision to migrate, while individual-level controls can
account for differences in the composition of the samples and can additionally provide
precision to the estimates.
Sample descriptive statistics are presented in Table 5. The overall contracted
migration rate (calculated as the sample mean of yipt) is 5.1 percent, whereas the overall
intra-territory contracted migration rate (calculated as the sample mean of yipt) is 4.6
percent. Using the MCVL, but defining migrations as interregional changes, Minondo et
al. (2013) report that, in the period 2004-2011, the proportion of economically active
persons who accepted a job offer in a region other than that of their previous job was
3.5 percent.
Results
Reverse Causality
Individuals who searched prior to quit/layoff and landed new jobs could have claimed
16
This behavior would show up as a prominent increase in the contracted migration rate
of individuals with very short spells of UB receipt. Figure 2 presents contracted
migration rates by decile of days receiving UB, for both pre-treatment and
post-treatment years. Migration rates in the second to fourth lowest deciles increased after
the introduction of RGM, but the migration rate in the lowest decile (1 to 8 days
receiving UB) did not. Intra-territory contracted migration rates display the same pattern
(Figure 3). The stability of the migration rate in the lowest decile puts the reverse
causality caveat into question.
Visual Evidence of the Main Result
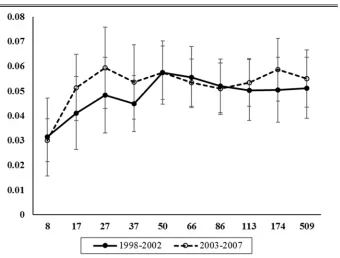
Figure 4 shows the evolution of contracted migration rates by territory of destination
(CFT or BCN) and year, as well as the difference between both. Migration rates within
and into the CFT were higher over the whole period. The decrease and rapid increase
observed in the series for the BCN around the year 2000 may be related to the change in
the sign of net migration in the Basque Country. This was about -2,000 individuals in
1998 and then grew almost steadily to some +16,000 individuals in 2007 (net migration
in Navarre was slightly negative throughout the sample period), a fact that
Sanso-Navarro et al. (2017) relate to the declining violent activity of Euskadi ta Askatasuna
(ETA), the Basque terrorist group. While the difference in means increased in 2003, the
jump does not appear large and was not sustained. However, it is possible that the
incentive to accept jobs in the CFT created by RGM was counteracted by other trends,
as for example the decrease of ETA actions. This is the main reason why specifications
(1)-(4) control for differential trends between the CFT and the BCN.
Using the same layout as Figure 4, Figure 5 shows the evolution of
17
the former, over the whole period, as this territory comprises more provinces to migrate
to. There is also an increase in the difference in means in 2003, which, again, does not
appear large and was not prolonged.
Regression Estimates
Columns (1) to (4) of Table 6 present, respectively, the main estimates from
specifications (1) to (4) above. Results in columns (1) and (2) refer to contracted
migration rates by territory of destination, whereas those in columns (3) and (4) are for
intra-territory contracted migration. Differential trends in migration rates are
represented by a linear spline in odd-numbered columns and by a quadratic spline in
even-numbered columns.
In column (1), the estimate of .0156 (S.E. = .0102) for
δ
suggests that, in 1998,the contracted migration rate within and into the CFT was 1.56 percentage points higher
than the corresponding rate in the BCN. The estimate of -.0012 (S.E. = .0015) for
θ
suggests that this difference was decreasing by 0.12 percentage points per year prior to
the introduction of RGM. According to the estimate of .0014 (S.E. = .0022) for
β
, thisdownward trend stopped following the policy change. Since 2002, the contracted
migration rate within and into the CFT increased by 0.02 percentage points more per
year than the corresponding rate in the BCN. Figure 6 plots this evolution (using a solid
line), as well as that predicted by the estimates developed with a quadratic spline,
shown in column 2 (using a dashed line). Looking at this figure, the overall impression
is that RGM may have promoted migrations within and into the CFT, but the effect, if
any, is small and does not appear to grow over time.
The results presented in columns (3) and (4) are even less supportive of an
18
contrasted basis for evaluating the efficacy of RGM. In column (3), the estimate for
δ
suggests that the contracted migration rate within the CFT was 1.89 percentage pointshigher than the corresponding rate in the BCN in 1998. This discrepancy was then
growing by 0.11 percentage points per year (S.E. = 0.16) prior to the introduction of
RGM. The estimate of -.0002 (S.E. = .0020) for
β
suggests that this tendencycontinued almost unchanged after the intervention. Figure 7 shows that this conclusion
differs little from that yielded by the estimates developed with a quadratic spline
presented in column (4).
Our estimates of the effect of the RGM are certainly imprecise, which is a
consequence of the small size of the control territory. In the sample, the number of job
acceptances resulting in a migration within or into the BCN ranges from 70 in 1999 to
147 in 2005. Looking back at the estimated
β
in column (1) of Table 6, the top of the 95 percent confidence interval is .0058. Assuming that the number of job acceptances inthe CFT, plus migration rates within and into the BCN, held unchanged at their 2002
levels, the upper bound of .0058 would imply that the population number of contracted
migrations within or into the CFT increased by 4,531 in 2003 as a consequence of the
intervention, corresponding to 4,050 new migrants and to 10.0 percent of the migrants
observed in 2003 (column 4 of Table 4).13 A similar calculation suggests that, with a 95 percent confidence, RGM would be responsible for, at most, 7.0 percent of the migrants
within CFT observed in 2003.
Table 6 also lists the estimated effects of the province-year unemployment rate
and the individual-level controls. The higher the unemployment rate in the province of
destination (the province of origin), the lower (the higher) the probability of migrating
to (from) that province. This result concurs with Mulhern and Watson’s (2009) assertion
19
Significant effects are also found among the individual controls. Previous internal
migrants are 4.63 (4.43) percentage points more likely to migrate (migrate
intra-territorially) than otherwise comparable UB recipients, which represents a 92 percent
(96 percent) increase in the propensity to migrate (migrate intra-territorially). With other
factors held unchanged, immigrants are 1.01 percentage points more likely to migrate
intra-territorially, whereas the effect on the likelihood of migration is measured
imprecisely. As in Devillanova and García-Fontes (2004), the degree of mobility
increases steadily with the qualification of the previous job. In comparison with UB
recipients having less than a high school diploma, individuals having a high school
diploma are 0.49 (0.72) percentage points more likely to migrate (migrate
intra-territorially), while individuals having a college degree are 0.85 (1.25) percentage points
more likely to migrate (migrate intra-territorially). The effect of age on the likelihood of
migration is hump-shaped, peaking at 28 years, whereas the effect on the likelihood of
intra-territory migration decreases regularly as individuals age. Being male increases the
likelihood of migration by 3.83 percentage points (2.85 percentage points in the case of
intra-territory migration). As predicted by Goss and Paul (1990), UB recipients who are
voluntarily unemployed are more mobile. In comparison with UI benefits recipients,
UA benefits recipients are 0.97 percentage points less likely to migrate intra-territorially
(the effect on the likelihood of migration is measured imprecisely), which is in line with
Tatsiramos’ (2009) finding for Spain that receiving UB increases the probability of
moving. As hypothesized by Harkman (1989), the likelihood of migration increases
20
Robustness Checks
Table 7 presents estimated beta coefficients developed from specifications (1)-(4), but
in which the term cftp has been replaced by a complete set of destination/origin
province fixed effects (thus accounting for different mobility attitudes across
provinces), and in which the linear/quadratic spline specific to the CFT has been
replaced by linear/quadratic splines specific to each province of destination/origin. The
conclusion that the effect of RGM is small or nonexistent is robust to this change.
It was assumed that the individual migrated when the travel time between two
known municipalities in different provinces of contiguous Spain was greater than the
99th percentile of one-way commuting time in the region of origin. Setting this
threshold at the 99.5th percentile (listed in Table 2 for commuting by car; in the case of
commuting by train the 99th and 99.5th percentiles are the same) reduces the incidence
of “false positives” (i.e. commuters classified as migrants), but curtails the control
territory. This change reduced slightly the discrepancy between RGM filings and
migrants shown in Table 4. The number of migrants within or into the CFT (within the
CFT) now ranges from 40,100 (38,600) in 2003 to 53,515 (51,225) in 2007. As to the
impact on the estimated effect of RGM, Table 8 presents the main coefficients of
specifications (1)-(4) above, re-estimated under the new definition of migration.
Irrespective of the specification, the estimated effect of RGM appears to be
non-positive.
Conclusions
The introduction of a reduction to gross income for geographical mobility (RGM) in the
Spanish personal income tax since the year 2003 created an incentive to move for the
21
another municipality obtained a tax saving which (depending on individual
circumstances) could well be more than one month of unemployment benefits. The
incentive to move created by RGM was stronger for individuals not living in the Basque
Country and Navarre (BCN), as these regions of Spain did not adopt RGM. Using a
nationally representative administrative data source, this paper has quantitatively
assessed RGM’s effectiveness among the population of unemployment benefits (UB)
recipients, using a difference-in-differences econometric approach. Controlling for
differential trends in migration rates between the BCN and the parts of Spain that
adopted RGM (the so-called Common Fiscal Territory, CFT), the estimated effect of
RGM ranges from small to nonexistent. Under some assumptions, and with a 95 percent
confidence, RGM appears to have induced, at most, 7.0 percent (10.0 percent) of the
UB recipients’ migration flows within (within or into) the CFT in the year 2003.
Whether an increase in the amount of the reduction will enhance RGM’s effectiveness
remains to be determined.
Acknowledgements We are indebted to the Spanish Tax Agency, the Spanish State
Public Employment Service, the tax administrations of the Basque provinces of Alava,
Gipuzkoa, and Biscay, and the tax administration of the autonomous region of Navarre
for helpful advice; and to Carlos Aller, Tony Grubesic, Francesco Pastore, and Sylvain
Weber for helpful comments and suggestions.
Funding This study was funded by the Government of Aragón (Projects S32-17R and
S42-17R) and co-financed with FEDER 2014-2020.
22
References
Ahn, N., de la Rica, S., & Ugidos, A. (1999). Willingness to move for work and
unemployment duration in Spain. Economica 66: 335-357.
Antolin, P., & Bover, O. (1997). Regional migration in Spain: The effect of personal
characteristics and of unemployment, wage and house price differentials using
pooled cross-sections. Oxford Bulletin of Economics and Statistics 59(2):
215-235.
Autor, D.H., & Duggan, M. (2008). The effect of transfer income on labor force
participation and enrollment in federal benefits programs: Evidence from the
Veterans Disability Compensation program. Report to the U.S. Social Security
Administration.
Baum, C.F. (2006). An Introduction to Modern Econometrics Using Stata. College
Station: Stata Press.
Bover, O., & Arellano, M. (2002). Learning about migration decisions from the
migrants: Using complementary datasets to model intra-regional migrations in
Spain. Journal of Population Economics 15: 357-380.
Bover, O., & Velilla, P. (2005). Migrations in Spain: Historical background and current
trends. In K.F. Zimmermann (ed.), European migration: What do we know?
Oxford: Oxford University Press.
DaVanzo, J. (1978). Does unemployment affect migration? Evidence from microdata.
Review of Economics and Statistics 60(4): 504-514.
Devillanova, C., & García-Fontes, W. (2004). Migration across Spanish provinces:
Evidence from the Social Security Records (1978-1992). Investigaciones
23
Escario, J.J., & Molina, J.A. (2004). Modeling the optimal fiscal policy on tobacco
consumption. Journal of Policy Modeling 26: 81-93.
Giménez-Nadal, J.I., & Molina, J.A. (2019a). Green commuting and gasoline taxes in
the United States. Energy Policy 132: 324-331.
Giménez-Nadal, J.I., & Molina, J.A. (2019b). Daily feelings of U.S. workers and
commuting time. Journal of Transport & Health 12: 21-33.
Giménez-Nadal, J.I., & Molina, J.A. (2016). Commuting time and household
responsibilities: evidence using propensity score matching. Journal of Regional
Science 56: 332-259.
Giménez-Nadal, J.I., & Molina, J.A. (2014). Commuting time and labor supply in the
Netherlands: a time use study. Journal of Transport Economics and Policy 48:
409-426.
Giménez-Nadal, J.I., Molina, J.A. & Velilla, J. (2019). Modeling commuting time in the
U.S.: Bootstrapping techniques to avoid overfitting. Papers in Regional Science.
DOI:10.1111/pirs.12424.
Giménez-Nadal, J.I., Molina, J.A. & Velilla, J. (2018). The commuting behavior of
workers in the United States: differences between the employed and the
self-employed. Journal of Transport Geography 66:19-29.
Goodman, L. (2017). The effect of the affordable care act Medicaid expansion on
migration. Journal of Policy Analysis and Management 36(1): 211-238.
Goss, E.P., & Paul, C. (1990). The impact of unemployment insurance benefits on the
probability of migration of the unemployed. Journal of Regional Science 30(3):
349-358.
Goss, E.P., & Schoening, N.C. (1984). Search time, unemployment and the migration
24
Greenwood, M.J. (1997). Internal migration in developed countries. In M.R.
Rosenzweig and O. Stark (eds.), Handbook of Population and Family
Economics. North Holland.
Harkman, A. (1989). Migration behavior among the unemployed and the role of
unemployment benefits. Papers of the Regional Science Association 66:
143-150.
Herzog, H.W. Jr., Schlottmann, A.M., & Boehm, T.P. (1993). Migration as spatial
job-search: A survey of empirical findings. Regional Studies 27(4): 327-340.
INE (2008). Migration Survey. Methodology. Available at:
http://www.ine.es/en/daco/daco42/migracion/migra08_en.pdf. Last access: July
22, 2018.
Kramer, K.Z., Drumond Andradre, F.C., Greenlee, A.J., Mendenhall, R., Bellisle, D., &
Blanks, R.L. (2019). Periodic Earned Income Tax Credit (EITC) payment,
financial stress and wellbeing: a longitudinal study. Journal of Family and
Economic Issues. http://doi.org/10.1007/s10834-019-09618-2.
Labeaga, J.M., Molina, J.A., & Navarro, M. (2011). Deprivation using satisfaction
measures in Spain: An evaluation of unemployment benefits. Journal of Policy
Modeling 33: 287-310.
Lansing, J.B., & Mueller, E. (1967). The geographic mobility of labor. Ann Arbor,
Michigan: Survey Research Center, University of Michigan.
Mammen, S., Lawrence, F.C., Marie, P.S., Berry, A.A., & Knight, S.E. (2011). The
Earned Income Tax Credit and rural families: Differences between
non-participants and non-participants. Journal of Family and Economic Issues 32:
25
Martí, M., & Ródenas, C. (2004). Migrantes y migraciones: de nuevo la divergencia en
las fuentes estadísticas. Estadística Española 46(156): 293-321.
Mincer, J. (1978). Family migration decisions. Journal of Political Economy 86:
749-773.
Minondo, A., Requena, F., & Serrano, G. (2013). Migratory moves in Spain before and
after 2008. Papeles de Economía Española 138: 80-97. (Spanish, with English
summary.)
Molho, I. (2001). Spatial search, migration, and regional unemployment. Economica 68:
269-283.
Mulhern, A., & Watson, J.G. (2009). Spanish internal migration: Is there anything new
to say? Spatial Economic Analysis 4(1): 103-120.
Plantenga, J. & C. Remery. 2010. Flexible working time arrangements and gender
equality. A comparative review of 30 European countries. Luxembourg:
Publications Office of the European Union.
Sanso-Navarro, M., Sanz-Gracia, F., & Vera-Cabello, M. (2017). The demographic
impact of terrorism: Evidence from municipalities in the Basque Country and
Navarre. Available at SSRN: https://ssrn.com/abstract=2859042.
Schlottmann, A.M., & Herzog, Jr. H.W. (1981). Employment status and the decision to
migrate. Review of Economics and Statistics 63: 590-598.
Silvers, A. (1977). Probabilistic income maximizing behavior in regional migration.
International Regional Science Review 2: 29-40.
Stöwhase, S. (2016). Horizontal inequities in the German Tax-Benefit System: The case
of two wage-earner employee households. Journal of Family and Economic
26
Tatsiramos, K. (2009). Geographic labor mobility and unemployment insurance in
Europe. Journal of Population Economics 22: 267-283.
Toharia, L. (1997). The labor market in Spain. Luxembourg: Office for Official
Publications of the European Communities.
Van Dijk, J., Folmer, H., Herzog, Jr. H.W., & Schlottmann, A.M. (1989). Labor market
institutions and the efficiency of interregional migration: a cross-nation
comparison. In J. Van Dijk, H. Folmer, H.W. Herzog, Jr., and A.M. Schlottmann
(eds), Migration and Labor Market Efficiency. Kluwer Academic.
Weber, S., & Péclat, M. (2017). A simple command to calculate travel distance and
travel time. IRENE Working Paper 16-10, University of Neuchatel.
Jorge González-Chapela is associate professor of economics at Centro Universitario
de la Defensa (CUD) de Zaragoza. He is a graduate from the University of Santiago de
Compostela and holds a PhD from the University Pompeu Fabra. He has been at CUD
since 2013. Prior to that, he held positions at Alicante and Girona Universities, and at
Mannheim (now Munich) Center for the Economics of Aging. His research interests lie
within applied microeconomics. Specifically, he has worked on time allocation and
labor supply, households' debt repayment, public procurement, and internal migration.
In 2017, he was honored with the CUD Excellence in Teaching Award for the success
of his classes on fundamentals of administration as rated by students.
Raquel Ortega-Lapiedra holds a PhD in Economics since 1999 by the University of
Zaragoza, having spent most of his doctoral thesis at Warwick University (UK). She is
associate professor at the Department of Organization and Management of the
27
activity in different areas of work, Intellectual Capital, Public-Private Management and
Work-Life Balance. Raquel has taught in various professional programs at Instituto de
Empresa (IE) and is the main Researcher of several projects of public consultation (eg
Ministry of Defence and Government of Aragon) and private (FUNDEAR). She is
member of projects of the Spanish Ministry of Economy and Competitiveness. Raquel
Ortega has been Research Visiting at Warwick University (UK), the University of
Rhode Island (USA) and Boston College (USA), and has published their research
28
Table 1 Reduction for geographical mobility
Since: Reduction to: Amount (€; in year of move and next): Amount applies if:
Jan 1, 2003 Gross income 3,500 NI ≤ 6,500 and 0 < LI ≤ 8,200
3,500 – 0.2291(LI – 8,200) NI ≤ 6,500 and 8,200 < LI ≤ 13,000
2,400 NI > 6,500 or NI ≤ 6,500 and LI > 13,000
Jan 1, 2007 Gross income 4,000 NI ≤ 6,500 and 0 < LI ≤ 9,000
4,000 – 0.35(LI – 9,000) NI ≤ 6,500 and 9,000 < LI ≤ 13,000
2,600 NI > 6,500 or NI ≤ 6,500 and LI > 13,000
Jan 1, 2008 Gross income 4,080 NI ≤ 6,500 and 0 < LI ≤ 9,180
4,080 – 0.35(LI – 9,180) NI ≤ 6,500 and 9,180 < LI ≤ 13,260
2,652 NI > 6,500 or NI ≤ 6,500 and LI > 13,260
Jan 1, 2015 Labor income 2,000 ‒
29
Table 2 Commuting time by car in Spanish regions in 2003 (minutes,
one way)
Median 95 pctl 99 pctl 99.5 pctl
Andalusia 20 60 90 90
Aragon 20 40 80 90
Asturias 20 40 60 70
Balearic Islands 20 50 70 80
Canary Islands 30 70 100 120
Cantabria 20 60 70 80
Castile and Leon 20 40 100 140
Castile-La Mancha 20 60 60 100
Catalonia 20 60 90 120
Valencian Region 20 60 70 70
Extremadura 10 40 50 70
Galicia 20 60 70 90
Region of Madrid 30 70 80 90
Region of Murcia 20 60 80 90
Navarre 20 50 60 60
Basque Country 20 50 60 70
La Rioja 20 40 60 80
Ceuta 10 30 40 40
Melilla 10 30 40 40
30
Table 3 Straight-line distance (km) and travel time by car (minutes)
between cities of the Basque Country and Navarre included in the data
Irún (GI) San Sebastián (GI) Vitoria (AL) Pamplona
Barakaldo (BI) 97; 87 82; 74 56; 55a 122; 109
Basauri (BI) 90; 77 74; 64 47; 48a 112; 102
Bilbao (BI) 94; 82 79; 69 52; 51a 118; 106
Getxo (BI) 99; 87 83; 75 62; 58a 126; 113
Portugalete (BI) 100; 94 84; 81 60; 59a 125; 114
Santurtzi (BI) 101; 92 86; 79 62; 58a 128; 113
Irún (GI) 91; 85 60; 77
San Sebastián (GI) 78; 71 62; 63
Vitoria (AL) 85; 71
The first entry in a cell is the straight-line distance calculated using the Stata program geodist. The second entry is the travel time by car under
normal traffic conditions calculated using the Stata program georoute.
31
Table 4 Declarants of the personal income tax and migrants (by
year)
(1) (2) (3) (4)
Year
Employer reports with the RGM
item filleda
Tax returns claiming the
RGMb
Migrants within
CFTa,c Migrants within or into CFTa,d
2003 14,176 39,150 40,650
2004 10,700 17,038 44,225 46,400
2005 13,425 20,338 43,925 46,150
2006 15,575 24,693 44,925 47,600
2007 17,300 25,506 51,950 54,300
a: Population estimates developed with data from the MCVL. b:
Figures from the Spanish Tax Agency’s Statistic on Declarants of the Personal Income Tax, including individual and joint tax returns claiming the RGM. c: Unemployment benefits recipients
aged 17-60 whose job acceptance resulted in a migration (in our sense) within the CFT. d: Unemployment benefits recipients
32
Table 5 Descriptive statistics: 1998-2007 Continuous Sample of Work Histories
Variable Mean S.D. Min Max
Age (years) 35.39 9.59 17 60
Unemp. duration (weeks) 10.71 11.39 0.14 72.71
Province-year U-rate (%) 11.34 5.24 3.03 37.16
Variable (%) Mean Variable (%) Mean
Migrated (y=1) 5.06 University degree 9.94
Migrated intra-area (y=1) 4.62 Exactly high school 27.61
Origin in CFT 92.33 Less than high school 62.44
Origin in BCN 7.67 Previous internal migrant 14.05
Destination to CFT 92.31 Immigrant 9.17
Destination to BCN 7.69 Male 60.46
Job acceptance in 1998 6.64 Very-high-skilled occupation 2.59
Job acceptance in 1999 7.51 High-skilled occupation 5.29
Job acceptance in 2000 7.81 Medium-high-skilled occupation 11.44
Job acceptance in 2001 8.70 Medium-low-skilled occupation 54.06
Job acceptance in 2002 9.56 Low-skilled occupation 26.63
Job acceptance in 2003 10.14 Voluntarily unemployed 0.51
Job acceptance in 2004 11.65 Receiving UI benefits 94.50
Job acceptance in 2005 11.55 Receiving UA benefits 5.50
Job acceptance in 2006 12.43
Job acceptance in 2007 14.01
33
Table 6 Estimated impact of the reduction for geographical mobility: changes in contracted migration rates of
unemployment benefits recipients in the common fiscal territory relative to the Basque Country and Navarre, 1998-2007
(1) (2) (3) (4)
Difference in contracted migration rates by territory of destination
Difference in intra-territory contracted migration rates
Coeff. S.E. Coeff. S.E. Coeff. S.E. Coeff. S.E.
Job acceptance in CFT .0156 .0102 .0118 .0101
Job acceptance in CFT×(year - 1998)
×1[year≥1999] -.0012 .0015 .0035 .0027
Job acceptance in CFT×(year - 1998)2
×1[year≥1999] -.0008 .0006
Job acceptance in CFT×(year - 2002)
×1[year≥2003] .0014 .0022
Job acceptance in CFT×(year - 2002)2
×1[year≥2003] .0015 .0011
Receiving benefits in CFT .0189* .0107 .0168 .0116
Receiving benefits in CFT×(year - 1998)
×1[year≥1999] .0011 .0016 .0038 .0035
Receiving benefits in CFT×(year - 1998)2
×1[year≥1999] -.0005 .0005
Receiving benefits in CFT×(year - 2002)
×1[year≥2003] -.0002 .0020
Receiving benefits in CFT×(year - 2002)2
×1[year≥2003] .0008 .0008
Destination/Origin province-year U-rate -.0019** .0009 -.0019** .0009 .0038*** .0005 .0038*** .0005
Age (‒ 35 years) -.0003*** .0001 -.0003*** .0001 -.0004*** .0001 -.0004*** .0001
Age squared -.00002** .00001 -.00002** .00001 -.00001 .00001 -.00001 .00001
University degree .0085 .0053 .0085 .0053 .0125** .0052 .0125** .0052
Exactly high school .0049** .0023 .0049** .0023 .0072** .0030 .0072** .0030
Previous internal migrant .0463*** .0059 .0463*** .0059 .0443*** .0038 .0442*** .0038
Immigrant .0013 .0098 .0013 .0098 .0101*** .0033 .0101*** .0033
Male .0383*** .0054 .0383*** .0054 .0285*** .0035 .0285*** .0035
Very-high-skilled occupation .0454** .0173 .0454** .0173 .0451*** .0114 .0451*** .0114
High-skilled occupation .0521*** .0067 .0521*** .0067 .0525*** .0074 .0525*** .0074
Medium-high-skilled occupation .0219*** .0017 .0219*** .0017 .0246*** .0030 .0246*** .0030
Medium-low-skilled occupation .0170*** .0017 .0170*** .0017 .0172*** .0028 .0172*** .0028
Voluntarily unemployed .0122** .0057 .0122** .0057 .0106* .0055 .0106* .0055
Unemp. duration (weeks) .0002* .0001 .0002* .0001 .0002** .0001 .0002** .0001
Receiving UA benefits .0013 .0044 .0013 .0044 -.0097*** .0026 -.0097*** .0026
Year fixed effects YES YES YES YES
Observations 355,395 355,395 355,395 355,395
Clusters 52 52 52 52
R-squared .0189 .0189 .0239 .0239
34
Table 7 Estimated impact of the reduction for geographical mobility: changes in contracted migration rates of
unemployment benefits recipients in the common fiscal territory relative to the Basque Country and Navarre, 1998-2007
(1) (2) (3) (4)
Difference in contracted migration rates by territory of destination
Difference in intra-territory contracted migration rates
Coeff. S.E. Coeff. S.E. Coeff. S.E. Coeff. S.E.
Job acceptance in CFT×(year - 2002)×
1[year≥2003] .0013 .0021
Job acceptance in CFT×(year - 2002)2×
1[year≥2003] .0019* .0011
Receiving benefits in CFT×(year - 2002)
×1[year≥2003] .0002 .0012
Receiving benefits in CFT×(year - 2002)2
×1[year≥2003] .0007 .0008
Destination/Origin province fixed effects YES YES YES YES
Year fixed effects YES YES YES YES
Destination/Origin province × time trend YES YES YES YES
Destination/Origin province × time2 trend NO YES NO YES
Destination/Origin province-year U-rate YES YES YES YES
Individual-level controls YES YES YES YES
Observations 355,395 355,395 355,395 355,395
Clusters 52 52 52 52
R-squared .0282 .0286 .0347 .0352
35
Table 8 Estimated impact of the reduction for geographical mobility: Changes in contracted migration rates of
unemployment benefits recipients in the common fiscal territory relative to the Basque Country and Navarre, 1998-2007. Migration threshold set at 99.5th percentile of commuting time
(1) (2) (3) (4)
Difference in contracted migration rates by territory of destination
Difference in intra-territory contracted migration rates
Coeff. S.E. Coeff. S.E. Coeff. S.E. Coeff. S.E.
Job acceptance in CFT .0204** .0098 .0160* .0095
Job acceptance in CFT×(year - 1998)
×1[year≥1999] .0007 .0016 .0070** .0030
Job acceptance in CFT×(year - 1998)2
×1[year≥1999] -.0013** .0005
Job acceptance in CFT×(year - 2002)
×1[year≥2003] -.0013 .0023
Job acceptance in CFT×(year - 2002)2
×1[year≥2003] .0018* .0010
Receiving benefits in CFT .0222* .0116 .0193 .0126
Receiving benefits in CFT×(year - 1998)
×1[year≥1999] .0027* .0014 .0070** .0033
Receiving benefits in CFT×(year - 1998)2
×1[year≥1999] -.0009* .0005
Receiving benefits in CFT×(year - 2002)
×1[year≥2003] -.0028* .0016
Receiving benefits in CFT×(year - 2002)2
×1[year≥2003] .0010 .0009
Year fixed effects YES YES YES YES
Destination/Origin province-year U-rate YES YES YES YES
Individual-level controls YES YES YES YES
Observations 354,824 354,824 354,824 354,824
Clusters 52 52 52 52
R-squared .0186 .0186 .0245 .0245
36
Figure 1 Autonomous regions of contiguous Spain
Andalusia
Aragon Cantabria
Castile-La Mancha
Castile-Leon Catalonia
Region of Madrid
Navarre
Valencian Region Extremadura
Galicia
La Rioja Basque Country Asturias
37
Figure 2 Contracted migration rates of unemployment benefits recipients, by
decile of days receiving benefits and period
38
Figure 3 Intra-territory contracted migration rates of unemployment benefits
recipients, by decile of days receiving benefits and period
39
Figure 4 Contracted migration rates by territory of destination and year
40
Figure 5 Intra-territory contracted migration rates, by territory and year
41
Figure 6 Estimated impact of the reduction for geographical mobility:
difference in contracted migration rates of unemployment benefits recipients by territory of destination
42
Figure 7 Estimated impact of the reduction for geographical mobility:
difference in intra-territory contracted migration rates of unemployment benefits recipients
The figure plots the estimated difference between the CFT and the BCN as developed with estimates shown in columns (3) and (4) of Table 6.
1 Spanish Tax Agency’s Statistic on Declarants of the Personal Income Tax.
2 We showed that the reservation wage for distant offers decreases by calculating the
derivate of a rearrangement of expression (4) of Molho (2001) with respect to the costs
of migrating (denoted by m), and then totally differentiating expression (6) of Molho
(2001) with respect to m.
3 In Spain, the personal income tax year coincides with the calendar year.
4 Since 1995, Spain is organized in 17 autonomous regions plus two autonomous towns
(Ceuta and Melilla, on the north coast of Africa). For brevity, they all will be called
“regions.” Some autonomous regions are divided into provinces, for a total of 50
provinces.
5 Spain’s Ministry of Labor, Migration, and Social Security Statistical Yearbook.
6 The report proposed deducting moving expenses of job transfers plus a better fiscal
43
7 Spain’s Ministry of Labor, Migration, and Social Security Statistical Yearbook. 8
The Spanish Legislative Decree 1994/1 regulated the unemployment protection over
the period covered by this analysis.
9 The only exception to this rule are moves between the municipality of Arrecife (in the
island of Lanzarote) and the municipalities of Las Palmas de Gran Canaria, Santa Lucía
de Tirajana, or Telde (in the island of Gran Canaria), all of them located in the province
of Las Palmas. Spain’s provinces are generally small. Of the 503 pairs of same-province
municipalities identified in the data (excluding the three inter-island cases indicated
above), only 9 cases presented travel times by car above the 99th percentile of one-way
commuting time by car in the corresponding region. The Stata programs geocodehere,
geodist, and georoute were utilized to, respectively, assign geographic coordinates to
the 147 municipalities identified in the data, calculate straight-line distances between
pairs of municipalities, and calculate travel times by car “under normal traffic
conditions” (Weber and Péclat 2017). The distribution of one-way commuting time by
car in each region was calculated using the 2002-2003 Spanish Time Use Survey
(STUS).
10
90 minutes in Catalonia and 110 minutes in the Region of Madrid. Travel time by
train was taken from the National Network of Spanish Railways Organization’s (Renfe)
website in December 2017. Commuting time by train was calculated using the
2002-2003 STUS.
11 Taxpayers with labor income below a certain limit were exempt from filing tax
returns. For taxpayers having two or more payers during the year, the limit was 8,000
euros (10,000 euros in 2007) when the sum of the amounts received from the second
and remaining payers in order of importance was greater than 1,000 euros (1,500 euros),
44
12 Working from home was rather infrequent in Spain. In 2004, the proportion of male
(female) employees aged 15+ usually working from home was 0.2 percent (0.5 percent)
(Plantenga and Remery 2010).
13 In 2002, the population number of job acceptances in the CFT made by UB recipients
living in any part of Spain was 781,275. Multiplying this number by .0058 gives the
number of new migrations induced by RGM. In 2003, the average number of migrations
within or into the CFT per migrant was 1.1187 (1.1169 in the case of migrations within