• No results found

Infiltration, Runoff, and Sediment Yield in Response to Western Juniper Encroachment in Southeast Oregon

N/A
N/A
Protected

Academic year: 2020

Share "Infiltration, Runoff, and Sediment Yield in Response to Western Juniper Encroachment in Southeast Oregon"

Copied!
8
0
0

Loading.... (view fulltext now)

Full text

(1)

Infiltration, Runoff, and Sediment Yield in Response to Western Juniper Encroachment in Southeast Oregon

Steven L. Petersen 1 and Tamzen K. Stringham 2

Authors are

1

Assistant Professor, Department of Plant and Animal Sciences, Brigham Young University, Provo, UT 84604, USA; and

2

Associate Professor, Department of Rangeland Ecology and Management, Oregon State University, Corvallis, OR 97331, USA.

Abstract

Infiltration was measured in a western juniper (Juniperus occidentalis Hook.) watershed to characterize the hydrologic processes associated with landscape position. Infiltration rate, runoff, and sediment content were measured with the use of a small-plot rainfall simulator. Study sites were located in each of the four primary aspects (north, south, east, and west). Research sites were located in two ecological sites—South Slopes 12–16 PZ and North Slopes 12–16 PZ. Within aspect, plots were located in three juniper cover levels: high (. 22%), moderate (13%–16%), and low (,3%) juniper canopy cover. During rainfall simulation, water was applied at a 10.2-cm ? h

21

rate, levels comparable to an infrequent, short-duration, high-intensity precipitation event.

Runoff was measured at 5-min intervals for 60 min. Comparing canopy cover levels, steady-state infiltration rates on control plots (9.0 cm ? h

21

) was 68% greater than high juniper cover sites (2.87 cm ? h

21

) and 34% greater than moderate juniper cover sites (5.97 cm ? h

21

) on south-facing slopes. On north-facing slopes, no differences in infiltration rates were observed between juniper cover levels, demonstrating differential hydrologic responses associated with ecological site. Generally, all water applied to control plots infiltrated. Highest infiltration rates were positively associated with increased surface litter and shrub cover. In addition, depth of water within the soil profile was lowest in high juniper cover plots. This suggests that less water is available to sustain understory and intercanopy plant growth in areas with high juniper cover. Accelerated runoff and erosion in juniper dominated sites (high level) across east-, west-, and south- facing slopes can lead to extensive degradation to the hydrology of those sites. These data suggest that sustained hydrologic processes are achieved with reduced western juniper canopy cover.

Resumen

Se midio´ la infiltracio´n en una Cuenca hidrolo´gica de ‘‘western juniper’’ (Juniperus occidentalis Hook.) para caracterizar los procesos hidrolo´gicos asociados a la posicio´n del paisaje. La tasa de infiltracio´n, el escurrimiento y contenido de sedimento se midieron usando un simulador de lluvia de parcelas pequen˜as. Los sitios de estudio se localizaron entra cada uno de las cuatro exposiciones principales (norte, sur, este y oeste). Los sitios de investigacio´n esta´n ubicados en dos sitios ecolo´gicos, pendientes sur 12–16 PZ y pendientes norte 12–16 PZ. Dentro de la exposicio´n, las parcelas se localizaron en tres niveles de cobertura de ‘‘Juniper’’: alta (. 22%), moderada (13%–16%) y baja (,3%). Durante la simulacio´n de lluvia el agua se aplico´ a una tasa de 10.2 cm ? h

21

, niveles comparables a un evento infrecuente de corta duracio´n y alta intensidad. El escurrimiento se midio´ en intervalos de 5 minutos durante 60 minutos. Comparando los niveles de cobertura de copa de ‘‘Juniper’’ en la exposicio´n sur, las tasas de infiltracio´n estabilizadas de las parcelas control (9.0 cm ? h

21

) fueron 68% mayores que las de los sitios con cobertura alta (2.87 cm ? h

21

) y 34% superiores que las de los sitios con cobertura moderada (5.97 cm ? h

21

). En la exposicio´n norte no se observaron diferencias en las tasas de infiltracio´n de los diferentes niveles de cobertura de ‘‘Juniper’’, demostrando respuestas hidrolo´gicas diferenciadas asociadas con el sitio ecolo´gico. Generalmente, toda el agua aplicada en las parcelas control se infiltro´. Las mayores tasas de infiltracio´n estuvieron positivamente asociadas con un incremento del mantillo en la superficie y con la cobertura de arbustos. Adema´s, la menor profundidad del agua en el perfil del suelo ocurrio´ en las parcelas con cobertura alta de ‘‘Juniper’’. Esto sugiere que en a´reas con cobertura alta de ‘‘Juniper’’ hay menos agua disponible para mantener el crecimiento vegetal del estrato vegetal inferior y el que se encuentra entre los espacios de la cobertura. El escurrimiento acelerado y la erosio´n en sitios dominados por ‘‘Juniper’’ (nivel alto), a lo largo de las pendientes en las exposiciones este, oeste y sur, pueden conducir a una degradacio´n extensiva para la hidrologı´a de estos sitios. Esto datos sugieren que los procesos hidrolo´gicos sostenidos se logran con coberturas de copa de ‘‘Juniper’’ reducidas.

Key Words: erosion, intercanopy, Juniperus occidentalis, rainfall simulation, sediment, steady-state infiltration

INTRODUCTION

The hydrologic processes of a site are usually determined by plant community composition and structure, topographic position, and soil properties (Breedlow et al. 1988; Chapin et

al. 1997; Pellant et al. 2000). The balance between soil–plant interactions is altered in plant communities invaded by western juniper (Juniperus occidentalis Hook.), creating greater ob- served spatial and temporal variation in hydrologic character- istics (Miller et al. 2005). The degree of alteration is determined by ecological site characteristics and the stage of woodland development (Miller et al. 2000).

Vegetation, topography, and the soil complex are closely associated with infiltration, runoff, and erosion (Smith and Leopold 1941; Branson and Owen 1970; Tromble et al. 1974;

At the time of research, Petersen was a PhD graduate student at Oregon State University.

Correspondence: Steven L. Petersen, Dept of Plant and Animal Science, 493 WIDB, Brigham Young University, Provo, UT 84602, USA. Email: [email protected]

Manuscript received 17 July 2007; manuscript accepted 23 September 2007.

Rangeland Ecol Manage 61:74–81

|

January 2008

(2)

Blackburn 1975; Wilcox et al. 1988; Truman et al. 2001;

Wilcox et al. 2006). Vegetation influences hydrologic processes by affecting rainfall interception, infiltration, evaporation, and soil water storage (Spaeth 1995; Breshears et al. 1998; Pierson et al. 2007). Owens et al. (2006) found that Ashe juniper canopy cover intercepts approximately 40% of total pre- cipitation during a moderate precipitation event, but can increase to 96% with a decrease in rainfall intensity and duration, suggesting a significant reduction in potential soil water recharge within juniper-dominated communities. Hydro- logic processes also vary depending on slope and aspect. Fox et al. (1997) found that infiltration was lower with increasing slope gradients due to more rapid runoff velocities. Soil temperature, transpiration rates, and evaporation rates vary across the landscape in association with changes in topographic position (Spaeth 1995; Breshears et al. 1998; Pierson et al.

2002).

The ability of a site to capture, transport, and store water through a soil is controlled by the infiltration capacity of that site. In Western juniper watersheds, infiltration may be a strong indicator of site stability and provide a measure of the condition of a sites’ hydrologic processes. Pierson et al.

(2007) found that herbaceous cover and infiltration rates were higher in plots where juniper was removed. Buckhouse and Mattison (1980) observed increased erosion rates on sites where vegetation cover was reduced; however, the erodibility was dependent on soil characteristics. Therefore, plots located within two or more ecological sites will likely have different infiltration rates regardless of the level of juniper encroach- ment.

Generalizations are often made concerning watersheds, rangeland hydrology, and erosion. Plant communities and soil types occurring in rangelands are typically heterogeneous and patchy, evident from ecological site descriptions for rangeland ecosystems (Lentz and Simonson 1987; Natural Resource Conservation Service [NRCS] 2000). These generalizations are subsequently included in models developed to estimate and predict hydrologic response across multiple ecological sites (Pierson et al. 2002). A pitfall of single-site evaluations is that expected hydrologic response from one site may differ at other sites because of variability in soil properties. Because hydro- logic processes likely differ across a landscape, it is important to scale up and evaluate hydrology across multiple ecological sites.

The purpose of this research was to assess the effect of Western juniper encroachment and aspect on total and steady- state infiltration, comparing differences in infiltration, runoff, sediment content, and percolation at varying levels of juniper encroachment on two different ecological sites.

MATERIALS AND METHODS

Site Description and Study Design

This study was conducted in a small watershed (1 000 3 3 000 m) located at Steens Mountain in southeast Oregon (lat 42 u269280N, long 118u439570W). The elevation of the water- shed ranged from approximately 1 700 to 2 070 m. Average annual precipitation was approximately 320 mm (based from historic records obtained from Hart Mountain National

Antelope Refuge; Oregon Climate Service [OCS] 2004). The watershed study area was divided into two ecological sites, South Slopes 12–16 PZ (023XY3020R) and North Slopes 12–

16 PZ (023XY310OR), both occurring within the D-23 Major Land Resource Area of the United States (NRCS 2000). South Slopes 12–16 PZ, found on south- and east-facing slopes, historically consisted of Artemesia tridentata Nutt. var.

vaseyana (Rydb.) Beetle (5%–10% composition), Purshia tridentata Pursh (2%–10%), Pseudoregeneria spicata Pursh (30%–50%), Festuca idahoensis Elmer (2%–5%), Poa secunda J. Presl (2%–5%), Achnatherum thurberianum Piper (Bark- worth) (1%–2%), Balsamorhiza sagittata (Pursh) Nutt. (2%–

5%), Crepis acuminata Nutt. (1%–3%), and Lupinus spp. L.

(1%–3%). North Slopes 12–16 PZ, found on north and west- facing slopes, consisted of A. tridentata var. vaseyana (10%–

15%), P. tridentata (2%–10%), Symphoricarpos rotundifolius Gray (2%–5%), F. idahoensis (40%–50%), P. spicata (5%–

15%), Leymus cinereus (Scribn. & Merr.) A. Lo¨ve (5%–15%), P. secunda (2%–5%), A. thurberianum (1%–2%), Bromus carinatus Hook. & Arn. (1%–2%), Lupinus spp. (1%–2%), C.

acuminata (1%–2%), and Lithospermum ruderal Dougl. ex Lehm. (1%–2%). The soils were characterized as loamy- skeletal, mixed frigid lithic Argixerolls, belonging to the Pernty- Rock outcrop complex type and mixed, superactive frigid pachic Haploxerolls belonging to the Westbutte-Lambring rock outcrop complex type. Soils were gravelly to cobbly loam or silt loams from the surface to approximately 20–30-cm depths.

These soils contained between 20% and 70% rock (stones and cobbles) with the highest content found just above bedrock (NRCS 2000). Soil texture varied across the site from clays to sandy loams.

Soils on north-facing slopes were typically deepest (. 1 m), dark-colored, and with a well-developed O-horizon. Soil structure was well developed with extensive rooting throughout the soil profile. Soil erosion (sheet and rill erosion, seal formation, and a loss in upper-layer organic matter content) on west-, east-, and south-facing slopes was visually apparent with increasing juniper cover. Plots for collecting vegetation, soil water, and infiltration data were arranged in a randomized block experimental design. These plots were identified based on the level of Western juniper canopy cover and total shrub cover in the intercanopy area. Percent juniper cover representing moderate and high juniper cover levels varied depending on ecological site. According to Miller et al. (2000), 20%–30%

juniper canopy cover on an A. tridentata var. vaseyana/F.

idahoensis (i.e., north-facing slopes) site would retain an intact understory and intercanopy community, whereas similar juniper cover levels on an A. tridentata var. vaseyana/S.

thurberiana (south-facing slopes) site would exhibit a depleted understory and intercanopy community. Because data were collected from plots at two ecological sites, data were compared within but not between ecological sites. This research emphasizes differences among juniper canopy cover levels by aspect and not between different aspects.

Vegetation plots were randomly selected with the use of a 10- m digital elevation model (DEM) and georectified 0.25-m–

resolution color aerial photography. In ERDASH Geographic

Information System (ERDAS 1991), the DEM was used to divide

the study area into four primary aspects (North, South, East, and

West). Within each aspect, the aerial photograph was used to

(3)

delineate juniper canopy cover (within a 400-m

2

area) represent- ing high (. 22%), moderate (13%–16%), and low (,3%) juniper canopy cover (Table 1). Intercanopy vegetation plots were randomly selected from all potential sites for each aspect and juniper cover level. Within each 10 3 10 m plot, shrub cover was measured with the use of the line-point intercept method (Floyd and Anderson 1987). This was accomplished by re- cording the first surface feature contacted from a dropped 2-mm- diameter pin. Measurements were taken at 15-cm intervals along five 10-m-long transect lines randomly positioned within each plot. In addition to recording hits on individual shrub species, all plant life forms were recorded to the species level as well as bare ground, litter, and rock cover. North-facing sites had low juniper establishment across the watershed. Because high juniper cover levels did not occur on north-facing slopes, this category was removed from the study. Average slope for all plots was 24.9 6 0.7%, ranging from 13.1% to 37.9%. Five rainfall simulations (replications) were completed for each aspect and juniper cover level for a total of 55 simulation plots.

Rainfall Simulation

Rainfall simulation was conducted on 25%–35% slopes, a range approximate to the highest average slope within the watershed study area. A small-plot rainfall simulator, designed and developed at the United States Department of Agriculture–

Agricultural Research Service office in Boise, Idaho, was used to measure rainfall infiltration. The water spray produced by the rainfall simulator was designed to mimic rainfall droplets in a natural precipitation event (Spaeth 1995). Before data collection, the simulator was calibrated to ensure consistent flow rates. A constant flow of water was applied at a rate of 10.2 cm ? h

21

(4 inches ? h

21

). This rate was applied to produce a runoff response required to produce steady-state infiltration curves. This application rate was equivalent to a 100-yr event, primarily during the first 5–15 min of the simulation (OCS 2004). Rainfall simulation was conducted on north- and south-facing slopes during September 2001 and west- and east-facing slopes were conducted during September 2002. Precipitation was below average during both years.

Differences in precipitation patterns may have influenced early development of forbs, but because measurements were taken in the fall, forbs were a minor component of the total plant cover and had little influence on infiltration rates.

Water was sprayed onto the soil surface within a 0.5 3 0.5 m plot frame, designed to collect surface runoff and sediment.

Before water was applied, grass, forb, and shrub cover, litter, and rock (cobblestone, rock, and pebble) were measured within the entire frame with the use of an ocular estimation for each plot. Foliar cover was estimated, rather than basal cover, because the former provides a more informative indicator of infiltration (Wilcox et al. 1988). Plant density (per m

2

) was determined by counting all plants (by species) rooted within the plot and then multiplying by 4. Prior to each simulation, the tip of the nozzle was centered and leveled over the rainfall plot at exactly 1.93 m above the soil surface. Time was recorded at the beginning of each simulation and then at each 5-min interval for a total of 12 intervals (1 h). Time of runoff (water flowing off the soil surface and into the trough) was also recorded.

Infiltration rate was calculated for each time period. Addition- ally, total infiltration during the hour-long simulation, the amount of time elapsed before runoff occurred, and the change in infiltration rate in the first 15 min was similarly measured.

At the end of each 5-min interval, all runoff and sediment was suctioned from the trough and collected in a graduated cylinder. Total runoff (mL) was then recorded and any runoff was stored (up to 1 L) for sediment content analysis. Each 1-L water sample was weighed and dried in an oven at 60uC until all water had evaporated. Samples were then reweighed, providing a measurement of sediment content. Plant biomass (g ? m

2

) by life form and shrub species was measured by harvesting all aboveground photosynthetic tissue and placed in paper sacks. Samples were oven dried at 64 uC for 48 h and then weighed. Plant litter was collected from the soil surface (not including dead shrub limbs), dried, and weighed.

Antecedent soil water samples were collected adjacent to the plot and posttreatment samples were collected within the plot approximately 10 min after each simulation. Soil samples were collected from 2.5-, 5-, 10-, and 18-cm soil depths. Soils were weighed, dried at 105 uC for 24 h, and then reweighed to determine gravimetric soil water content (Jury et al. 1991).

Data Analysis

The differences in steady-state infiltration rates for each juniper cover level were compared between aspects while holding juniper cover constant. Steady-state infiltration rate (saturated hydraulic conductivity) was calculated for each simulation with the use of the Green and Ampt equation (Ogden and Saghafian 1997). A 2-way factorial analysis of variance with equal replication was calculated to determine statistical significance of steady-state infiltration rates among the three woodland cover levels for each aspect (Statistica 1997). Multiple comparisons were made with the use of the Fisher’s least significant difference (LSD) method with an a 5 0.05. The strength of association between infiltration rate and plant density, plant cover, and litter was estimated with the use of the coefficient of determination from a second-order polynomial regression function. A re- gression analysis producing second-order polynomials was used to assess the relationship between steady-state infiltration and litter biomass, shrub density, and shrub cover.

Sediment content was compared among all juniper cover levels for each aspect with the use of a 2-way analysis of variance. The lack of runoff occurring on two moderate-level north-facing and Table 1. Average shrub and juniper canopy cover by aspect, measured

on permanent plots for high juniper cover, moderate juniper cover, and control plots.

Control Moderate High

Shrub cover (%)

East 30.6 6 3.0 13.2 6 1.6 2.1 6 0.8

North 53. 6 6.4 28.4 6 5.5 –

South 35.8 6 5.7 18.4 6 4.6 3.0 6 1.3

West 41.1 6 2.1 12.7 6 3.7 2.4 6 0.6

Juniper cover (%)

East 0.3 6 0.3 13.0 6 3.6 31.6 6 4.3

North 0.0 6 0.0 13.3 6 2.3 –

South 0.8 6 0.5 14.3 6 2.4 27.0 6 2.9

West 1.2 6 1.1 15.8 6 3.1 22.7 6 3.5

(4)

one moderate-level south-facing site, and missing data from a south-facing high-juniper site, resulted in a data matrix with unequal replication. As a result, a Type-III regression was used to account for an unbalanced data matrix. Post hoc mean separation analysis was conducted with the use of Fisher’s LSD with an a 5 0.05. Soil water was compared between soil depths for both antecedent and postsimulation conditions and among all three juniper levels with the use of a 3-way factorial analysis of variance with equal replication. Mean separation was determined with the use of Fisher’s LSD with an a 5 0.05.

RESULTS

Infiltration

No significant interactions were found for steady-state in- filtration rates, total accumulated infiltration, time to runoff, and change in infiltration rates among juniper levels at each aspect. Steady-state infiltration rates were higher in control plots than both moderate and high juniper cover level plots at south-, east-, and west-facing sites (Fig. 1). Similarly, in- filtration on moderate juniper cover sites was greater than high juniper cover sites at south-, east-, and west-facing sites.

There was no difference in steady-state infiltration between moderate juniper cover and control plots on north-facing sites.

There was no difference in infiltration rates on control plots for each aspect. Similar results were observed for aspect in control and high juniper cover plots. However, on moderate juniper cover plots, there were higher infiltration rates on north-facing sites compared with the other three aspects. No interaction was detected among juniper cover level by aspect for steady-state infiltration. There was higher total infiltration for the 1-h rainfall in control sites than moderate cover sites for south-, east-, and west-facing plots. Moderate juniper cover plots also had higher total infiltration than was found at high juniper cover plots.

There was no difference in time elapsed to runoff between juniper cover level combinations for each aspect. Infiltration on

control plots remained high throughout the simulation period (Fig. 2). In many instances, all water applied infiltrated into the soil profile on the north-facing control and moderate juniper cover sites during the 1-h simulation period. Similar patterns were observed between south-, east-, and west-facing slopes, where infiltration rates were highest in control sites and then declined with moderate juniper cover. The greatest decline in infiltration occurred on sites with high juniper levels.

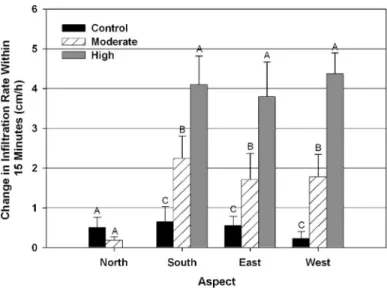
Infiltration rates were compared among juniper cover levels for the first 5-min sampling period and at the end of 15 min.

No differences in infiltration rates were observed among juniper cover levels on north-facing sites (P 5 0.587). On south-, east-, and west-facing slopes, the decrease in infiltration rate on high juniper cover sites was greater than moderate juniper cover and control plots. Similarly, moderate juniper cover plots had greater infiltration rates than control plots at all three aspects (Fig. 3).

Figure 1. Steady-state infiltration rates for high and moderate juniper cover sites and control sites by aspect. Post hoc tests of mean separation were conducted with the use of Fisher’s LSD with a 5 0.05.

Figure 2. Infiltration rate during rainfall simulation (1 h) at north- and south-facing aspects for high juniper cover, moderate juniper cover, and control levels.

Figure 3. Total change in infiltration rate from the end of the 5-min

simulation period to the end of the 15-min period. Different letters above

bars indicate statistical significance (a 5 0.05).

(5)

Runoff Sediment Content

Total sediment yield during the 1-h simulation was 3.4 times higher in intercanopy bare sites (1 007 g ? m

22

) than inter- canopy vegetation sites (298 g ? m

22

). Sediment content in runoff during the simulation was similar between aspects for each juniper cover level (Fig. 4). Runoff sediment content on moderate juniper cover sites was higher than control sites on south-facing slopes (P 5 0.04). Control plots on east-facing

sites had lower sediment yield (0.10%) than both high (0.31%;

P 5 0.03) and moderate juniper cover sites (0.29%; P 5 0.04);

however, there was no difference between high and moderate cover sites (P 5 0.81). On west-facing sites, there were no differences in sediment yield between control and moderate juniper cover plots (P 5 0.77); however, both control and moderate juniper cover plots had less sediment produced (0.06% and 0.08%) than high juniper cover plots (0.27%).

Depth of Infiltration

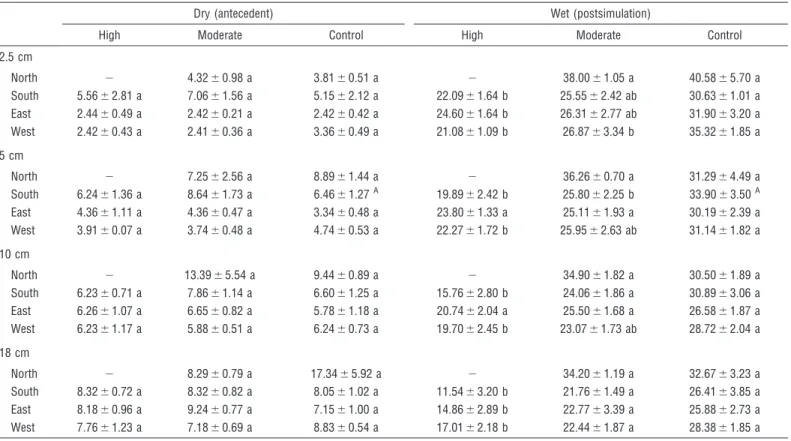
There was no interaction between juniper cover level and depth of infiltration by aspect. Prior to rainfall simulations, there was no difference in antecedent soil water among juniper cover levels for all soil depths (Table 2). Following simulation, soil water at 2.5-cm depth was greatest in control plots and least in high juniper phase sites for each aspect. Similarly, soil water was less at 5-cm depth in high juniper cover sites except on east-facing slopes where soil water was the same for all three levels. The lowest moisture was observed in high juniper cover sites on south-facing sites. At 10-cm depth, an interaction was observed that resulted from greater soil water in moderate juniper cover plots compared with control plots on south-facing slopes. Greater soil water occurred in control plots than moderate juniper cover plots for all aspects except north-facing slopes. Soil water at 10- cm depth was lowest in high juniper cover sites, in particular south-facing slopes (15.8 6 2.8%). Soil water was least in high juniper cover sites at 18 cm, in particular south-facing slopes (11.5 6 3.2%). Variability in soil water content observed in these data may be in part attributed to variability in soil texture.

Figure 4. Mean sediment content in water collected from 1-h rainfall simulation runoff. Post hoc tests of mean separation were conducted with the use of Fisher’s LSD (a 5 0.05).

Table 2. Soil moisture (%) 6 standard error in August–September prior to (antecedent) and after (postsimulation) rainfall simulation at four soil depths and three levels of juniper cover. Different letters after the number in each column indicate significant differences at different soil depths at a 5 0.05.

Dry (antecedent) Wet (postsimulation)

High Moderate Control High Moderate Control

2.5 cm

North 2 4.32 6 0.98 a 3.81 6 0.51 a 2 38.00 6 1.05 a 40.58 6 5.70 a

South 5.56 6 2.81 a 7.06 6 1.56 a 5.15 6 2.12 a 22.09 6 1.64 b 25.55 6 2.42 ab 30.63 6 1.01 a

East 2.44 6 0.49 a 2.42 6 0.21 a 2.42 6 0.42 a 24.60 6 1.64 b 26.31 6 2.77 ab 31.90 6 3.20 a

West 2.42 6 0.43 a 2.41 6 0.36 a 3.36 6 0.49 a 21.08 6 1.09 b 26.87 6 3.34 b 35.32 6 1.85 a

5 cm

North 2 7.25 6 2.56 a 8.89 6 1.44 a 2 36.26 6 0.70 a 31.29 6 4.49 a

South 6.24 6 1.36 a 8.64 6 1.73 a 6.46 6 1.27

A

19.89 6 2.42 b 25.80 6 2.25 b 33.90 6 3.50

A

East 4.36 6 1.11 a 4.36 6 0.47 a 3.34 6 0.48 a 23.80 6 1.33 a 25.11 6 1.93 a 30.19 6 2.39 a

West 3.91 6 0.07 a 3.74 6 0.48 a 4.74 6 0.53 a 22.27 6 1.72 b 25.95 6 2.63 ab 31.14 6 1.82 a

10 cm

North 2 13.39 6 5.54 a 9.44 6 0.89 a 2 34.90 6 1.82 a 30.50 6 1.89 a

South 6.23 6 0.71 a 7.86 6 1.14 a 6.60 6 1.25 a 15.76 6 2.80 b 24.06 6 1.86 a 30.89 6 3.06 a

East 6.26 6 1.07 a 6.65 6 0.82 a 5.78 6 1.18 a 20.74 6 2.04 a 25.50 6 1.68 a 26.58 6 1.87 a

West 6.23 6 1.17 a 5.88 6 0.51 a 6.24 6 0.73 a 19.70 6 2.45 b 23.07 6 1.73 ab 28.72 6 2.04 a

18 cm

North 2 8.29 6 0.79 a 17.34 6 5.92 a 2 34.20 6 1.19 a 32.67 6 3.23 a

South 8.32 6 0.72 a 8.32 6 0.82 a 8.05 6 1.02 a 11.54 6 3.20 b 21.76 6 1.49 a 26.41 6 3.85 a

East 8.18 6 0.96 a 9.24 6 0.77 a 7.15 6 1.00 a 14.86 6 2.89 b 22.77 6 3.39 a 25.88 6 2.73 a

West 7.76 6 1.23 a 7.18 6 0.69 a 8.83 6 0.54 a 17.01 6 2.18 b 22.44 6 1.87 a 28.38 6 1.85 a

(6)

Infiltration, Cover, and Biomass

The relationship between steady-state infiltration and total plant biomass, total plant cover, and litter was compared individually. A second-order polynomial regression showed a relationship between infiltration and total plant biomass (R

2

5 0.40; P , 0.001), shrub cover (R

2

5 0.41; P , 0.001), and shrub biomass (R

2

5 0.22; P , 0.003). A positive correla- tion was observed between infiltration and litter biomass (R

2

5 0.60; P , 0.001). In this data set, two extreme outliers were noted. If these two outliers were removed from the analysis, the correlation increased to R

2

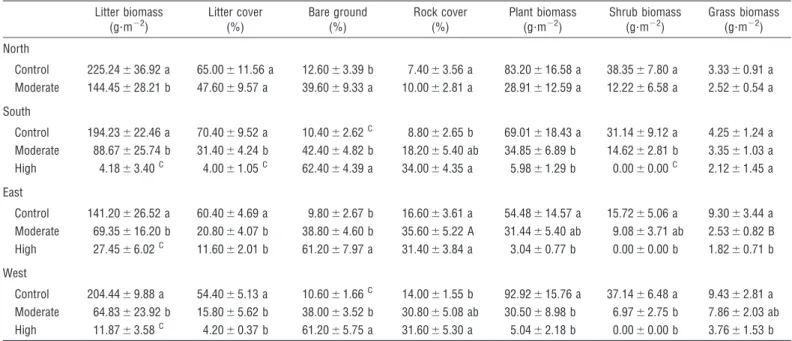
5 0.76. Results from the analysis of variance of these data indicated that herbaceous litter biomass was different among all three juniper cover levels (P , 0.001; Table 3). The correlation between infiltration rate and litter cover was also important (R

2

5 0.58; P , 0.001), although weaker than with litter biomass. The relationship between bare ground and infiltration was strongly negative (R

2

5 0.94; P , 0.0001; y 5 2 0.2145x + 12.0).

Steady-state infiltration was compared with average plot-level shrub density and shrub cover. The linear relationship for shrub density resulted in a significant regression with R

2

5 0.67 (P 5 0.002; second-order polynomial R

2

5 0.75). The linear relationship between infiltration and shrub cover was significant at R

2

5 0.79 (second-order polynomial R

2

5 0.84; Fig. 5). Total surface litter biomass that was collected from the soil surface was compared with steady-state infiltration. A significant reduction in infiltration rate was observed as surface litter biomass declined to less than 50–75 g ? m

22

for all aspects except north-facing slopes.

No differences were found comparing herbaceous canopy cover and infiltration rates across aspect and juniper canopy level.

DISCUSSION

Watershed infiltration varied widely within the watershed study area in relation to the level of western juniper

encroachment. Sites that had the highest infiltration rates were those located outside the influence of juniper. These sites had greater shrub, grass, and forb cover, and greater surface litter cover and biomass. Results from this study demonstrate that litter biomass, and to a lesser extent shrub cover, are highly associated with steady-state infiltration rates. Litter and plant cover function in reducing overland flow velocity, increasing surface roughness, enhancing soil infiltration through greater macropore density, and improving soil structure by contribut- ing organic matter (Shelby 1982). Wilcox et al. (1988) found that total plant cover was strongly correlated with infiltration in a study conducted on rangelands in the Guadalupe Mountains of New Mexico. They also found a strong correlation between infiltration and herbaceous cover and Table 3. Average 6 standard error values for surface attributes located within rainfall simulation plots. Plant biomass refers to the total biomass of current years’ plant production for all life forms. Different letters between juniper levels within aspect indicate significant difference at a 5 0.05.

Litter biomass (g?m

22

)

Litter cover (%)

Bare ground (%)

Rock cover (%)

Plant biomass (g?m

22

)

Shrub biomass (g?m

22

)

Grass biomass (g?m

22

) North

Control 225.24 6 36.92 a 65.00 6 11.56 a 12.60 6 3.39 b 7.40 6 3.56 a 83.20 6 16.58 a 38.35 6 7.80 a 3.33 6 0.91 a Moderate 144.45 6 28.21 b 47.60 6 9.57 a 39.60 6 9.33 a 10.00 6 2.81 a 28.91 6 12.59 a 12.22 6 6.58 a 2.52 6 0.54 a South

Control 194.23 6 22.46 a 70.40 6 9.52 a 10.40 6 2.62

C

8.80 6 2.65 b 69.01 6 18.43 a 31.14 6 9.12 a 4.25 6 1.24 a Moderate 88.67 6 25.74 b 31.40 6 4.24 b 42.40 6 4.82 b 18.20 6 5.40 ab 34.85 6 6.89 b 14.62 6 2.81 b 3.35 6 1.03 a High 4.18 6 3.40

C

4.00 6 1.05

C

62.40 6 4.39 a 34.00 6 4.35 a 5.98 6 1.29 b 0.00 6 0.00

C

2.12 6 1.45 a East

Control 141.20 6 26.52 a 60.40 6 4.69 a 9.80 6 2.67 b 16.60 6 3.61 a 54.48 6 14.57 a 15.72 6 5.06 a 9.30 6 3.44 a Moderate 69.35 6 16.20 b 20.80 6 4.07 b 38.80 6 4.60 b 35.60 6 5.22 A 31.44 6 5.40 ab 9.08 6 3.71 ab 2.53 6 0.82 B High 27.45 6 6.02

C

11.60 6 2.01 b 61.20 6 7.97 a 31.40 6 3.84 a 3.04 6 0.77 b 0.00 6 0.00 b 1.82 6 0.71 b West

Control 204.44 6 9.88 a 54.40 6 5.13 a 10.60 6 1.66

C

14.00 6 1.55 b 92.92 6 15.76 a 37.14 6 6.48 a 9.43 6 2.81 a Moderate 64.83 6 23.92 b 15.80 6 5.62 b 38.00 6 3.52 b 30.80 6 5.08 ab 30.50 6 8.98 b 6.97 6 2.75 b 7.86 6 2.03 ab High 11.87 6 3.58

C

4.20 6 0.37 b 61.20 6 5.75 a 31.60 6 5.30 a 5.04 6 2.18 b 0.00 6 0.00 b 3.76 6 1.53 b

Figure 5. Correlation between average shrub cover and average steady-

state infiltration measured from plots located within the watershed

study-site area.

(7)

biomass; however, this was dependent on plant abundance at the site. They concluded that a threshold of grass biomass reduction must be surpassed before it has a significant impact on infiltration. This may account for the low correlation between grass biomass and infiltration rate in this study.

Increased bare soil was strongly correlated with increased runoff, which is in agreement with comparable studies reported in the literature (Branson and Owen 1970; Reid et al. 1999).

Infiltration responded less to juniper encroachment on north- facing sites. Soils on north-facing slopes were deep, well structured, and high in organics. According to Brady (1990), organic matter enhances soil structure development (aggrega- tion), increases infiltration capacity, improves water-holding capacity, and increases nutrient availability for plant growth and survival. In high juniper intercanopy sites, runoff is generated from small precipitation events, whereas greater rainfall is required to generate runoff in vegetated intercanopy sites (Reid et al. 1999). Although north- and south-facing sites had similar infiltration rates in control plots, rates were greater on north-facing than south-facing sites as juniper cover levels increased. This implies that south-facing sites have lower resistance to impaired infiltration rates with increasing juniper cover than north-facing slopes.

Reduced infiltration in Western juniper intercanopy sites can result in the degradation of the primary processes (in particular hydrology) that sustain ecosystem maintenance. Initially, juniper crowds out other plants within the community, gradually acquiring the bulk of available resources during tree growth. As a result, nutrient cycling, energy capture, and infiltration are altered, creating islands of limited resources where the trees are found. Intercanopy areas become exposed until most vegetation has been reduced. These areas will typically sustain indefinitely high runoff and erosion rates unless competing trees are removed (i.e., fire, management).

Additionally, unvegetated and exposed intercanopy areas experience higher soil temperature levels and subsequent elevated evaporation rates (Breshears et al. 1998), reduced organic matter concentrations (Doescher et al. 1987) and decreased nutrient concentrations (Bates et al. 2002).

In this study, accelerated runoff and erosion in juniper- dominated sites (high level) across east-, west-, and south- facing slopes have led to extensive degradation to the hydrology of those sites. This is likely facilitated by the decline of upper soil horizons and soil structure and stability. Plant communities such as these may transition across abiotic thresholds where hydrologic processes have been degraded beyond self-repair (Stringham et al. 2003; Petersen 2004;

Miller et al. 2005). In contrast, north-facing sites, especially those that lack juniper encroachment, exhibit higher resistance to runoff and erosion by sustaining high plant production and vegetation cover, and deeper and more structured soils that enhance infiltration and water storage capacity (Miller et al.

2000).

MANAGEMENT IMPLICATIONS

Measurements of steady-state and total infiltration rates, water sediment content, and rainfall percolation potential provide managers with the understanding required to characterize

hydrologic response associated with juniper encroachment.

This type of information can aid land managers in assessing the potential impacts of juniper encroachment to hydrologic processes. This work has shown that the impact of juniper expansion on watershed resources is dependent on topographic position, level of juniper encroachment, and plant community structure and composition.

It is important to recognize that variability in infiltration rates relative to juniper encroachment across a watershed may result from differences in the ecological site conditions from one location to the next. Ecological site information can be used to identify and integrate sites for juniper control and ecological restoration by providing a more predictable response of hydrologic recovery compared to treatments applied across a wide range of soils, microclimates, and plant communities.

This also makes it possible to focus efforts on those areas where management will be most effective (considering limited budgets and resources). For example, risk assessments can be developed for individual ecological sites to provide specific resource management applications at different levels of juniper en- croachment. In some cases, degradation of ecological processes may exceed recovery potential within the time frame appro- priate for management. In these cases management applications may prove ineffective in spite of relatively high inputs of time, money, and resources. For sites that have been treated, follow- up inventory and monitoring of posttreatment plant commu- nity response can indicate the ability of a site to recover ecological processes (self-repair), in particular infiltration rates.

The unprecedented expansion of juniper since the late 1800s has led to significant impacts on hydrology, soil resources, plant community structure, nutrient cycling, and wildlife habitat (Miller et al. 2005). Juniper control is effective in capturing and storing water, retaining soil nutrient cycling, and restoring shrub-steppe communities (Wilcox 1994; Bates et al.

2000; Miller et al. 2000; Bates et al. 2002). Results from this research indicate that Western juniper establishment over time can impair hydrologic function and increase soil erosion.

Extensive juniper control across heterogeneous landscapes can be an effective method for maintaining hydrologic processes and sustaining plant community structure.

ACKNOWLEDGMENTS

We would like to thank Ken Spaeth for providing technical support of the rainfall simulation procedure. We appreciate the Roaring Springs Ranch, located near French Glen, Oregon, for providing a study site and accommodations during the data collection period. We thank the many field technicians who assisted in data collection and Richard Miller, Mack Barrington, and Doug Johnson for providing a review of the research in this document.

LITERATURE CITED

B

ATES

, J., R. F. M

ILLER

,

AND

T. S

VEJCAR

. 2000. Understory patterns in cut western juniper woodlands. Great Basin Naturalist 58:363–374.

B

ATES

, J. D., T. J. S

VEJCAR

,

AND

R. F. M

ILLER

. 2002. Effects of juniper cutting on nitrogen mineralization. Journal of Arid Environments 51:221–234.

B

LACKBURN

, W. H. 1975. Factors influencing infiltration and sediment production of

semi-arid rangelands in Nevada. Water Resources Research 11:929–937.

(8)

B

RADY

, N. C. 1990. The nature and properties of soils. 10th ed. New York, NY, USA:

Macmillan. p. 279–313.

B

RANSON

, F. A.,

AND

J. B. O

WEN

. 1970. Plant cover, runoff and sediment yield relationships on Mancos Shale in western Colorado. Water Resources Research 6:783–790.

B

REEDLOW

, P. A., P. V. V

ORIS

,

AND

L. E. R

OGERS

. 1998. Theoretical perspective on ecosystem disturbance and recovery. In: W. H. Rickard, L. E. Rogers, B. E. Vaugham, and S. F. Liebetrau [

EDS

.]. Shrub-steppe: balance and change in a semi-arid terrestrial ecosystem. New York, NY, USA: Elsevier. p. 258–268.

B

RESHEARS

, D. D., J. W. N

YHAN

, C. E. H

EIL

,

AND

B. P. W

ILCOX

. 1998. Effects of woody plants on microclimate in a semiarid woodland: soil temperature and evaporation in canopy and intercanopy patches. International Journal of Plant Sciences 159:1010–1017.

B

UCKHOUSE

, J. C.,

AND

J. L. M

ATTISON

. 1980. Potential soil erosion of selected habitat types in the high desert region of central Oregon. Journal of Range Management 33:282–286.

C

HAPIN

, F. S., B. H. W

ALKER

, R. J. H

OBBS

, D. U. H

OOPER

, J. H. L

AWTON

, O. E. S

ALA

,

AND

D. T

ILMAN

. 1997. Biotic control over the functioning of ecosystems. Science 277:500–504.

D

OESCHER

, P. S., L. E. E

DDLEMAN

,

AND

M. R. V

AITKUS

. 1987. Evaluation of soil nutrients, pH, and organize matter in rangelands dominated by Western juniper. Northwest Science 61:97–102.

ERDAS. 1991. ERDAS Imagine 8.5 software. Urbana-Champaign, IL, USA: ERDAS, Inc., National Center for Supercomputing Applications, University of Illinois.

F

LOYD

, D. A.,

AND

J. E. A

NDERSON

. 1987. A comparison of three methods for estimating plant cover. Journal of Ecology 75:221–228.

F

OX

, D. M., R. B. B

RYAN

,

AND

A. G. P

RICE

. 1997. The influence of slope angle on final infiltration rate for interrill conditions. Geoderma 80:181–194.

J

URY

, W. A., W. R. G

ARDNER

,

AND

W. H. G

ARDNER

. 1991. Soil physics, 5th ed. New York, NY, USA: John Wiley & Sons. 45 p.

L

ENTZ

, R. D.,

AND

G. H. S

IMONSON

. 1987. Correspondence of soil properties and classification units with sagebrush communities in southeastern Oregon: II.

Comparisons within a multi-taxa-vegetation unit. Soil Science Society of America Journal 51:1271–1276.

M

ILLER

, R. F., J. D. B

ATES

, T. J. S

VEJCAR

, F. B. P

IERSON

,

AND

L. E. E

DDELMAN

. 2005.

Biology, ecology, and management of western juniper. Corvallis, OR, USA:

Agricultural Experiment Station, Oregon State University, Technical Bulletin 152. 77 p.

M

ILLER

, R. F., T. J. S

VEJCAR

,

AND

J. A. R

OSE

. 2000. Impacts of Western juniper on plant community composition and structure. Journal of Range Management 53:574–585.

N

ATURAL

R

ESOURCE

C

ONSERVATION

S

ERVICE

(NRCS). 2000. Soil survey and ecological site description provided for the watershed study area. Burns, OR, USA:

NRCS.

O

GDEN

, F. L.,

AND

B. S

AGHAFIAN

. 1997. Green and Ampt infiltration with redistribution.

Journal of Irrigation and Drain Engineering 123:386–393.

O

REGON

C

LIMATE

S

ERVICE

(OCS). 2004. Oregon Climate Service data. Corvallis, OR:

Oregon State Universtiy. Available at: http://www.ocs.orst.edu. Accessed June 2004.

O

WENS

, M. K., R. K. L

YONS

,

AND

C. L. A

LEJANDRO

. 2006. Rainfall partitioning within semiarid juniper communities: effects of event size and canopy cover.

Hydrologic Processes 20:3179–3189.

P

ELLANT

, M., P. S

HAVER

, D. A. P

YKE

,

AND

J. E. H

ERRICK

. 2000. Interpreting indicators of rangeland health, version 3. Denver, CO, USA: US Department of the Interior, Bureau of Land Management, National Science and Technology Center, Technical Reference 1734-6. 119 p.

P

ETERSEN

, S. L. 2004. A landscape-scale assessment of plant communities, hydrologic processes, and state-and-transition theory in a western juniper dominated watershed [PhD dissertation]. Corvallis, OR, USA: Oregon State University. 268 p.

P

IERSON

, F. B., J. D. B

ATES

, T. J. S

VEJCAR

,

AND

S. P. H

ARDEGREE

. 2007. Runoff and erosion after cutting western juniper. Rangeland Ecology and Management 60:285–292.

P

IERSON

, F. B., K. E. S

PAETH

, M. A. W

ELTZ

,

AND

D. H. C

ARLSON

. 2002. Hydrologic response of diverse western rangelands. Journal of Range Management 55:558–570.

R

EID

, K. D., B. P. W

ILCOX

, D. D. B

RESHEARS

,

AND

L. M

AC

D

ONALD

. 1999. Runoff and erosion in a pinon–juniper woodland: influence of vegetation patches. Soil Science Society of America Journal 63:1869–1879.

S

HELBY

, M. J. 1982. Hillslope materials and processes. Oxford, United Kingdom:

Oxford University Press. 263 p.

S

MITH

, H. L.,

AND

L. B. L

EOPOLD

. 1941. Infiltration studies in the Pecos River watershed, New Mexico and Texas. Soil Science 53:195–204.

S

PAETH

, K. 1995. Small plot rainfall simulation: background and procedures.

Washington, DC, USA: US Department of Agriculture-Natural Resources Conservation Service, Technical Note 230-15-12. 31 p.

S

TATISTICA

. 1997. Statistica for Windows. Tulsa, OK, USA: StatSoft, Inc. 958 p.

S

TRINGHAM

, T. K., W. C. K

RUEGER

,

AND

P. L. S

HAVER

. 2003. State-and-transition modeling: an ecological process approach. Journal of Range Management 56:106–113.

T

ROMBLE

, J. M., K. G. R

ENARD

,

AND

A. P. T

HATCHER

. 1974. Infiltration for 3 rangeland soil-vegetation complexes. Journal of Range Management 27:318–321.

T

RUMAN

, C. C., R. D. W

AUCHOPE

, H. R. S

UMNER

, J. G. D

AVIS

, G. J. G

ASCHO

, J. E. H

OOK

, L. D. C

HANDLER

,

AND

A. W. J

OHNSON

. 2001. Slope length effects on runoff and sediment delivery. Journal of Soil and Water Conservation 56:249–256.

W

ILCOX

, B. P. 1994. Runoff and erosion in intercanopy zones of pinon-juniper woodlands. Journal of Range Management 47:285–295.

W

ILCOX

, B. P., S. L. D

OWHOWER

, W. R. T

EAGUE

,

AND

T. T. T

HUROW

. 2006. Long-term water balance in a semi-arid shrubland. Journal of Rangeland Ecology and Management 59:600–606.

W

ILCOX

, B. P., M. K. W

OOD

,

AND

J. M. T

ROMBLE

. 1988. Factors influencing infiltrability

of semiarid mountain slopes. Journal of Range Management 41:197–206.

Figure

Figure 2. Infiltration rate during rainfall simulation (1 h) at north- and south-facing aspects for high juniper cover, moderate juniper cover, and control levels.
Table 2. Soil moisture (%) 6 standard error in August–September prior to (antecedent) and after (postsimulation) rainfall simulation at four soil depths and three levels of juniper cover
Figure 5. Correlation between average shrub cover and average steady- steady-state infiltration measured from plots located within the watershed study-site area.

References

Related documents