Analysis of a Recent Biofilter Model for
Toluene Biodegradation
Muhammad Qasim, Zarook Shareefdeen*
Department of Chemical Engineering, American University of Sharjah, Sharjah, UAE Email: *[email protected]
Received September 29, 2012; revised October 30, 2012; accepted November 9,2012
ABSTRACT
This paper investigates and provides a critical analysis of the toluene biofilter model developed by Li and De Visscher. The model simulation results have been reproduced and compared with several sets of experimental data from literature. Three different model variations are considered: model with no substrate inhibition, with substrate inhibition, and with air flow rate modification. A sensitivity analysis has been performed on model to study the effect of important parame-ters on the removal efficiency. Model limitations and improvements have been highlighted.
Keywords: Air Pollution; Biofilter; Modeling; Toluene; Volatile Organic Compound
1. Introduction
The upsurge of strict environmental regulations to main- tain good air, soil and water quality requires the use of proper pollution control and pollution prevention equip- ment. Traditional pollution control technologies such as incineration, carbon adsorption and wet-scrubbing may be used to control pollution. However, these conven- tional techniques are becoming more expensive due to more stringent environmental regulations [1]. In the field of pollution control, biological treatment such as biofil- tration is continuing to gain attention as an alternative to the conventional techniques.
Biofiltration is a pollution control technique that uses living microorganisms to capture and degrade pollutants from air. It is a process that combines basic mechanisms of adsorption, biodegradation and desorption of gas phase pollutants [2]. A biofilter is simply a packed bed that utilizes a packing material with microorganisms such as bacteria immobilized as biofilm on the surface and the pore structures of the packing material. The packing ma- terial may be particles such as peat, compost, peat/perlite mixture or organic or inorganic commercial media mate- rials. The flow of contaminated air through the biofilter results in the degradation of the pollutants by the immo- bilized microorganisms. Biofilter performance is affected by a number of factors such as the composition and rela- tive humidity of the waste stream, airflow velocity, tem- perature and pH of the biofilter bed, the pore size distri- bution, and other structural characteristics [1]. The sur- face of the porous material in the biofilter is covered with
biofilms which are made of microorganisms. Treatment begins with the transfer of the contaminants from the air stream to the biofilm phase. Then, the dissolved con- taminant is moved by diffusion and by advection in the air. Biotransformation finally converts the contaminant to biomass, metabolic by-products, carbon dioxide and wa- ter.
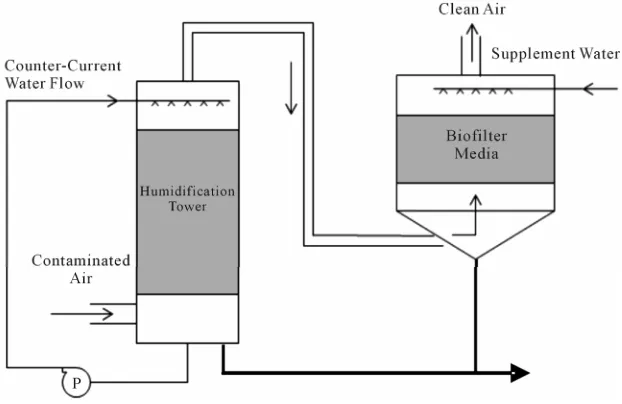
Several types of biofilters have been developed, the most typical of which include bioscrubbers, trickling bed biofilter and packed bed biofilter [3]. In all these tech- nologies, pollutants in the gas stream are transferred to the biofilm and are degraded by the microorganisms. The bioscubber consists of a scrubber and a bioreactor. In the scrubber, water is sprayed counter-current to the polluted gas flow resulting in absorption of the pollutant into the water. This water is then directed to a bioreactor con- taining activated sludge where microorganisms degrade the pollutants. The trickling bed biofilter, on the other hand, relies on the inert packing media to support bacte- rial growth. The packed bed biofilter does not use a large continuous flow of water. The media used in the packed bed biofilter acts as a water reservoir as well as a support structure for the bacteria.
Figure 1 shows a simplified schematic of a biofilter [3].
2. Review on Biofilter Models
Figure 1. Simplified biofilter schematic.
perimentation, and to improve the biofilter design, per- formance and scale-up [5]. Most of these models are based on several assumptions and may be simple or complex models. Over the years, researchers have de- veloped more and more complex biofilter models that accurately describe the biofilter performance and provide a more rational approach to biofilter design. While there has been significant success among investigators in de- scribing and understanding laboratory results of biofilters, no single model has become of a standard that is gener- ally accepted [5]. Different models have been developed that use different approaches to describe the pollutant degradation, biofilm growth and biofilter performance. Some of the biofilter models are very simple and con- sider no growth or mass-transfer limitations [6].
Ottengraf and van der Oever [7] developed the first steady-state biofilter model for the biofiltration of single volatile organic compounds (VOC) in 1980s. In this early model, both diffusion and biodegradation of pollutants in the biofilm were considered. In particular, Ottengraf and van der Oever considered three cases in their model: first-order kinetics, zero-order kinetics with reaction rate limiting, and zero-order kinetics with diffusion rate lim- iting. The basic assumptions in the model included smaller biofilm thickness compared to the diameter of support particles and that the gas phase is in plug flow. Ottengraf and van der Oever model is the most widely used biofilter model since it is easy to implement.
Later Shareefdeen et al. [8] extended the work of Ot- tengraf and proposed a biofilter model to describe the steady-state performance of biofilters. This model in-cludes both oxygen and substrate inhibition effects and oxygen is not assumed to be limiting as in the case of the model by Ottengraf and van der Oever [7]. Later, Sha- reefdeen and Baltzis [9] modified the model by Shareef-
deen et al. [8] and proposed the partial coverage of the support particles by biofilms, leaving the bare surfaces of the particles in direct contact with the airstream. Fur- thermore, Shareefdeen and Baltzis proposed that the un- covered surfaces can adsorb the substrate, and that the adsorption follows the Freundlich isotherm. These two models have a wide range of applicability but require input data that are not easily available.
Similar to the model of Shareefdeen et al. [8], De- shusses et al. [10,11] developed a dynamic diffusion- reaction model to describe the steady-state as well as transient behavior of biofilters. This model considers a first order exchange rate between biomass layers and also includes the substrate inhibition effects.
Several biofilter models have been developed in recent years. Almost all of these models have been developed based on these earlier biofilter models. The biofilter model by Deshusses et al. was modified in 2006 by Park and Jung [12] by using Luong kinetics for substrate inhi- bition instead of Michaelis-Menten kinetics. This model is used to study biofiltration of toluene under high load conditions.
Yang et al. [13] developed a new biofilter model for the biofiltration of toluene in a rotating drum biofilter. This model takes into account a variable biofilm thick- ness. According to this model, the biofilm thickness in- creases by microbial growth. As a result, this model be- comes rather complicated.
force to approximate the pollutant or contaminant inter- phase transport. It also assumes pollutant adsorption and biodegradation in the solid support using first order ki- netics with no oxygen limitation.
Liao et al. [14] developed a mathematical model for gas-liquid two phase flow and biodegradation in a trick- ling biofilter subjected to low concentration of VOC. The model simplifies the packed biofilter as a series of capil- lary tubes covered by the biofilm. The model assumes that the biofilm is formed on the exterior surface of the packed material and thus no reaction occurs in the pores of the packed material. The absorption of the VOC pol- lutant at the gas-liquid interface is evaluated using Henry’s law. In short, the model incorporates the effect of pollutant adsorption at gas-liquid interface, the mass transfer resistance in the liquid zone and the biofilm zone, the biochemical reaction in the biofilm, and the limitation of oxygen for the microbial growth.
Chen et al. [15] described a model for removal of ni-tric oxide in a rotating drum biofilter. The model is based on mass balance of the pollutant in the gas, liquid, and biofilm phases. Based on the mass component profile of NO at the gas-liquid interface combined with Monod kinetic equation, the model predicts the mass trans- fer-reaction process of NO in the rotating bed biofilter.
The mathematical model developed by Spigno et al. [16] for phenol degradation in biofilters assumes no oxy- gen limitation, no reaction inside the pores of the solid material, fast gas-solid transfer compared to diffusion and reaction in the biofilm, uniform biofilm properties, and Monod kinetics to describe the biofilm growth.
Biofiltration of ammonia has been recently studied by Baquerizo et al. [17]. The mathematical model is based on discretized mass balances and nitrification kinetics that include inhibitory effects caused by free nitrous acid and free ammonia in the biofilter. The model includes most of the known biofiltration phenomenon and ac- counts for advection, absorption, adsorption, diffusion and biodegradation. In addition, all biological inhibitions occurring in the nitrification process and oxygen limita- tion in the kinetic model have been considered. In gen- eral, the model is able to predict ammonia shock-load- ings and the biofilter behavior under inhibitory condi- tions.
Lu et al. [18] described the biofiltration of isopropyl
alcohol and acetone mixtures assuming pseudo-steady- state operating conditions. The model neglects the con- vective transport within the biofilm. Chimel et al. [19] developed a concise model for VOC removal in periodic operation of biofilters. Under periodic operation, the biofilm is assumed to be less developed than under con- tinuous regime, due to temporal nutrient shortages. A linear driving force is used to approximate the pollutant interphase transport. The model also allows for the pol-
lutant adsorption and biodegradation in the support phase using the first-order kinetics with no oxygen limitation.
Toluene is one of the most widely released air pollut- ants. It is used extensively in fuels, solvents and as raw material for production of other chemicals [20]. Studies in humans and animals have demonstrated that toluene is readily absorbed via the lungs and the gastrointestinal tract. In humans, exposure to toluene causes central nervous system depression and may also act as a narcotic in case of large dosage. Chronic occupational exposure and incidences of toluene abuse have resulted in heap- tomegaly and liver function changes [21]. Thus, effective removal of toluene from contaminated gas and liquid streams becomes important.
The objective of this paper is to analyze and investi- gate the validity of the model of Li and De Visscher [22] for biofiltration of toluene contaminated air. This model is based on the model by De Visscher and Van Cleemput [23] for methane biodegradation in landfill cover soils. Li and De Visscher [22] used the model by De Visccher and Van Cleepmput [23] to study toluene biofiltration, and modified the model equation to include substrate inhibit- tion using Haldane kinetics and influence of gas flow rate on toluene degrading activity.
3. Toluene Biofilter Model of Li and De
Visscher [22]
In this section the biofilter model of Li and De Visscher [22] is presented so that the readers can follow the analy- sis and discussion presented in the subsequent sections.
In the toluene biofilter model by Li and De Visscher, the biofilter is considered as a plug flow reactor. The height of the biofilter is divided into a number of subsec- tions and the mass balance in each of these subsections is given as follows:
1
j j j
Q C Q C r A z (1)
where Q is the air flow rate (m3/h), A is cross-sectional area of the biofilter (m2), Cj and
1
j
C are concentrations (g/m3) of the gas-phase pollutant (toluene) in the subsec- tions j and j + 1 respectively, ∆z is the subsection height (m), and rj is the volumetric biodegradation rate (g/m3 biofilter/h) in the subsection j of the biofilter.
Equation (1) can be written in the following differen- tial form with the biofilter height z as the independent variable:
d d
C Ar
z Q (2) The expression for the volumetric biodegradation rate
[23] developed the following expression for microbial growth for methane biofiltration:
max max,max max 1 m V S V a K S
(3)
where Vmax is the maximum degradation rate (g pollut-ant/m3 biofilter/h), V
max,max is the maximum attainable value of Vmax (g pollutant/m3 biofilter/h), S is the sub-strate concentration in the liquid phase (g/m3), Km is the Michaelis-Menten constant (g/m3), a is the decay rate of the microbes (h−1), µ is the specific growth rate (h−1), and
µmax is the actual maximum specific growth rate (h−1). The change of Vmax with time is given by the following equation: max max d d V V
t (4)
De Visscher and Van Cleemput [23] proposed that
Vmax attains a maximum value Vmax,max during the course of biofiltration. Most biofilter models assume a uniform biofilm structure and a constant Vmax throughout the biofiltration process. However, in reality, the thickness of bio-layer changes with substrate concentration and thus changes with the position in the biofilter [25]. The biofilm is expected to grow the thickest where the sub- strate concentration is the highest. Therefore, Vmax is not constant along the biofilter height.
3.1. Biofilter Model 1 (without Substrate Inhibition)
If substrate inhibition is not considered, the volumetric biodegradation rate rj is given by Michaelis-Menten ki- netics: max, j j j m j S r V K S
(5)
where Sj is the liquid-phase concentration (g/m3) of the pollutant and is related to Cj by Henry’s law as follows:
j j cc C S H
(6)
where Hcc is the dimensionless Henry’s constant for the pollutant. In each subsection, the microbial growth rate is given by De Visscher and Van Cleemput [23] model:
max, max,max max 1 j j j m j V S V a K S
(7)
At steady state, there is no net microbial activity (μj =
0) and Equation (7) can be written as follows:
max, max,max
max
1 1 m
j j cc K a V V C H
(8)
Equation (8) indicates that the Vmax is not constant but changes with the pollutant concentration at different biofilter height positions. Equation (2) combined with Equation (5) and Equation (8) can be solved numerically to study the pollutant concentration along the biofilter height.
3.2. Biofilter Model 2 (with Substrate Inhibition)
In case of substrate inhibition, Haldane kinetics [26] gives the following expression for the microbial growth rate: max, max,max max 2 1 j j j j m j I V S V a S K S K (9)
where KI is the inhibition constant (g/m3). Similarly, the volumetric biodegradation rate assumes the following form: max, 2 j j j j m j I S r V S K S K (10)
Again, under steady-state, μj becomes equal to zero
and Equation (9) becomes as follows:
max, max,max
max
1 1 m j
j
j cc I
cc
C K a
V V
C H K H (11)
In case of substrate inhibition, Equation (2) combined with Equations (10) and (11) can be solved numerically to study the pollutant concentration along the biofilter height.
3.3. Biofilter Model 3 (with Flow Rate Modification)
The performance of a biofilter is significantly affected by the flow rate of air. At high air flow rates, the biofilm layer becomes thinner and more uniform [27], and mass transfer and biodegradation are favored [22]. For biofil- ters operating under varying air flow rates with substrate inhibition (model 2), an empirical equation is used to describe the effect of air flow rate Q on the value of
Vmax,max [22]:
max,max max,max p
where ma is the flow-rate-modified maximum value of Vmax,max. The value of p is between 0 and 1 [22]. To include the effect of varying air flow rate, Equation (12) replaces Vmax,max in Equation (11) of model 2. The equations can then be solved to study the concentration of pollutant along the biofilter height.
x,max
V
4. Results and Discussion
4.1. Biofilter Model 1 (without Substrate Inhibition)
The non-linear coupled differential equations made up of Equations (2), (5) and (8), are solved using the ODE command in MATLAB to describe the variation of gas- phase toluene concentration along the biofilter height for the case where substrate inhibition is neglected.
Model 1. Verification Using the Data of Zamir et al.
[28]
Li and De Visscher [22] validated their model with the experimental results of Aizpuru et al. [29]. These results are also reproduced and are in good agreement as re- ported by Li and De Visscher [22]. The model of Li and De Visscher [22] was also solved and verified using the data of Zamir et al. [28]. Fungi were used as the toluene- degrading microorganisms. The biofilter had an inner diameter of 9.9 cm, a total height of 75 cm and an effect- tive volume of 4 L (empty basis) and consisted of three stages. A mixture of powdered compost supplied acted as packing material. The parameters required for model 1 solution are summarized in Table 1.
Since fungi were used for biodegradation, substrate inhibition can be neglected and model 1 can be used to predict the gas-phase toluene concentration along the biofilter height. Figure 2 shows a good agreement be- tween the model simulation results and the experimental
Biofilter height (m)
0.0 0.1 0.2 0.3 0.4 0.5 0.6
T
ol
uen
e
co
nc
en
tr
at
io
n (
g /
m
3)
0.00 0.01 0.02 0.03 0.04 0.05 0.06
Model 1 simulation Experimental data
Figure 2. Model 1 (no substrate inhibition) prediction of toluene gas-phase concentrations along the biofilter height. Toluene-contaminated air flow rate is 0.06 m3/h, inlet
tolu-ene gas-phase concentration is 0.0526 g/m3, experimental
data adopted from Zamir et al. [28].
Table 1. Model 1 parameters (no substrate inhibition) [28].
Parameter Value Unit Source
max
µ 0.28 h−1 [30,31]
Km 3.495 g/m3 [22]
a 0.0017 h−1 [32]
Vmax,max 50 g pollutant/m3 biofilter/h [32]
Hcc 0.313 - [33]
results adopted from Zamir et al. [28].
Therefore, in cases where substrate inhibition can be neglected, such as use of fungi for biodegradation or low toluene loading, model 1 developed by Li and De Viss- cher [22] showed excellent agreement with the two sets different experimental data as described by Li and De Visscher [22] and also Figure 2.
4.2. Biofilter Model 2 (with Substrate Inhibition)
When the substrate loading is very high or the microor- ganisms used for biodegradation are not fungi, substrate inhibition needs to be taken into account. This corre- sponds to model 2 developed earlier. In this case, the Equation (2) combined with Equations (10) and (11) can be solved to study the variation of gas-phase toluene concentration along the biofilter height.
Model 2. Verification using the Data of Park and
Jung [12]
The model 2 is solved, reproduced and compared with experimental results of Park and Jung [12]. Table 2
shows the parameters which were used to solve the biofilter model as per Park and Jung [12].
The experiments conducted by Park and Jung [12] for toluene biofiltration were carried out in three biofilters in series, each packed with spherical ceramic packing. The total packing height was 0.54 m. Pseudomonas pudita F1 stains were used as toluene-degrading microorganisms. A volumetric loading rate of 35.6 m3 air/m3 biofilter/h was used. Figure 3 shows the solution of model 2 with sub- strate inhibition and comparison with the experimental results. Reproduced model solutions and experimental data are in good agreement.
To verify the importance of inhibition effects, the model 1 (substrate with no inhibition model) is solved and compared with the same set of experimental data of Park and Jung [12]. Figure 4 shows the simulation re- sults using model 1 and parameters in Table 2 in case if the substrate inhibition were neglected. Figure 4 clearly indicates that neglecting the substrate inhibition gives poor agreement.
Table 2. Model 2 parameters (including substrate inhibition) [12].
Parameter Value Unit Source
max
µ 0.58 h−1 [34-38]
Km 5.34 g/m3 [22]
a 0.0017 h−1 [32]
Vmax,max 123.1 g pollutant/m3 biofilter/h [22]
KI 2.66 g/m3 [22]
Hcc 0.276 - [33]
Biofilter height (m)
0.0 0.1 0.2 0.3 0.4 0.5 0.6
G
as ph
as
e t
ol
ue
ne c
on
cen
tr
at
io
n (
g /
m
3)
0.5 1.0 1.5 2.0 2.5 3.0 3.5 4.0
Experimental data Experimental data Model 2 simulation curve 1 Model 2 simulation curve 2
Figure 3. Model 2 (with substrate inhibition) prediction of toluene gas-phase concentrations along the biofilter height. Toluene-contaminated air volumetric loading is 35.6 m3/m3
biofilter/h, curve 1: Inlet toluene gas-phase concentration is 3.01 g/m3, curve 2: Inlet toluene gas-phase concentration is
1.96 g/m3, experimental data adopted from Park and Jung
[12].
Biofilter height (m)
0.0 0.1 0.2 0.3 0.4 0.5 0.6
G
as
ph
as
e t
ol
uen
e co
ncen
tr
at
io
n
(g
/m
3 )
0 1 2 3 4
Experimental data Experimental data Model 1 simulation curve 1 Model 1 simulation curve 2
Figure 4. Model 1 (no substrate inhibition) prediction of toluene gas-phase concentrations along the biofilter height. Toluene-contaminated air volumetric loading is 35.6 m3/m3
biofilter/h, curve 1: Inlet toluene gas-phase concentration is 3.01 g/m3, curve 2: Inlet toluene gas-phase concentration is
1.96 g/m3, experimental data adopted from Park and Jung
[12].
ganisms and substrate inhibition becomes important. On the other hand, the experiments by Aizpuru et al. [29] used fungi as the toluene-biodegrading microorganisms for which substrate inhibition was negligible [22]. These analyses demonstrate careful selection of the model and the kinetics of biodegradation.
4.3. Biofilter Model 3 (with Flow Rate Modification)
Model 3 developed by Li and De Visscher [22] accounts for the effect of varying air flow rate. In this case, Equa- tion (2) combined with Equations (10)-(12) must be solved simultaneously.
The model solutions are reproduced and were com- pared with experimental results of Vergara-Fernándaz et al. [38]. The parameters used to solve model 3 are sum- marized in Table 3.
Their experiments were carried out at 32˚C - 37˚C in a toluene-degrading biofilter subjected to varying air flow rates. Compost and seashells were used as a packing ma- terial with microbial flora present in the compost. The height and diameter of the biofilter were 0.75 m and 0.145 m, respectively. Inhibition is considered in this case [39]. The solution to model 3 using the parameters in Table 3 are obtained for four different flow rates 0.12, 0.18, 0.24 and 0.73 m3/h. Figure 5 shows the simulation results with the experimental data from Vergara- Fernándaz et al. [38] for the flow rate of 0.12 m3/h. On the same graph, experimental results were also compared with model 2 which neglect the effect of air flow rate variation. Model 2 shows wider variation with the ex- perimental data than the simulation results presented by Li and De Visscher [22]. This indeed confirms that flow rate modification is an important factor which should not be ignored.
4.4. Sensitivity Analysis
4.4.1. Effect of Actual Maximum Growth Rate
max
A sensitivity analysis of model 1 - 3 is performed to study the effect of the actual maximum specific growth rate
max
on the removal efficiency of toluene. Theeffect of changing max , with all other parameters fixed as in Table 1 is shown in Figure 6. An increase in max leads to an increase in the removal efficiency of toluene in case of model 1. However, percent removal efficiency (%RE) asymptotically reaches a maximum value at
max
Table 3. Model 3 parameters (with flow rate modification) [38].
Parameter Value Unit Source
max
µ 0.12 h−1 [39]
Km 11.1 g/m3 [22]
a 0.0017 h−1 [32]
KI 95.5 g/m3 [22]
Vmax,max 869.3 g pollutant/m3 biofilter/h [22]
p 0.6325 - [22]
Hcc 0.422 - [33]
Biofilter height (m)
0.0 0.2 0.4 0.6 0.8
G
as
ph
ase
tol
u
en
e c
on
c
en
tr
at
ion
(
g
/m
3 )
0.0 0.5 1.0 1.5 2.0
Experimental data Model 3 simulation Model 2 simulation
Figure 5. Model 3 (with flow rate modification) prediction of toluene gas-phase concentrations along the biofilter height. Toluene-contaminated air volumetric flow rate is 0.12 m3/h, inlet toluene gas-phase concentration is 1.95 g/m3,
experimental data adopted from Vergara-Fernándaz et al. [38].
exp
0.0 0.5 1.0 1.5 2.0 2.5
RE
(
%
)
[image:7.595.56.290.110.425.2]96.5 97.0 97.5 98.0 98.5 99.0
Figure 6. Effect of changing µmax in model 1 (no substrate inhibition) on removal efficiency (RE). Toluene-contami- nated air volumetric loading is 77.6 m3/m3 biofilter/h, inlet
toluene gas-phase concentration is 4.6 g/m3, is
0.28 h−1.
,
max experimental µ
very similar to model 2, the effect of changing the actual maximum specific growth rate will be the same as in case of model 2.
4.4.2. Effect of Michaelis-Menten Constant (Km) The effect of changing the Michaelis-Menten constant (Km) on the removal efficiency was studied. In case of model 1, all parameters in Table 1 were fixed and the Michaelis-Menten constant was changed. The experi- mental Km value was 1.24 g/m3. The effect of changing
Km on removal efficiency in model 1 is depicted in Fig- ure 8. For mode1 1 that neglects substrate inhibition, an increase in the value of the Michaelis-Menten constant (Km) results in a decrease in removal efficiency. The
exp
0.0 0.5 1.0 1.5 2.0 2.5
RE
(
%
)
[image:7.595.310.537.264.432.2]20.0 20.5 21.0 21.5 22.0
Figure 7. Effect of changing µmax in model 2 (with substrate inhibition) on removal efficiency (RE). Toluene-contami- nated air volumetric loading is 35.6 m3/m3 biofilter/h, inlet
toluene gas-phase concentration is 3.01 g/m3,
,
max experimental µ
is 0.58 h−1.
Km / Km,exp
0.5 1.0 1.5 2.0 2.5
RE
(%
)
88 90 92 94 96 98 100
Figure 8. Effect of changing Km in model 1 (no substrate inhibition) on removal efficiency (RE). Toluene-contami- nated air volumetric loading is 77.6 m3/m3 biofilter/h, inlet
toluene gas-phase concentration is 4.6 g/m3,
Km,experimental is
[image:7.595.60.285.504.671.2] [image:7.595.308.536.509.677.2]same trend was observed at different inlet toluene gas- phase concentrations. In case of model 2 with substrate inhibition, the effect of changing Km, while keeping other parameters in Table 2 constant, is shown in Figure 9 for inlet toluene gas-phase concentration is 3.01 g/m3. Again, an increase in the value of the Michaelis-Menten con- stant (Km) results in a decrease in removal efficiency. Since model 3 is very similar to model 2, the effect of changing Km will be the same as in case of model 2.
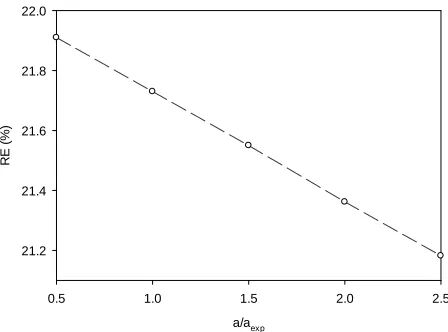
4.4.3. Effect of Decay Rate (a)
The effect of changing the decay rate on removal effi- ciency in model 1 is shown in Figure 10. The other pa-
Km / Km,exp
0.5 1.0 1.5 2.0 2.5
RE
(
%
)
[image:8.595.62.285.255.418.2]18 19 20 21 22 23 24
Figure 9. Effect of changing Km in model 2 (with substrate inhibition) on removal efficiency (RE). Toluene-contami- nated air volumetric loading is 35.6 m3/m3 biofilter/h, inlet
toluene gas-phase concentration is 3.01 g/m3,
Km,experimental is
5.34 g/m3, experimental data adopted from Park and Jung
[12].
a/aexp
0.5 1.0 1.5 2.0 2.5
RE
(
%
)
98.5 98.6 98.7 98.8 98.9
Figure 10. Effect of changing decay rate “a” in model 1 (no substrate inhibition) on removal efficiency (RE). Toluene- contaminated air volumetric loading is 77.6 m3/m3
biofil-ter/h, inlet toluene gas-phase concentration is 4.6 g/m3,
aex- perimental is 0.0017 h−1, experimental data adopted from
Aiz-puru et al. [29].
rameters were kept constant as in Table 1. As expected, the higher the decay rate of the biomass, the lower the removal efficiency in case of model 1. Similarly, the ef- fect of changing the decay rate on removal efficiency in model 2 is shown in Figure 11. Model 3 also gave simi- lar results. In all cases, for the range of decay rates se- lected, the effect on the removal efficiency was not very significant. Nevertheless, the conditions of the biofilter must be properly selected in order to minimize biomass decay.
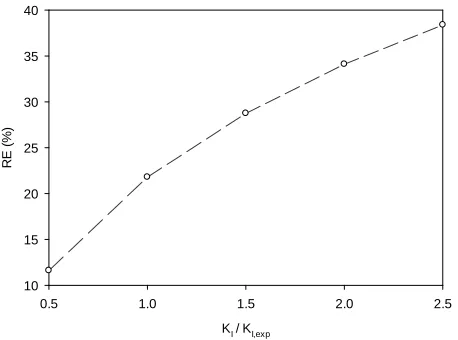
4.4.4. Effect of Inhibition Constant (KI)
Inhibition is an important factor in model 2 for the pre- diction of gas-phase toluene concentration along the biofilter height. The effect of changing the inhibition constant (KI) on removal efficiency in model 2 is shown in Figure 12. An increase in the inhibition constant (KI), leads to an increase in toluene removal efficiency in model 2. The results from with model 3 were similar. Again, since model 3 is very similar to model 2, the ef- fect of changing Km will be the same as in case of model 2.
5. Conclusion
In this work, important literature on recent biofilter mod- els are reviewed. The toluene biofilter model of Li and De Visscher [22] is solved and compared with a new experimental data of Zamir et al. [28]. The model is in very good agreement with the experimental data. Thus, the model can be used as a good approximation for full scale biofilter design calculations, particularly for toluene removal. A sensitivity analysis of the three models is performed. Maximum specific growth rate, kinetic con-
a/aexp
0.5 1.0 1.5 2.0 2.5
RE
(
%
)
[image:8.595.311.535.498.664.2]21.2 21.4 21.6 21.8 22.0
Figure 11. Effect of changing Km in model 2 (with substrate inhibition) on removal efficiency (RE). Toluene-contami- nated air volumetric loading is 35.6 m3/m3 biofilter/h, inlet
toluene gas-phase concentration is 3.01 g/m3, a
experimental is
0.0017 h−1, experimental data adopted from Park and Jung
[image:8.595.61.286.499.665.2]KI / KI,exp
0.5 1.0 1.5 2.0 2.5
RE
(
%
)
[image:9.595.59.288.84.254.2]10 15 20 25 30 35 40
Figure 12. Effect of changing KI in model 2 (with substrate inhibition) on removal efficiency (RE). Toluene-contami- nated air volumetric loading is 35.6 m3/m3 biofilter/h, inlet
toluene gas-phase concentration is 3.01 g/m3,
KI,experimental is
2.66 g/m3, experimental data adopted from Park and Jung
[12].
stant (Km), and inhibition constants are more sensitive to removal efficiency than decay rate constant. Thus, accu- rate estimation of these parameters is important. Al- though the model does not provide an insight into the nature of the limiting factors such as oxygen effects and diffusion limitations involved in the biofiltration process, the model is simple and will enable designing of biofil- ters using fewer biofilter parameters.
6. Acknowledgements
The authors acknowledge the support of the Chemical Engineering Department at the American University of Sharjah.
REFERENCES
[1] T. Nukunya, J. S. Debinny and T. T. Tsotsis, “Applica- tion of a Pore Network Model to a Biofilter Treating Ethanol Vapor,” Chemical Engineering Science, Vol. 60, No. 3, 2005, pp. 665-667. doi:10.1016/j.ces.2004.08.038 [2] B. V. Babu and S. Raghuvanshi, “Simulation Studies on
Transient Model for Biofilter Operated in Periodic Mode,” Journal on Engineering and Technology, Vol. 1, No. 4, 2006, pp. 72-76.
[3] C. R. Soccol, et al., “Biofiltration: An Emerging Tech- nology,” Indian Journal of Biotechnology, Vol. 2, No. 2, 2003, pp. 396-410.
[4] Z. Shareefdeen and A. A. Shaikh, “Analysis and Com-parison of Biofilter Models,” Chemical Engineering Jour- nal, Vol. 65, No. 1, 1998, pp. 55-61.
[5] J. S. Devinny and J. Ramesh, “A Phenomenological Re- view of Biofilter Models,” Chemical Engineering Journal, Vol. 113, No. 2-3, 2005, pp. 187-196.
doi:10.1016/j.cej.2005.03.005
[6] M. Hirai, M. Ohtake and M. Shoda, “Removal Kinetics of Hydrogen Sulfide, Methanethiol and Dimethyl Sulfide by Peat Biofilters,” Journal of Fermentation Bioengineering, Vol. 70, No. 5, 1990, pp. 334-339.
doi:10.1016/0922-338X(90)90145-M
[7] S. P. P. Ottengraf and A. H. C. van den Oever, “Kinetics of Organic Compound Removal from Waste Gases with a Biological Filter,” Biotechnology and Bioengineering, Vol. 25, No. 12, 1983, pp. 3089-3102.
doi:10.1002/bit.260251222
[8] Z. Shareefdeen, B. C. Baltzis, Y. S. Oh and R. Bartha, “Biofiltration of Methanol Vapor,” Biotechnology and Bioengineering, Vol. 41, No. 5, 1993, pp. 512-524. doi:10.1002/bit.260410503
[9] Z. Shareefdeen and B. C. Baltzis, “Biofiltration of Tolu- ene Vapor under Steady-State and Transient Conditions: Theory and Experimental Results,” Chemical Engineer- ing Science, Vol. 49, No. 24, 1994, pp. 4347-4360. doi:10.1016/S0009-2509(05)80026-0
[10] M. A. Deshusses, G. Hamer and I. J. Dunn, “Behavior of Biofilters for Waste Air Biotreatment. 1. Dynamic Model Development,” Environmental Science Technology, Vol. 29, No. 4, 1995, pp. 1048-1058.
doi:10.1021/es00004a027
[11] M. A. Deshusses, G. Hamer and I. J. Dunn, “Behavior of Biofilters for Waste Air Biotreatment. 2. Experimental Evaluation of a Dynamic Model,” Environmental Science Technology, Vol. 29, No. 4, 1995, pp. 1059-1068. doi:10.1021/es00004a028
[12] O. Park and I. Jung, “A Model Study Based on Experi- ments on Toluene Removal under High Load Condition in Biofilters,” Biochemical Engineering Journal, Vol. 28, No. 3, 2006, pp. 269-274. doi:10.1016/j.bej.2005.11.011 [13] C. P. Yang, H. Chen, W. Qu, Y. Y. Zhong, X. Zhu and M.
T. Suidan, “Modeling Biodegradation of Toluene in Ro- tating Drum Biofilter”, Water Science Technology, Vol. 54, No. 9, 2006, pp. 137-144. doi:10.2166/wst.2006.860 [14] Q. Liao, X. Tian, R. Chen and X. Zhu, “Mathematical
Model for Gas-Liquid Two-Phase Flow and Biodegrada- tion of a Low Concentration Volatile Organic Compound (VOC) in a Trickling Biofilter,” International Journal of Heat and Mass Transfer, Vol. 51, No. 7-8, 2007, pp. 1780- 1792. doi:10.1016/j.ijheatmasstransfer.2007.07.007 [15] J. Chen, Y. Jiang, H. Sha and W. Zhang, “Dynamics
Model for Nitric Oxide Removal by a Rotary Drum Biofilter,” Journal of Hazardous Materials, Vol. 168, No. 2-3, 2009, pp. 1047-1052.
doi:10.1016/j.jhazmat.2009.02.159
[16] G. Spigno, M. Zilli and C. Nicolella, “Mathematical Mo- deling and Simulation of Methanol Degradation in Bio- filters,” Biochemical Engineering Journal, Vol. 19, No. 3, 2004, pp. 267-275. doi:10.1016/j.bej.2004.02.007 [17] G. Baquerizo, et al., “A Detailed Model of a Biofilter for
Ammonia Removal: Model Parameters Analysis and Model Validation,” Chemical Engineering Journal, Vol. 113, No. 2-3, 2005, pp. 205-214.
doi:10.1016/j.cej.2005.03.003
Air Biofilter,” Process Biochemistry, Vol. 39, No. 12, 2004, pp. 1849-1858. doi:10.1016/j.procbio.2003.09.019 [19] K. Chmiel, et al., “Periodic Operation of Biofilters. A
Concise Model and Experimental Validation,” Chemical Engineering Science, Vol. 60, No. 11, 2005, pp. 2845- 2850. doi:10.1016/j.ces.2004.12.035
[20] EPA, “Chemical Summary of Toluene,” 2011. www.epa.gov/chemfact/s_toluen.txt
[21] K. Singh, R. S. Singh and S. N. Upadhyay, “Biofiltration of Toluene Using Wood Charcoal as the Biofilter Media,” Bioresource Technology, Vol. 101, No. 11, 2009, pp. 3947- 3951. doi:10.1016/j.biortech.2010.01.025
[22] G. Q. Li and A. De Visscher, “Toluene Removal Biofilter Modeling,” Air and Waste Management Association, Vol. 58, No. 7, 2008, pp. 947-956.
doi:10.3155/1047-3289.58.7.947
[23] A. De Visscher and O. Van Cleemput, “Simulation Model for Gas Diffusion and Methane Oxidation in Landfill Cover Soils,” Waste Management, Vol. 23, No. 7, 2003, pp. 581-591. doi:10.1016/S0956-053X(03)00096-5 [24] S. J. Pirt, “Principles of Microbe and Cell Cultivation,”
Blackwell Scientific, Oxford, 1975.
[25] J. S. Devinny, M. A. Deshusses and T. S. Webster, “Bio- filtration for Air Pollution Control,” CRC Press, Boca Raton, 1999.
[26] J. B. S. Haldane, “Enzymes,” Longmans, Green, New York, 1930.
[27] M. O. Pereira, M. Kuehn, S. Wuertz, T. Neu and L. F. Melo, “Effect of Flow Regime on the Architecture of a Pseudomonas Fluorescens Biofilm,” Biotechnology and Bioengineering, Vol. 78, No. 2, 2002, pp. 164-171. doi:10.1002/bit.10189
[28] S. M. Zamir, R. Halladj and B. Nasernejad, “Removal of Toluene Vapors using a Fungal Biofilter under Intermit- tent Loading,” Process Safety and Environmental Protec- tion, Vol. 89, No. 1, 2011, pp. 8-14.
doi:10.1016/j.psep.2010.10.001
[29] A. Aizpuru, B. Dunat, P. Christen, R. Auria, I. Gar-cıa-Pena and S. Revah, “Fungal Biofiltration of Toluene on Ceramic Rings,” Journal of Environmental Engineer- ing, Vol. 131, No. 3, 2005, pp. 396-402.
doi:10.1061/(ASCE)0733-9372(2005)131:3(396)
[30] L. F. Bautista, A. Aleksenko, M. Hentzer, A. Santerre- Henriksen and J. Nielsen, “Antisense Silencing of the CreA Gene in Aspergillus Nidulans,” Applied and Envi- ronmental Microbiology, Vol. 66, No. 10, 2000, pp. 4579-4581. doi:10.1128/AEM.66.10.4579-4581.2000
[31] M. Carlsen, A. B. Spohr, J. Nielsen and J. Villadsen, “Morphology and Physiology of an α-Amylase Producing Strain of Aspergillus Oryzae during Batch Cultivations,” Biotechnology and Bioengineering, Vol. 49, No. 3, 1996, pp. 266-276.
doi:10.1002/(SICI)1097-0290(19960205)49:3<266::AID-BIT4>3.0.CO;2-I
[32] T. D. Reynolds and P. A. Richards, “Unit Operations and Processes in Environmental Engineering,” 2nd Edition, PWS Press, Boston, 1996.
[33] “EPA Online Tools for Site Assessment Calculations— Estimated Henry’s Law Constant-OSWER Method,” U.S. Environmental Protection Agency, 2011.
http://www.epa.gov/ATHENS/learn2model/part-two/onsi te/esthenry.html
[34] K. F. Reardon, D. C. Mosteller and J. D. Bull Rogers, “Biodegradation Kinetics of Benzene; Toluene, and Phe- nol as Single and Mixed Substrates for Pseudomonas Putida F1,” Biotechnology & Bioengineering, Vol. 69, No. 4, 2000, pp. 385-400.
doi:10.1002/1097-0290(20000820)69:4<385::AID-BIT5> 3.0.CO;2-Q
[35] R. Mirpuri, W. Jones and J. D. Bryers, “Toluene Degra- dation Kinetics for Planktonic and Biofilm: Growth Cells of Pseudomonas putida 54G,” Biotechnology and Bioen- gineering, Vol. 53, No. 6, 1997, pp. 535-546.
doi:10.1002/(SICI)1097-0290(19970320)53:6<535::AID-BIT1>3.0.CO;2-N
[36] Y. B. Choi, J. Y. Lee and H. S. Kim, “A Novel Bioreactor for the Biodegradation of Inhibitory Aromatic Solvents: Experimental Results and Mathematical Analysis,” Bio- technology and Bioengineering, Vol. 40, No. 11, 1992, pp. 1403-1411. doi:10.1002/bit.260401115
[37] F. X. Prenafeta-Bold, A. Kuhn, D. M. A. M. Luykx, H. Anke, J. W. Van Groenestijn and J. A. M. De Bont, “Iso- lation and Characterization of Fungi Growing on Volatile Aromatic Hydrocarbons as Their Sole Carbon and Energy Source,” Mycological Research, Vol. 105, No. 4, 2001, pp. 477-484. doi:10.1017/S0953756201003719
[38] A. Vergara-Fernandez, L. L. Molina, N. A. Pulido and G. Aroca, “Effects of Gas Flow Rate, Inlet Concentration and Temperature on the Biofiltration on Toluene Vapors,” Journal of Environmental Management, Vol. 84, No. 2, 2007, pp. 115-122. doi:10.1016/j.jenvman.2006.04.009 [39] S. M. Maliyekkal, E. R. Rene, L. Philip and T. Swamina-
than, “Performance of BTX Degraders under Substrate Versatility Conditions,” Journal of Hazardous Materials, Vol. 109, No. 1-3, 2004, pp. 201-211.
![Figure 5. Model 3 (with flow rate modification) prediction of toluene gas-phase concentrations along the biofilter experimental data adopted from Vergara-Fernándaz [38].height](https://thumb-us.123doks.com/thumbv2/123dok_us/84358.508717/7.595.55.287.110.430/figure-modification-prediction-concentrations-biofilter-experimental-vergara-fernandaz.webp)