Since the seminal work of Balassa (1965), a vast amount of literature is dedicated to the analyses of revealed comparative advantages of the global trade. Despite the apparent importance of the topic, however, most studies have focused on industrial products, while the agri-food sectors are usually neglected in the empirical works. Moreover, the determinants of revealed comparative advantages are scarcely investi-gated in empirical works. This article aims to analyse the revealed comparative advantages in the European ham trade from 1999 to 2013 and seeks to identify its determinants by using the panel data econometrics. Such an approach, at least to our knowledge, is cur-rently missing from the literature. The ham trade is important for investigation because it is one of the most important high-value added meat products with the relevant international trade where the importance of the place of origin is also high. This paper expands the existing literature in three ways. First, it applies the theory of revealed comparative advantages on an agricultural product. Second, it analyses the stability of comparative advantages. Third, it seeks to identify the factors lying behind comparative advantages.
LITERATURE REVIEW
There is just a limited amount of literature analys-ing revealed comparative advantages in the field of
agriculture. Fertő and Hubbard (2003) were among the first to analyse revealed comparative advantages in the Hungarian agri-food sectors and identified eleven competitive product groups. Fertő (2008) analysed the evolution of agri-food trade patterns in the Central European Countries and found the trade specialisation to be mixed. For particular product groups, greater variation was observed, with generally stable (unsta-ble) patterns of variation for product groups with the comparative disadvantage (advantage). Qineti et al. (2009) analysed the competitiveness and compara-tive advantage of the Slovak and the EU agri-food trade with Russia and Ukraine and found that the comparative advantage had been lost for a number of product groups over time, though the results for the individual product groups varied significantly.
Bojnec and Fertő (2009) searched for the agro-food trade competitiveness of the Central European and Balkan countries and showed that the bulk primary raw agricultural commodities had higher and more stable relative trade advantages compared to the consumer-ready foods, implying competitiveness shortcomings in the food processing and in inter-national food marketing. Bojnec and Fertő (2012) investigated the impact of the EU enlargement on agro-food export performance of New Member States (NMS) over 1999–2007 and found longer duration for exporting the higher value-added specialized consumer-ready food and more competitive niche
Determinants of the revealed comparative advantages:
The case of the European ham trade
Aron TOROK, Attila JAMBOR
Corvinus University of Budapest, Budapest, Hungary
Abstract: Revealed comparative advantages are widely used by the global literature to analyse the international trade fl ows, though agricultural trade is usually neglected in the empirical works. Moreover, the determinants of revealed comparative advantages are scarcely investigated. Th is article analyses revealed comparative advantages in European ham trade from 1999 to 2013 and identifi es its determinants by using the panel data econometrics. Th e results suggest that quality linked to the production area highly aff ects the competitiveness of the European ham trade. Also, the EU accession is positively co-rrelated with the competitiveness, meaning that the economic integration fosters competitiveness. However, in spite of the initial expectations, the FDI is negatively related to the competitiveness of the European ham trade, underlining the impor-tance of the national ham processing companies.
agro-food products. Bojnec and Fertő (2014) analysed the agri-food competitiveness of the European coun-tries and showed that most of the old EU-15 member states experienced a greater number of agri-food products having a longer duration of the revealed comparative export advantages than most of the new EU-12 member states have.
Jámbor (2013) analysed the comparative advantages and specialisation of the Visegrad Countries agri-food trade and showed that comparative advantages de-creased after the accession in all countries, suggesting a weakening stability of the competitive positions. Török and Jámbor (2013) analysed the New Member States agri-food trade patterns and highlighted that almost all countries experienced a decrease in their comparative advantage after the accession, though it still remained at an acceptable level in most cases. Sahinli (2013) analysed the comparative advantages of the agriculture sectors of Turkey and the European Union and found the EU to be more competitive in the majority of the products. Serin and Civan (2008) analysed similar relations and found the Turkish fruit juices and olive oils to be highly competitive in European markets.
All the above raises the questions what determines a country’s comparative advantages in a market? What factors are behind the changes in comparative advantages? This topic is very much understudied in the literature. It was just Couillard-Turkina (2014) doing such research when analysing the effects of the free trade agreements on the competitiveness of the dairy sector. Their results suggest that the free trade agreements actually have a positive impact on comparative advantages. Therefore, the paper seeks to contribute to the scant literature of the field by analysing the determinants of the revealed compara-tive advantages in the European ham industry.
METHODOLOGY
The various methods elaborated around the theory of the revealed comparative advantage provide the basis for analysis. The original index of the revealed comparative advantage was first published by Balassa (1965) who defined the following:
Bij
nt nj it ij
X X X
X (1)
where X means export, i indicates a given country, j
is a given product, t is a group of products and n is a
group of countries. It follows that a revealed compara-tive advantage (or disadvantage) index of exports can be calculated by comparing a given country’s export share of its total exports with the export share in the total exports of a reference group of countries. If B > 1, a given country has a comparative advantage compared to the reference countries – or, in contrast, a revealed comparative disadvantage if B < 1.
The Balassa-index is criticized because it neglects the different effects of agricultural policies and ex-hibits asymmetric values. The trade structure is distorted by different state interventions and trade limitations, while the asymmetric value of the B index reveals that it extends from one to infinity if a country enjoys a comparative advantage, but in the case of the comparative disadvantage, it var-ies between zero and one, which overestimates a sector’s relative weight. Vollrath suggested three different specifications of the revealed comparative advantage in order to eliminate the disadvantages of the Balassa index, the detailed description of which can be found in Vollrath (1991).
In order to treat the asymmetric value problem of the Balassa-index, Dalum et al. (1998) transformed the B index as follows, thereby creating the Revealed Symmetric Comparative Advantage (RSCA) index:
RSCA = (B – 1)/(B + 1) (2)
The RSCA takes values between –1 and 1, with values between 0 and 1 indicating a comparative export advantage and values between −1 and 0 a comparative export disadvantage. Since the RSCA distribution is symmetric around zero, a potential bias is avoided (Dalum et al. 1998).
Besides calculating the revealed comparative ad-vantages, the literature suggests that their stability and duration should be measured as well. In analysing the stability of the RSCA index, a regression was run on the dependent variable, the RSCA index at time t2 (for sector i in country j), which is tested against the independent variable – the RSCA index in year t1 (3).
௧ଶ ൌ Ƚ
Ⱦ௧ଵ ɂ (3)
speciali-zation in the initial period leads to less specialispeciali-zation in the future, which is called β divergence (Bojnec and Fertő 2008b). On the other hand, if 0 < β < 1, the commodity groups with a low initial B indices grow over time, which is called β convergence (Bojnec and Fertő 2008b). However, if β < 0, a change in the sign of the index is shown.
However, as Dalum et al. (1998) point out, the β > 1 is not a necessary condition for the growth in the overall specialization pattern. They argue that suffi-cient conditions for specialization or de-specialization need further analyses. If R is the correlation coef-ficient of the regression, then the pattern of a given distribution is unchanged when β = R. If β > R, then the degree of specialization has grown (leading to divergence). If β < R, then the degree of specializa-tion has fallen (meaning convergence).
Following Bojnec and Fertő (2008a), a survival function S(t) can also be estimated by the using the non-parametric Kaplan-Meier product limit estima-tor, which pertains to the product level distribution analysis of the RSCA index. Following Bojnec and Fertő (2008a), a sample contains n independent ob-servations denoted (ti; ci), where i = 1, 2, ..., n, and ti
is the survival time, while ci is the censoring indicator variable C (taking on a value of 1 if a failure occurred, and 0 otherwise) of observation i. Moreover, it is as-sumed that there are m < n recorded times of failure. Then, we denote the rank-ordered survival times as
t(1) < t(2) < … < t(m). Let nj indicate the number of subjects at risk of failing at t(j) and let dj denote the number of observed failures. The Kaplan-Meier estimator of the survival function is then (with the convention that Sˆ(t)= 1 if t < t(1)):
j j j t i t n
d n t
S
) (
) (
ˆ (4)
In analysing the determinants of the European ham trade, the following hypotheses are tested in the paper.
H1: Higher factor endowments increase comparative advantages
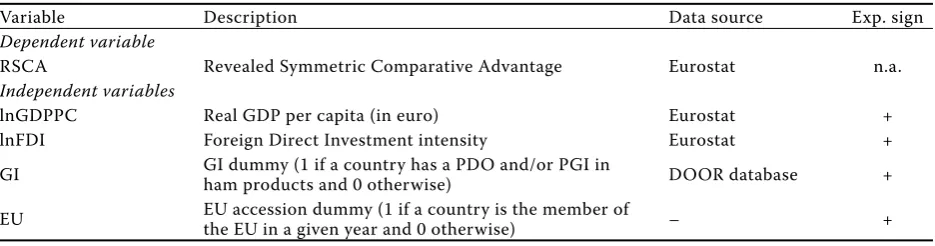
The difference in factor endowments is usually measured by the inequality in the per capita GDP, in line with Falvey and Kierzkowski (1987). It seems reasonable that higher factor endowments of a country lead to higher comparative advantages based on the higher number of resources available. Factor endow-ments are proxied by the logarithm of per capita GDP (lnGDPPC), which is expected to be positively related to comparative advantages. Per capita GDP is
measured in PPP in constant 2005 US dollars, where the data come from the World Bank WDI database.
H2: Capital investments foster comparative advantages
The process cured ham production is very long. Prosciutto di Parma, one of the most well-known hams of Italy, for instance, has to be cured for at least 12 months, but in the European market, the most expensive hams could be aged up to 4–5 years. This process is very capital intensive, only financially strong companies could afford it. Therefore, we assume that the capital investment, proxied by the Foreign Direct Investment (FDI) intensity, encourages the growth of comparative advantages. FDI intensity data is coming from the EUROSTAT market integration indicator database and reflects the total FDI due to the lack of the industry specific data in this regard.
H3: Geographical indication is positively related to comparative advantages
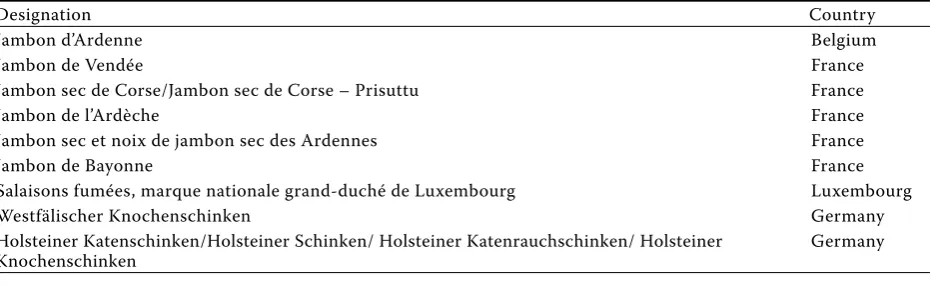
The food quality policy of the European Union underlines the importance of the place of origin. The geographical indication guarantees that an agricul-tural product is produced under the highest food quality standards in a region. By the end of 2014, 8 EU member states had 43 different hams with the geographical indication (17 Protected Designation of Origin and 26 Protected Geographical Indications). The geographical indication is included in the model with a dummy variable, taking a value of 1 if the given country has a PDO or PGI ham product (see appendix). Note that the share of the GI products in the total production would be a better proxy for this variable, though such share is not available in any database.
H4: EU accession is positively related to comparative advantages
The previous studies (Fertő and Soós 2009; Bojnec and Fertő 2012) show that the duration of trade in both manufacturing and agri-food products differs across the European markets. For the majority of countries, the duration of trade is greater in the EU the 10/12 markets than in the EU15 markets. It is evident that the economic integration fosters the agri-food trade, which will occur as the new mem-bers become integrated. This hypothesis is tested by a dummy variable with a value of 1 if the reporter is an EU member and a 0 if not.
of the European ham trade in 1999–2013. On the whole, we estimate the following regression model:
RSCAit= α + β1lnGDPPCit + β2lnFDIit + β3GI it +
β4EUitui + εit (5)
Table 1 provides an overview of the description of variables and related hypotheses.
In estimating the determinants of comparative ad-vantages, the panel-corrected standard errors (PCSE) panel estimation technique is applied to equation (4) in order to ensure the robustness of the results and the control for heteroskedasticity and contem-poraneous correlation across panels (Beck and Katz 1995, 1996). Many other static and dynamic panel data techniques are available including the pooled OLS, the fixed effects (FE) and the random effects (RE), the feasible generalised least squares (FGLS) and the GMM-SYS method, though contrary to the recent studies (Leitao 2012; Jámbor 2014; Fertő and Jámbor 2015), the PCSE method provided the best results for our sample.
The paper employs the European ham trade data for 1999–2013 and, in this context, the EU is defined as the member states of the EU28. Furthermore, it concentrates on the B index (and its transformation, the RSCA index) as it excludes imports, which are more likely to be influenced by the policy interven-tions. The phasing out of export subsidies is a further reason to choose a B-based index. In order to calcu-late the various indices mentioned above, the paper uses the Eurostat CN8 trade data. The ham trade is defined as the trade of the domestic swine hams and cuts thereof, as detailed in the appendix. The paper works with the trade data for 1999–2013 and divides this period into three sub-periods (1999–2003, 2004–2008 and 2009–2013).
The characteristics of the European ham trade
The vast majority of European hams is sold within Europe, though the share of export to third countries is increasing (Figure 1). The growing share of the ham sold to third countries (from 8% to 20% between 1999 and 2013) is due to the increasing demand of countries from the Far-East. In the period analysed, the European ham export to Japan increased by more than thirteen times and thereby Japan is the most important third country partner of Europe in this regard. Other important ham destinations are the United States and Russia, though the latter shows high fluctuations due to the increasing number of trade barriers emerged.
[image:4.595.64.532.112.235.2]Ham imported by the European Union is not rel-evant at all. Although the share of import from third countries increased from 1999 to 2013, it is still below 2%. On the whole, one can conclude that the most important market for European hams is the European Union, therefore, this paper only deals with the intra-European ham trade.
Table 1. Description of variables
Variable Description Data source Exp. sign
Dependent variable
RSCA Revealed Symmetric Comparative Advantage Eurostat n.a.
Independent variables
lnGDPPC Real GDP per capita (in euro) Eurostat +
lnFDI Foreign Direct Investment intensity Eurostat +
GI GI dummy (1 if a country has a PDO and/or PGI in
ham products and 0 otherwise) DOOR database +
EU EU accession dummy (1 if a country is the member of the EU in a given year and 0 otherwise) – +
Source: Own composition
0 20 40 60 80 100
1999–2003 2004–2008 2009–2013
EU28_INTRA EU28_EXTRA
[image:4.595.64.289.565.701.2](%)
Figure 1. European ham export by destination, 1999– 2013, percentage
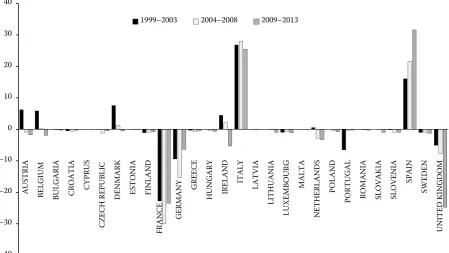
As to the most important players of the European ham market, Italy and Spain are leading the line with highly positive trade balances in all the sub-periods (Figure 2). The Spanish ham trade balance shows a dynamic increase, while the Italian is almost the same. At the other end, three countries (France, Germany and the United Kingdom) are the places where the biggest amount of European ham is sold.
Two other country groups are recognized: countries with the positive trade balance in the first and/or second sub-period (1999–2003 and 2004–2008) and countries with the negative trade balance in all the years. In the first group, Austria, Belgium, Denmark and Ireland used to have significant surplus in the ham trade between 1999 and 2003 but finally their import (most assuredly from Italy and Spain) has
exceeded their export (Figure 2). In the case of some New Member States (e.g. Estonia and Hungary), the negative change in their ham trade balance is supposedly caused by the negative effects of the EU accession on their ham industry. In the second group, Portugal should be highlighted: its ham trade deficit decreased significantly from 6.5 million euro to 0.2 million euro from 1999 to 2013.
In line with Figure 2, a more disaggregated list of the main trading partners of the European ham is given in Table 2 and Table 3. It is evident that the two most important ham exporters are Italy and Spain, representing more than one half of the total European export in all periods. However, Spain has taken the lead after 2008 because of the dynamic expansion in its ham export. Besides these two countries, Belgium
–40 –30 –20 –10 0 10 20 30 40
AUSTRIA BELGIUM
BUL
GARIA
CR
OATIA CYPR
US
CZ
ECH REPUBLI
C
DEN
MARK
ES
TONIA
FINLAND
FRA
NCE GERM
ANY GREECE HUNGARY IRELAND
ITALY
LATVI
A
LITHUANIA
LUXEMBOURG
MALTA
NE
THERLAN
DS
PO
LA
ND
PO
RTUG
A
L
RO
MA
NI
A
SLOVAKIA SLOVENIA
SPAIN
SWE
DEN
UNITED KINGDOM
[image:5.595.62.539.652.741.2]1999–2003 2004–2008 2009–2013
Figure 2. Trade balance of ham in the EU member states, 1999–2013, million euro
Source: Own composition based on the Eurostat (2015)
Table 2 TOP 5 ham exporters in the EU, 1999–2013, percentage
Country 1999–2003 (%) Country 2004–2008 (%) Country 2009–2013 (%)
Italy 31 Italy 34 Spain 38
Spain 19 Spain 24 Italy 32
Belgium 12 France 13 Belgium 7
Austria 9 Belgium 12 France 7
Denmark 8 Ireland 4 Portugal 6
TOP5 total 79 TOP5 total 87 TOP5 total 90
is also an important ham exporter but with a decreas-ing European share. The very high and increasdecreas-ing concentration of the TOP5 exporters is also evident from Table 2: five countries gave 90% of the European ham export in 2009–2013.
Regarding ham imports, it is observable that the most important importers are France, Germany, the United Kingdom and Belgium, mainly because of the size of their markets with a high demand (Table 3). One-third of European hams were sold in France in 1999-2003 and 2004-2008, while this share decreased to 26% in 2009–2013. Note that some countries (e.g. Belgium, Italy, and France) also appear among the TOP5 importers, suggesting the intra-industry ham trade patterns. This phenomenon can be explained by the great ham processing capacities of these coun-tries - many pigs slaughtered in other councoun-tries (e.g. Denmark and the Netherlands) are transferred to Italy, for instance, because of the traditional Italian processing methods. In the end, these products are re-exported, increasing the share of the Italian ham
export. The concentration of the European ham im-port is also high but decreasing.
Specialisation of European ham trade
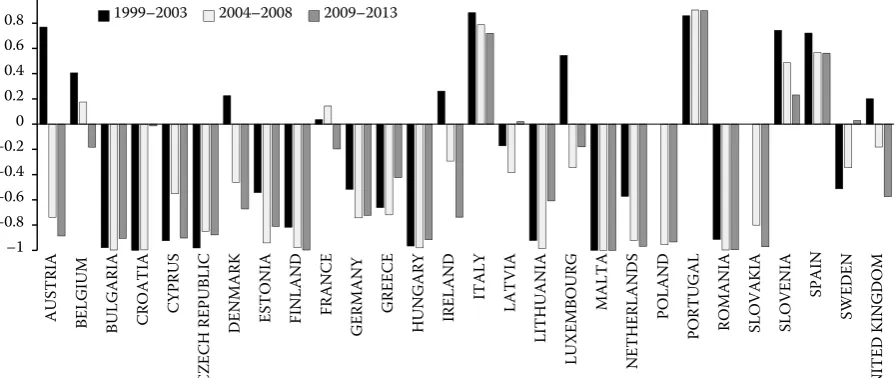
[image:6.595.62.536.112.201.2] [image:6.595.74.522.525.714.2]With the calculation of the RSCA indices, the spe-cialisation of European ham trade becomes apparent (Figure 3). First, it is a general tendency that the competitiveness of the member states has weakened from 1999 to 2013 – only four countries had posi-tive values at the end of the period: Italy, Portugal, Slovenia and Spain. These four countries were the most competitive ones in the European ham trade. Besides the general tendency, Austria, Belgium, Denmark and Ireland faced the most significant fall. However, the vast majority of the European Union members lacked competitiveness in the ham trade. Slovenia was the only New Member State having a compara-tive advantage, though significantly decreasing, in the period analysed. Figure 3 also suggests that there is Table 3. TOP 5 ham importers in the EU, 1999–2013, percentage
Country 1999–2003 (%) Country 2004–2008 (%) Country 2009–2013 (%)
France 36 France 37 France 26
Germany 14 Germany 15 United Kingdom 22
United Kingdom 10 Belgium 10 Germany 8
Portugal 9 United Kingdom 9 Belgium 8
Belgium 7 Italy 6 Ireland 5
TOP5 total 76 TOP5 total 78 TOP5 total 69
Source: Own composition based on the Eurostat (2015)
–1 –0.8 –0.6 –0.4 –0.2 0 0.2 0.4 0.6 0.8 1
AUSTRIA BELGIUM BULGARIA CROATIA CYPRUS
CZ
ECH REPUBLI
C
DEN
MAR
K
ES
TONIA
FINLAND FRA
N
CE
GERM
ANY
GREECE
HUNGAR
Y
IRELAND
ITALY
LATVI
A
LITHUANIA
LUXEMBOURG
MALT
A
NE
THERLAN
DS
PO
LA
ND
PORTUG
AL
RO
MA
NI
A
SLOVAKIA SLOVENIA
SPAIN
SWE
DEN
UNITED KINGDOM
1999–2003 2004–2008 2009–2013
Figure 3. Revealed comparative advantage of the European ham trade by the RSCA index, 1999–2013
no clear relationship between the trade balance and competitiveness. France as the biggest ham importer had the revealed comparative advantage in the ham trade between 1999 and 2008, but the Portuguese and Belgian cases are also similar.
Similar conclusions can be drawn if analysing the changing distribution of the RSCA index over time. Table 4 presents the summary statistics – the mean and standard deviation – for the RSCA indices by year, as well as the proportion of indices above and below zero. It is clear that the revealed compara-tive advantage has weakened in the period analysed, with the mean RSCA falling from –0.13 in 1999 to –0.41 in 2013. The share of RSCA < 0 indicates that a majority of countries had a revealed comparative disadvantage over the entire period, and that this majority was larger in the post-2004 accession pe-riod. Standard deviations of the RSCA indices over the whole sample are quite high, suggesting variation from year to year, and they seem to remain relatively stable over the entire period.
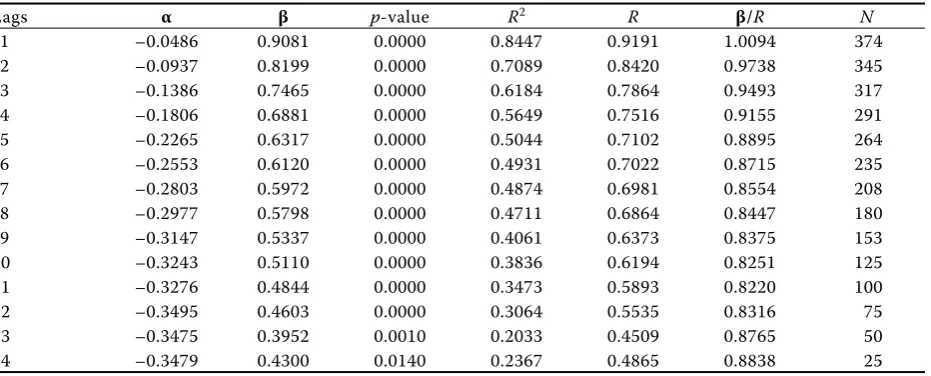
Our stability tests confirm the results above. By using our dataset to estimate various lags for Equation 3, the resulting β values show that trade patterns
[image:7.595.63.532.113.187.2]have significantly changed in the period analysed (Table 5).
By running the model with a single lag, the value of β was relatively high but increasing the number of time lags measurably decreases β values. The β values indicate that the pattern of the revealed comparative advantage has converged, or in other words, low B values increased over time while high values decreased, resulting in de-specialisation of the European ham trade after accession. These results are also underpinned by the β/R values, as suggested by Dalum et al. (1998).
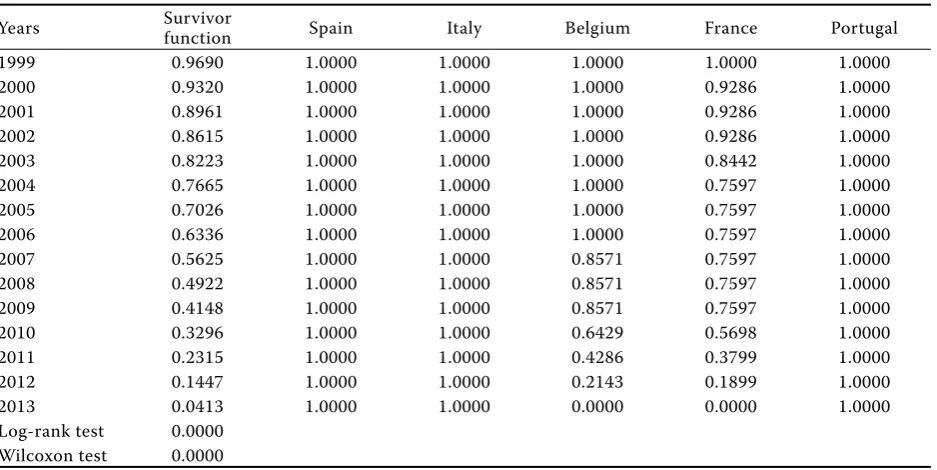
In further analysing the changes of the revealed comparative advantage in the European ham trade, its duration was estimated by the using the non-parametric Kaplan-Meier product limit estimator. As described in the methodology section, Equation 3 was run on our panel dataset and results confirm that the survival times of the revealed comparative advantage in the European ham trade are not persistent over the period analysed in general (Table 6). Survival chances of 97% at the start of the period fell to 4% by 2013, suggesting that a fierce competition is existent in the European ham trade.
Table 4. The distribution of the RSCA index by year
1999 2000 2001 2002 2003 2004 2005 2006 2007 2008 2009 2010 2011 2012 2013 Mean –0.13 –0.22 –0.24 –0.19 –0.20 –0.34 –0.44 –0.53 –0.52 –0.49 –0.50 –0.46 –0.51 –0.45 –0.41 Standard
Deviation 0.72 0.73 0.74 0.80 0.70 0.67 0.65 0.62 0.60 0.61 0.58 0.59 0.53 0.62 0.65 RSCA < 0 0.52 0.60 0.56 0.52 0.56 0.68 0.75 0.79 0.81 0.75 0.79 0.82 0.89 0.75 0.71 RSCA > 0 0.48 0.40 0.44 0.48 0.44 0.32 0.25 0.21 0.19 0.25 0.21 0.18 0.11 0.25 0.29
[image:7.595.68.534.554.742.2]Source: Own calculations based on the Eurostat (2015)
Table 5. Stability of the RSCA index between 1999 and 2013
Lags α β p-value R2 R β/R N
1 –0.0486 0.9081 0.0000 0.8447 0.9191 1.0094 374
2 –0.0937 0.8199 0.0000 0.7089 0.8420 0.9738 345
3 –0.1386 0.7465 0.0000 0.6184 0.7864 0.9493 317
4 –0.1806 0.6881 0.0000 0.5649 0.7516 0.9155 291
5 –0.2265 0.6317 0.0000 0.5044 0.7102 0.8895 264
6 –0.2553 0.6120 0.0000 0.4931 0.7022 0.8715 235
7 –0.2803 0.5972 0.0000 0.4874 0.6981 0.8554 208
8 –0.2977 0.5798 0.0000 0.4711 0.6864 0.8447 180
9 –0.3147 0.5337 0.0000 0.4061 0.6373 0.8375 153
10 –0.3243 0.5110 0.0000 0.3836 0.6194 0.8251 125
11 –0.3276 0.4844 0.0000 0.3473 0.5893 0.8220 100
12 –0.3495 0.4603 0.0000 0.3064 0.5535 0.8316 75
13 –0.3475 0.3952 0.0010 0.2033 0.4509 0.8765 50
14 –0.3479 0.4300 0.0140 0.2367 0.4865 0.8838 25
Reasons behind the loss of comparative advantages are numerous. First, high competitive pressures ex-ist in the European ham industry with many players producing high quality meat products. Second, the economic and food crisis of 2008 and 2011 also had an impact. The demand for expensive meat prod-ucts definitely decreased together with the global trend. Moreover, the growth of the global cereal prices increased input costs for the European meat producers, causing them hard times in maintaining their competitiveness. Third, after the 2004 EU en-largement, several new players entered the common market, some of which had long traditions in quality ham producing (e.g. Slovenia), also increasing the competitive pressures.
However, it is also evident that the biggest European ham exporters have maintained their comparative advantages. Italy, Spain and Portugal had stable posi-tions in the period analysed, while competitiveness of Belgian and French ham products deteriorated significantly. The equality of the survival functions across the product groups can be checked using two non-parametric tests (Wilcoxon and log-rank). Results show that the hypothesis of equality can be rejected at the 1% level of significance, meaning that similarities across product groups in the duration of comparative advantage are absent (Table 6). In general, our results are in line with the majority of
literature in the field. The considerable loss of the comparative advantage is evident in several papers (see e.g. Fertő 2008; Qineti et al. 2009; Jámbor 2013).
Determinants of comparative advantages
[image:8.595.65.534.123.358.2]It is evident from the above that competitiveness of countries in the European ham trade differs to a great extent. In line with the aim of our paper, Table 7 presents the results of our model runs on Equation 4. Table 7 suggests that factor endowments, the geographical indication and the EU accession are positively, while the FDI is negatively related to the competitiveness of the European ham trade. As to the factor endowments, we cannot reject our first hypothesis that higher factor endowments of a coun-try leads to higher comparative advantages based on the higher number of resources available. However, Hypothesis 2 is rejected as a negative relationship exists between the FDI and competitiveness. It ap-pears that the foreign investment is not essential for the European ham products to be competitive, which might be explained by the logic of the geographical indication – the traditional and local processing of high quality food products in the national hands. In line with our previous expectations, Hypothesis 3 and 4 cannot be rejected, meaning that the geographical Table 6. Kaplan-Meier survival rates for the RSCA index and tests for equality of survival functions in the Euro-pean ham trade with the EU by TOP5 exporters, 1999–2013
Years Survivor
function Spain Italy Belgium France Portugal
1999 0.9690 1.0000 1.0000 1.0000 1.0000 1.0000
2000 0.9320 1.0000 1.0000 1.0000 0.9286 1.0000
2001 0.8961 1.0000 1.0000 1.0000 0.9286 1.0000
2002 0.8615 1.0000 1.0000 1.0000 0.9286 1.0000
2003 0.8223 1.0000 1.0000 1.0000 0.8442 1.0000
2004 0.7665 1.0000 1.0000 1.0000 0.7597 1.0000
2005 0.7026 1.0000 1.0000 1.0000 0.7597 1.0000
2006 0.6336 1.0000 1.0000 1.0000 0.7597 1.0000
2007 0.5625 1.0000 1.0000 0.8571 0.7597 1.0000
2008 0.4922 1.0000 1.0000 0.8571 0.7597 1.0000
2009 0.4148 1.0000 1.0000 0.8571 0.7597 1.0000
2010 0.3296 1.0000 1.0000 0.6429 0.5698 1.0000
2011 0.2315 1.0000 1.0000 0.4286 0.3799 1.0000
2012 0.1447 1.0000 1.0000 0.2143 0.1899 1.0000
2013 0.0413 1.0000 1.0000 0.0000 0.0000 1.0000
Log-rank test 0.0000 Wilcoxon test 0.0000
indication and the EU membership highly determine the competitiveness of the European ham products. Our variables are statistically significant at all levels, except for the EU dummy, and the model has a quite high R2, meaning that our variables explain almost 50% of the total variance.
CONCLUSIONS
The paper analysed the European ham market, giving a special attention to the factors influencing the competitiveness of the industry. The paper has
reached many conclusions. First, by analysing the most important characteristics of the European ham production, it became clear that the vast majority of the ham products was sold within the European Union, and some dominant players were ruling both the supply (Italy and Spain) and the demand (France, Germany and the United Kingdom) side, indicating that the ham industry is highly concentrated in the EU. Second, it was evident that only four member states could be competitive in the European ham market (Portugal, Spain and Italy and Slovenia), but it was only Portugal who could increase its competitiveness in the period analysed. The results also suggest that the competitiveness based on the RSCA indices has worsened in the majority of the cases between 1999 and 2013.
[image:9.595.66.533.620.763.2]Regarding the factors influencing the competitive-ness of the European ham trade, the paper identified four major factors. It appears that the factor endow-ments, the geographical indication and the EU acces-sion are positively, while the FDI is negatively related to the competitiveness of the European ham trade. These outcomes are in line with the initial expecta-tions except for the FDI, underlining the importance of the local (national) players in this high quality-based market segment. Research in the future might check for other variables and sectors to extend these results and make them more valid.
Table 7. Determinants of the European ham trade com-petitiveness
Variables RSCA
lnGDPPC 0.1240 (0.0000)
lnFDI –0.0011 (0.0000)
GI 0.9111 (0.0000)
EU 0.0041 (0.9370)
Constant –1.8351 (0.0000)
Observations 402
R-squared 0.4567
Number of countries 28
Standard errors in parentheses: ***p < 0.01, ** p < 0.05, *p < 0.1
Source: Own calculations based on the Eurostat (2015)
APPENDIX
1. Ham product categories of CN8
CN8 code Product category
2101111 DOMESTIC SWINE HAMS AND CUTS THEREOF, SALTED OR IN BRINE, WITH BONE IN 2101131 DOMESTIC SWINE HAMS AND CUTS THEREOF, DRIED OR SMOKED, WITH BONE IN
Source: Eurostat (2015)
2. European hams with geographical indications
Designation Country
Jambon d’Ardenne Belgium
Jambon de Vendée France
Jambon sec de Corse/Jambon sec de Corse – Prisuttu France
Jambon de l’Ardèche France
Jambon sec et noix de jambon sec des Ardennes France
Jambon de Bayonne France
Salaisons fumées, marque nationale grand-duché de Luxembourg Luxembourg
Westfälischer Knochenschinken Germany
Holsteiner Katenschinken/Holsteiner Schinken/ Holsteiner Katenrauchschinken/ Holsteiner Knochenschinken
REFERENCES
Balassa B. (1965): Trade Liberalization and Revealed Com-parative Advantage. The Manchester School, 33: 99–123. Beck N., Katz N. (1995): What to do (and not to do) with
time-series cross-section data. American Political Sci-ence Review, 89: 634–647.
Beck N., Katz N. (1996): Nuisance vs. substance: specify-ing and estimatspecify-ing time-series-cross-section models. Political Analysis, 6: 1–36.
Bojnec Š., Fertő I. (2008a): Degree and pattern of agro-food trade integration of South-Eastern European countries with the European Union. In: Glauben T., Hanf J.H., Kopsidis M., Pieniadz A., Reinsberg K. (eds.): Agri-Food Business: Global Challenges – Innovative Solutions.
Studies on the Agricultural and Food Sector. Leibniz Institute of Agricultural Development in Central and Eastern Europe, Halle (Saale), 46: 118–133.
Bojnec Š., Fertő I. (2008b): European enlargement and agro-food trade.Canadian Journal of Agricultural Eco-nomics, 56: 563–579.
Bojnec Š., Fertő I. (2009): Determinants of agro-food trade competition of Central European countries with the European Union. China Economic Review, 20: 327–337. Bojnec Š., Fertő I. (2012): Complementarities of trade ad-vantage and trade competitiveness measures. Applied Economics, 44: 399–408.
Bojnec Š., Fertő I. (2014): Agri-Food Export Competi-tiveness in European Union Countries. Journal of Common Market Studies, 53: 476–492.
Designation Country
Schwarzwälder Schinken Germany
Ammerländer Schinken ; Ammerländer Knochenschinken Germany
Ammerländer Dielenrauchschinken ; Ammerländer Katenschinken Germany
Prosciutto Amatriciano Italy
Porchetta di Ariccia Italy
Prosciutto di Sauris Italy
Crudo di Cuneo Italy
Prosciutto di Parma Italy
Prosciutto di Norcia Italy
Prosciutto Toscano Italy
Valle d’Aosta Jambon de Bosses Italy
Prosciutto di Carpegna Italy
Pancetta Piacentina Italy
Prosciutto di S. Daniele Italy
Prosciutto di Modena Italy
Prosciutto Veneto Berico-Euganeo Italy
Presunto do Alentejo; Paleta do Alentejo Portugal
Presunto de Camp Maior e Elvas; Paleta de Campo Maior e Elvas Portugal
Presunto de Santana da Serra; Paleta de Santana da Serra Portugal
Presunto de Vinhais / Presunto Bísaro de Vinhais Portugal
Presunto de Barroso Portugal
Presunto de Barrancos Portugal
Jamón de Serón Spain
Los Pedroches Spain
Jamón de Trevélez Spain
Lacón Gallego Spain
Jamón de Huelva Spain
Dehesa de Extremadura Spain
Guijuelo Spain
Jamón de Teruel/Paleta de Teruel Spain
Cecina de León Spain
Prekmurska Šunka Slovenia
Kraški pršut Slovenia
Prleška tünka Slovenia
Couillard C., Turkina E. (2014): Trade liberalisation: the effects of free trade agreements on the competitiveness of the dairy sector. The World Economy, 38: 1015–1033; DOI: 10.1111/twec.12181
Dalum B., Laursen K., Villumsen G. (1998): Structural change in OECD export specialisation patterns: De-specialisation and ‘stickiness’. International Review of Applied Economics, 12: 423–443; DOI:
10.1080/02692179800000017
Falvey R.E., Kierzkowski H. (1987): Product Quality, Intra-Indystry Trade and Imperfect Competition. In: Kierz-kowski H.: Protection and Competition in International Trade: Essays in Honour of W.M. Corden. Oxford. Fertő I. (2008): The evolution of agri-food trade patterns
in Central European countries.Post-Communist Econo-mies, 20: 1–10; DOI: 10.1080/14631370701865680 Fertő I., Jámbor A. (2015): Drivers of vertical
intra-indus-try trade: the case of the Hungarian agri-food sector. Agricultural Economics, 46: 113–123; DOI: 10.1111/ agec.12144
Fertő I., Hubbard L .J. (2003): Revealed comparative advantage and competitiveness in Hungarian agri– food sectors . The World Economy, 46: 247–259; DOI: 10.1111/1467-9701.00520
Fertő I., Soós A.K. (2009): Treating trade statistics inaccura-cies: the case of intra-industry trade. Applied Economics Letters, 16: 1861–1866.
Jámbor A. (2013): Comparative advantages and speciali-sation of the Visegrad countries agri-food trade. Acta Oeconomica et Informatica, 16: 22–34.
Jámbor, A. (2014): Country-specific determinants of hori-zontal and vertical intra-industry agri-food trade: the case of the EU New Member States. Journal of Agri-cultural Economics, 61: 663–682; DOI: 10.1111/1477-9552.12059
Leitao N.C. (2012): GMM estimator: An application to Intra-industry trade. Journal of Applied Mathematics, Article ID 857824: 1–12.
Qineti A., Rajcaniova M., Matejkova E. (2009): The com-petitiveness and comparative advantage of the Slovak and the EU agri-food trade with Russia and Ukraine. Agricultural Economics – Czech, 55: 375–383. Sahinli M.A. (2013): Comparative advantage of agriculture
sector between Turkey and European Union. African Journal of Agricultural Research, no. 10: 884–895; DOI: 10.5897/AJAR12.2001.
Serin V., Civan A. (2008): Revealed comparative advantage and competitiveness: a case study for Turkey towards the EU. Journal of Economic and Social Research, 10: 25–41. Török, Á., Jámbor A. (2013): Agri-food trade of the New
Member States since EU accession. Agricultural Eco-nomics – Czech, 59: 101–112.
Vollrath T.L. (1991): A theoretical evaluation of alterna-tive trade intensity measures of revealed comparaalterna-tive advantage.Weltwirtschaftliches Archiv, 130: 265–279.
Received: 10th June 2015 Accepted: 21th July 2015 Published on-line: 5th September 2016
Contact address: