Since L������ (1982) succeeded to produce hap-loids of Brassica napus from microspores, doubled haploids (DH) have increasingly been used in oilseed rape breeding. There are advantages and also disadvantages of DH lines. Homozygosity is reached within one generation. This saves to the breeder about 4 years of pedigree selection and simplifies cultivar maintenance. DH lines are often surprisingly vigorous since there is strong selection against recessive lethal and subvital alleles in the haploid phase (K������ et al. 1985). The meiotic crossovers during the heterozygous generations of pedigree-derived (PD) lines do not occur in DH lines. Recombinations between linked loci are therefore less frequent in DH lines than in PD lines and genetic variation among DH lines is thus smaller than among unselected PD lines. Genetic gain from selection in heterozygous generations of PD lines is impossible in DH lines. The production
of sufficiently large DH populations was reported nearly twice more costly than those of PD lines (F����� 1994). But continuous improvements of methods reduce the costs.
The production of DH lines from microspore cultures is routinely used in many Brassica napus line and hybrid breeding programmes (S������� et al. 1999). Attempts were made to fix hybrid performance in DH lines and to circumvent the problems with hybrid seed production in this way (M���������� et al. 2001). In the Czech official cul-tivar trials foreign DH lines of winter oilseed rape were often highly competitive in comparison with other cultivars, even hybrids. However, there are also doubts concerning the effectiveness of DH tech-nology in practical breeding (N����������-S������ 1997). D���� et al. (1998) noted strong inbreeding depression of seed yield in some Brassica rapa DH lines. In an earlier paper (K����� et al. 1996) high
Supported by the Ministry of Agriculture of the Czech Republic, Project No. QE0052.
Agronomic Performance of Doubled Haploid Lines
and Pedigree-Derived Lines of Winter Oilseed Rape
V�������� KUČERA1, E��� SCHWARZBACH2, M������� KLÍMA1 and M�������� VYVADILOVÁ1
1Department of Applied Genetics, Research Institute of Crop Production, Prague-Ruzyně,
Czech Republic, 2Miroslav, Czech Republic
Abstract:In four not overlapping sets of cultivars, including doubled haploid (DH) lines and pedigree derived (PD) lines of winter oilseed rape, both types of lines were compared in basic agronomic traits. The tested lines originated from breeding programmes of different breeders. Each set of cultivars was tested in a different year from 2001 to 2004 in multi-location trials with four replicates. There was no consistency in yield superiority of DH or PD lines and in all four sets the differences between the means of DH and PD groups were insignificant. On average, the differences between the groups of DH and PD lines were negligible in all evaluated agronomic traits. The statistical analyses of yield performance however revealed a very low predictive value of the multi-location trials. It can be concluded that with the given selection techniques and the actual system of cultivar trials nearly random samples of possible DH and PD lines were obtained in which no superiority of DH or PD lines in the evaluated agronomic traits could be detected.
variability, especially in glucosinolate content, was found among DH lines derived from one donor plant of oilseed rape.
In the Czech Republic breeders lines are tradition-ally tested in breeders joint multi-location trials (JML-trials) before entering official trials. Every year a different, not overlapping set of lines from different breeding programmes and breeders is tested in the JML-trials. Since the trials include both DH and PD lines, the JML-trials offer a possibility to compare the performance of DH and PD lines produced in practical breeding. In the present study we used data of the Czech JML winter oilseed rape trials from 2001 to 2004 for this purpose.
MATERIAL AND METHODS
The tested winter oilseed rape lines were selected in practical breeding programmes of the Research Institute of Oilseed Crops Opava of OSEVA PRO s. r. o., of SEMPRA a. s. and of SELGEN a. s. The lines originated from various parent combinations, mostly not disclosed by the breeders, and were preselected for agronomic performance and disease resistance at the particular breeding sites and in on-station trials. The DH plants were produced for the breeders in the Research Institute of Crop Production Prague from microspore cultures, as described by V��������� and Z�������� (1992). The tested entries, summarised as “cultivars”, included each year from two to four cultivars registered in the National Cultivar List. In total 27 DH lines, 93 PD lines and 9 registered cultivars were tested in the JML-trials from 2001 to 2004. On average 35 entries were tested each year.
Each trial consisted of four complete randomised blocks with 10 m2 plots. The trial locations were in the regions of Opava, Kujavy, Chlumec n. C., Humpolec, Slapy u Tábora and Šumperk. Each year the same set of cultivars was tested at all locations. After one year in JML-trials the breeding lines ei-ther proceeded to official trials or were discarded. Seed yield of individual plots was corrected to 12% moisture content. Resistance to Phoma lingam, Sclerotinia sclerotiorum and Alternaria brassicae and lodging resistance were scored using a 1–9 scale, with 9 indicating the most favourable score. The thousand seed weight (TSW) was usually deter-mined from two 500-seed samples. The specified year is always the harvest year.
Statistical procedures. A complete statistical
analysis could be performed only for yield data
since other agronomic traits were evaluated only in some trials and often just in one of the four rep-licates. Therefore only cultivar averages over all trials within a year and the variance of the obtained averages were calculated for these traits.
The tested sets of breeding lines changed al-most completely from year to year. Therefore the trial series of each year was statistically evaluated independently. A survey of the tested DH lines and registered cultivars is summarised in Table 2. Within each year a two-stage statistical analysis was performed, as suggested by P�������� (1997) for series of cultivar trials. The two-stage analysis offers a better insight into the behaviour of cultivars and is justified by variance non-homogeneity of the individual trials. Each trial was first analysed individually by ANOVA. Least significant differ-ences (LSD) for pairwise comparisons were de-rived from the residual variance. The local cultivar means of each year were assembled in a summary table classified by locations and cultivars. In the second stage the summary tables were analysed separately using ANOVA. The trial at Šumperk in 2004 was excluded from evaluation because of bad differentiation and missing correlation with the other trials. To visualise the combined analysis, the local means of DH-lines and the local averages of PD lines were converted to percentages of the local trial mean and presented in charts. Since the aim of the paper was to compare DH lines and PD lines, the simultaneously tested registered cultivars are not included in the charts. Genetic variance was estimated from the variance of averages of all tested cultivars in a trial or year, after subtraction of residual variance, divided by replicates or sites, respectively.
RESULTS AND DISCUSSION
The performance of DH lines at different loca-tions and the means of PD lines, relative to the local trial means, are summarised in the four charts in Table 1.
Correlations (34 cultivars):
Chlumec Humpolec Kujavy
Slapy 0.47** 0.32* 0.37*
Chlumec 0.64** 0.22
Humpolec 0.39*
Correlations (32 cultivars):
Humpolec Chlumec Kujavy Slapy
Šumperk 0.34* 0.25 0.28 0.20
Humpolec 0.22 0.35* 0.58**
Chlumec 0.43** 0.41**
Kujavy 0.23
Yi
el
d
re
la
tiv
e
to
tr
ia
l m
ea
n
(%
)
α = 0.05 Yi
el
d
re
la
tiv
e
to
tr
ia
l m
ea
n
(%
)
α = 0.05
Yi
el
d
re
la
tiv
e
to
tr
ia
l m
ea
n
(%
)
α = 0.05
Yi
el
d
re
la
tiv
e
to
tr
ia
l m
ea
n
(%
)
α = 0.05
Correlations (35 cultivars):
Chlumec Humpolec Kujavy
Slapy 0.02 0.24 0.38*
Šumperk 0.09 0.41**
Chlumec 0.38**
Correlations (38 cultivars):
Humpolec Chlumec Kujavy Slapy Šumperk 0.48** 0.41** 0.49** 0.51**
Humpolec 0.29* 0.50** 0.46**
Chlumec 0.33* 0.41**
[image:3.595.65.534.113.715.2]Kujavy 0.38**
Table 1. Relative performance of DH lines and PD lines during four years of JML trials and correlations between trials within the same year
trials express just the interactions of cultivars with the unique and unrepeatable local combination of soil conditions, climate, disease situation and
2001 2002 2003 2004 0.20
0.15
0.10
0.05
0.00
Va
ri
an
ce
e
st
im
at
e
(t/
ha
)
2
[image:4.595.64.379.81.277.2]□ genetic ■residual
Figure 2. Genetic and residual variance in series of trials
2001 2002 2003 2004
0.20
0.15
0.10
0.05
0.00
Va
ri
an
ce
e
st
im
at
e
(t/
ha
)
2
□ genetic ■residual Figure 1. Average genetic and residual variance within trials
by the approx. twice higher residual than genetic variance in the analyses of trial series.
Table 2 shows average yields of the tested DH lines, relative to the general mean of the corre-sponding series. To enable pairwise comparisons of cultivar means, they are presented together with the interval of ± half theLSD, calculated from the residual variance within the given series. Therefore, two means can be regarded as significantly differ-ent in the given year if the indicated intervals do not overlap. For the comparison with PD lines the average performance of PD lines and of registered cultivars is also included. For easier comparison the DH lines and the line group means are ranked in each year.
The LSD calculated from trial series within one year are valid for the mentioned reasons just for the given year since in Central Europe the climate
[image:4.595.65.387.568.759.2]Table 2. Relative yield* and intervals of ± LSD/2 of tested DH lines, registered cultivars and groups of DH and PD cultivars
Tested cultivars 2001 2002 2003 2004
OP 1011 DH 101.2 ± 4.7
OP 1014 DH 100.9 ± 4.7
Mean of 27 PD-lines 99.8 ± 0.9
OP 482 DH 99.3 ± 4.7
Mean of 5 DH-lines 98.9 ± 2.1
OP 1018 DH 98.5 ± 4.7
OP 1021 DH 94.5 ± 4.7
SL 617 DH 107.4 ± 5.4 108.0 ± 3.6
SL 620 DH 107.0 ± 5.4 107.2 ± 7.8
OP 4646 DH 105.8 ± 5.4
SL 618 DH 102.7 ± 5.4
SL 614 DH 102.2 ± 5.4
Mean of 8 DH-lines 101.8 ± 1.9
SL 619 DH 101.6 ± 5.4
Mean of 21 PD-lines 99.5 ± 1.2
SL 615 DH 96.8 ± 5.4
SL 616 DH 90.3 ± 5.4
SL 631 DH 108.5 ± 7.8
SL 627 DH 104.7 ± 7.8
SL 626 DH 101.8 ± 7.8
Mean of 8 DH-lines 101.8 ± 2.6
SL 630 DH 101.5 ± 7.8
SL 632 DH 101.0 ± 7.8
SL 629 DH 99.5 ± 7.8
SL 633 DH 99.1 ± 7.8
SL 628 DH 98.7 ± 7.8
Mean of 23 PD-lines 98.4 ± 1.6
SL 638 DH 109.3 ± 3.6
SL 634 DH 103.8 ± 3.6
OP-4363/03 DH 102.2 ± 3.6
SL 639 DH 101.4 ± 3.6
Mean of 27 PD-lines 99.9 ± 0.7
Mean of 7 DH-lines 98.5 ± 1.4
OP-4364/03 DH 95.3 ± 3.6
SL 636 DH 89.9 ± 3.6
SL 635 DH 87.6 ± 3.6
Aviso 106.9 ± 7.8
Catonic 96.0 ± 3.6
Laser 95.7 ± 7.8 100.8 ± 3.6
Navajo 96.4 ± 5.4 111.3 ± 7.8 104.9 ± 3.6
Odila 98.7 ± 4.7
Orkan 91.5 ± 5.4
Rasmus 111.9 ± 4.7 108.7 ± 5.4 101.5 ± 7.8 104.5 ± 3.6
trait with low heritability is almost the same or worse than without selection, see Figure 1.8 in F�������� (1985). This justifies the comparison of DH and PD lines although they do not proceed from the same crosses.
The comparison of group means of DH lines and PD lines in Table 2 reveals no consistency in ranking and no significant difference between the group means in all four years. It can therefore be concluded that there is no statistical indication of superiority of DH or PD lines in yield over each other.
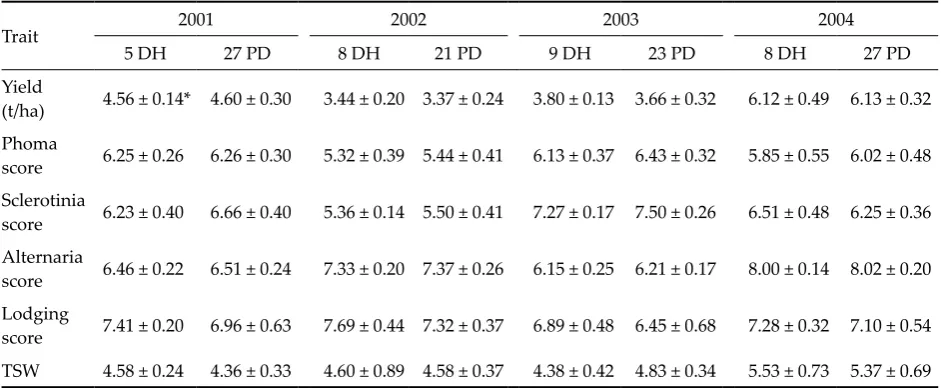
Since the quality of data of the other agronomic traits did not permit a comprehensive statistical analysis, just the average values of the evaluated traits in the groups of DH and PD lines were calcu-lated. The averages are summarised in Table 3. To provide information about the variability among the lines, the standard deviations of cultivar averages within the groups are also included in Table 3.
In the table there is no indication of superiority of either DH or PD lines in any of the traits. Each year the distributions of DH and PD lines largely overlap in all traits and also the variation range within both groups of lines is very similar in all the traits.
References
D���� D.B., R���� G., D����� R.K. (1998): Growth and yield of doubled haploid lines of oilseed Brassica
rapa. Can. J. Plant Sci., 78: 537–544.
F�������� G. (1985): Fortpflanzungsbiologie und all-gemeine Zu�tmethodik. In: H������� W., M���� A., P����� W.: Lehrbuch der Züchtung landwirt-s�a�li�er Kulturpflanzen. 2nd. ed., P. Parey, Berlin & Hamburg.
F����� M. (1994): Use of biotechnology in breeding new varieties of winter oilseed rape in Germany. Bull. GCIRC, 10: 16–29.
K������ H., K����� G., W����� G. (1985): Grundzüge der Pflanzenzü�tung. Walter de Gruyter & Co., Berlin and N. York.
K����� V., V��������� M., T�������� D., H���� J. (1996): Segregation of specific traits in doubled hap-loid regenerants of winter oilseed rape. Czech J. Genet. Plant Breed., 32: 241–248.
L������ R (1982): Induction of haploid plants from isolated pollen of Brassica napus. Z. Pfl.-Physiol, 105: 427–434.
M���������� M., S������� I., B������ P., B�������� A. (2001): Heterosis in crop mutant crosses and produc-tion of high yielding lines using doubled haploid systems. Euphytica, 120: 387–398.
N����������-S������ K. (1997): Excessive homozygosity in doubled haploids – advantages and disadvantages for plant breeding and fundamental research. Acta Physiol., 19: 155–167.
P�������� H.D. (1997): Analysis of series of variety trials. In: K������ R.A., F�� P.N. (eds): Statistical methods for plant variety trials. Chapman and Hall, London.
R����� I., K��� L.S., B��������� W.D., K���� K.J. (1997): Performance of doubled haploid popula-Table 3. Average values and standard deviations of agronomic traits of DH and PD lines
Trait 2001 2002 2003 2004
5 DH 27 PD 8 DH 21 PD 9 DH 23 PD 8 DH 27 PD
Yield
(t/ha) 4.56 ± 0.14* 4.60 ± 0.30 3.44 ± 0.20 3.37 ± 0.24 3.80 ± 0.13 3.66 ± 0.32 6.12 ± 0.49 6.13 ± 0.32 Phoma
score 6.25 ± 0.26 6.26 ± 0.30 5.32 ± 0.39 5.44 ± 0.41 6.13 ± 0.37 6.43 ± 0.32 5.85 ± 0.55 6.02 ± 0.48 Sclerotinia
score 6.23 ± 0.40 6.66 ± 0.40 5.36 ± 0.14 5.50 ± 0.41 7.27 ± 0.17 7.50 ± 0.26 6.51 ± 0.48 6.25 ± 0.36 Alternaria
score 6.46 ± 0.22 6.51 ± 0.24 7.33 ± 0.20 7.37 ± 0.26 6.15 ± 0.25 6.21 ± 0.17 8.00 ± 0.14 8.02 ± 0.20 Lodging
score 7.41 ± 0.20 6.96 ± 0.63 7.69 ± 0.44 7.32 ± 0.37 6.89 ± 0.48 6.45 ± 0.68 7.28 ± 0.32 7.10 ± 0.54 TSW 4.58 ± 0.24 4.36 ± 0.33 4.60 ± 0.89 4.58 ± 0.37 4.38 ± 0.42 4.83 ± 0.34 5.53 ± 0.73 5.37 ± 0.69
[image:6.595.63.534.103.297.2]Abstrakt
K����� V., S���������� E., K���� M., V��������� M. (2004): Srovnání výkonnosti dihaploidních linií a konvenčně vyšlechtěných linií řepky ozimé. Czech J. Genet. Plant Breed., 40: 127–133.
Základní agronomické znaky dihaploidních (DH) a konvenčně šlechtěných (PD) linií řepky ozimé byly srovná-vány ve čtyřech nepřekrývajících se souborech. Zkoušené linie pocházely ze šlechtitelských programů různých šlechtitelů. Každý soubor linií byl zkoušen v jiném roce letech 2001–2004 v pokusech na několika lokalitách ve čtyřech opakováních ve znáhodněných blocích. Ve výnosu semen byly mezi průměry skupin DH a PD linií jen velmi malé neprůkazné rozdíly. Rozdíly mezi skupinami DH a PD linií byly zanedbatelné i ve všech ostatních hodnocených agronomických znacích. Statistická analýza výnosu však odhalila velmi nízkou vypovídací schopnost jednoletých pokusů na více lokalitách. Závěrem lze konstatovat, že s použitím současných výběrových metod v praktickém šlechtění a současným systémem odrůdových pokusů byly získány téměř náhodné vzorky z DH a PD linií, které se v hodnocených znacích významně nelišily.
Klíčová slova:řepka ozimá; dihaploidy; výnos semen; odolnost k chorobám
Corresponding author:
RNDr. E��� S����������, Dr. agr. habil., Václavov 23, 671 72 Miroslav, Česká republika tel.: + 420 515 333 878, e-mail: eschwarzbach@iol.cz
tions segregating for linolenic acid levels in spring rapeseed. Crop Sci., 37: 1438–1442.
S������� G.R., D��������� D.F., T���������� M.R., B����� V.K. (1999): Q2 summer rape. Can. J. Plant Sci., 79: 597–598.
V��������� M., Z�������� S. (1992): Responsiveness in microspore cultures of some cultivars and Czech breeding materials of rapeseed (Brassica napus L.). Czech J. Genet. Plant Breed., 28: 243–252.