The rhizosphere, defined as the layer of soil in-fluenced by root metabolism (Berg et al. 2005), is greatly important to plant health and soil fertility. Root exudates are currently recognized to differ according to plant species (Rengel 2002). Bacteria respond differently to the compounds released by roots, and thus the differences in root exudation are believed to explain the plant-specific bacte-rial communities in the rhizosphere (Jaeger et al. 1999, Berg et al. 2005).
Aluminum (Al) toxicity is recognized as a major limiting factor for plant productivity in acid soils (Kochian 1995). However, Al toxicity can be al-leviated by chelation with organic acids (Ma et al. 2001), which indicates that root organic acid exudation is a major mechanism of Al tolerance in plants.
Soybean is considered as a kind of highly ef-ficient nitrogen-fixing crop for improving acidic soil fertility. In this study, we hypothesize that (1) two soybean genotypes, BX10 (Al-tolerant) and BD2 (Al-sensitive), exhibit distinct rhizosphere
microbial communities, and (2) different bacterial populations contributed to the patterns of substrate use in any given well of Biolog plates. The aim of this study is to assess the relation of rhizosphere bacteria and organic acids in acid soil, the use of C substrates in different rhizosphere soils and the corresponding genetic structure of the microbial community in these Biolog plates.
MATERIAL AND METHODS
Plant materials and rhizosphere soil sampling. Two genotypes of soybean [Glycine max (L.) Merr], BaXi10 (BX10, tolerant) and BenDi2 (BD2, Al-sensitive) (Dong et al. 2004), were used in this study. Soils [pH 4.43, exchangeable Al (H+) 1.45 cmol/kg] were collected in the Jiangxi province, China (Yang et al. 2012).
The rhizoboxes (Figure 1) used in this study were designed as we previously reported (Yang et al. 2012). The rhizobox without the plantation of soybeans
Rhizosphere bacteria induced by aluminum-tolerant
and aluminum-sensitive soybeans in acid soil
T. Yang, Y. Ding, Y. Zhu, Y. Li, X. Wang, R. Yang, G. Lu, J. Qi, Y. Yang
State Key Laboratory of Pharmaceutical Biotechnology, School of Life Sciences,
Nanjing University, Nanjing, P.R. China
ABSTRACT
Rhizosphere microbial communities play a major role in multiple soil functions. The aim of this study is to assess the relation of bacteria and organic acids in rhizosphere soil and community function induced by soybean geno-types, BX10 [aluminum (Al)-tolerant soybean] and BD2 (Al-sensitive soybean). Organic acid analysis in the rhizo-sphere soil indicates that BX10 increased the concentration of citric acid, whereas BD2 decreased it; malic acid was only found in the rhizosphere soil of BX10. Redundancy analysis results also showed that the two soybean geno-types induced distinct rhizosphere microbial communities, and citric acid and malic acid had a significantly posi-tive correlation with rhizosphere bacteria of BX10. The community level physiological profiling showed that BX10 might have more influence than BD2 on the ability to metabolize organic C substrates. Sequence analysis indicates that two soybeans stimulate some rhizobacteria, such as species of Acinetobacter, Candidatus Amoebinatus, and uncultured proteobacterium. This study revealed that rhizobacteria of two soybeans may be related to their organic acid exudation.
Keywords: Al toxicity; biolog; organic acid
served as the negative control (CK) to observe the environmental effects contributing to the changes in soil microbial community. There were 4 replicates of rhizobox for each treatment. Rhizosphere soils were collected at day 107 (maturity stage) after sowing, partial soils were stored at 4°C no more than 12 h for Biolog analysis, and partial soils were stored at –20°C for DNA extraction.
Determination of organic acids in the rhizos-phere soils. Approximately 2 g of air-dried soil were gently shaken (60 rpm) with 20 mL water [Resistivity 18.2 MΩ cm (25°C)] at room temperature for 16 h under N2 atmosphere. The suspensions were cen-trifuged at 5000 g and 10°C for 30 min (Nardi et al. 2002). The sample pretreatment and determination of organic acids was already reported by Yang et al. (2012). The organic acids were detected at 220 nm by an ultraviolet detector (G1314B, limits of determina-tion 10–7 g/L), and the recovery is 96%. The organic acids were calibrated using standards.
Community level physiological profiles (CLPPs). CLPPs were assessed by Biolog ECO plates (Biolog Inc., Hayward, USA). Dilution of soil bacteria was prepared as previously reported (Campbell et al. 1997). Each well was directly inoculated with 150 μL of the diluted suspensions. The plate was incubated at 28°C in the dark, and optical density (OD590 nm) was measured every 24 h using a microplate reader (SUNRISE-BASIC TECAN, Männedorf, Switzerland). The average well colour development (AWCD) of the Biolog plates was similarly calculated as previously reported (Garland and Mills 1991).
DNA extraction and PCR amplification. DNA in the rhizosphere soil was extracted through the method presented by Zhou et al. (1996). In addition, samples from the Biolog ECO wells were lysed by three cycles of freezing and boiling, and were used as bacterial DNA for PCR amplification (Smalla et al. 1998). The solution samples (Table S1) were pipetted from the Biolog ECO wells at the end of incubation. Bacterial 16S rRNA gene fragments were
PCR-amplified using GC-338f and 518r (Ovreas et al. 1997).
Denaturing gradient gel electrophoresis (DGGE). DGGE was performed with the instrument DGGE-2001 (C.B.S. Scientific Co., Inc., California, USA). A 20 μL aliquot of the PCR products was loaded into 7% (w/v) acrylamide gel containing a linear chemical gradient ranging from 45–65% denaturant. The gels were run for 4.5 h at 200 V. After electrophoresis, the gels were soaked in GelRed solution (GelRedTM Nucleic Acid Gel Stain, Hayward, USA) for 30 min and photographed with a Jieda MultiImager (Jieda, Beijing, China). The different DGGE bands were excised and reamplified for sequencing with a 338f/518r primer pair.
Statistical analysis. Digitized DGGE images were analyzed with Quantity One software (Smalla et al. 2001). Dice similarity matrix was constructed for all lanes, and Redundancy analysis (RDA) was performed using the Canoco software, version 4.5 (Smalla et al. 2001).
[image:2.595.67.358.55.213.2]Sequencing and phylogenetic analysis. The partial 16S rRNA gene sequences of the bacterial isolates were aligned and phylogenetic tree was obtained using the MEGA 4. The nucleotide sequences identified in this study were deposited in the GenBank database under accession numbers, GU227598-GU227611, GU227430-GU227545.
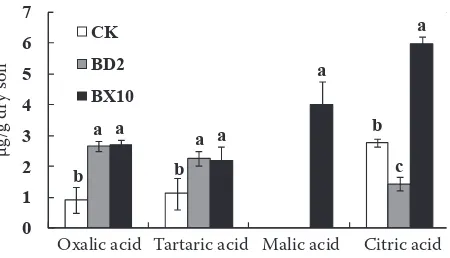
Figure 2. Organic acid contents of the soils of CK (nega-tive control, without plantation of soybean), BX10, and BD2. Values are means ± SE of four replicates
Oxalic acid Tartaric acid Malic acid Citric acid
b b
b
a a
c
a a
a
a
0 1 2 3 4 5 6 7
oxalic acid tartaric acid malic acid citric acid
µg
g
-1dr
y s
oi
l
CK BD2 BX10
μg/g dr
y s
[image:2.595.308.533.587.716.2]oil
Figure 1. Diagram of the rhizobox (a) and the rhizobox for soybean cultiva-tion (b). The arrows refer to the sam-pling location of the rhizosphere soil
(a) 20 cm (b)
20 c
m
10 cm
15 cm
RESULTS
Accumulation of organic acid in the rhizos-phere soil. The organic acid contents in the rhizo-sphere soils are shown in Figure 2. These results showed that the genotypes had a significant effect on the concentration of organic acids in soils. Oxalic, tartaric, and citric acids were present in the control soil. Plantation of soybeans increased the concentration of oxalic and tartaric acids, but there were no differences between the two genotypes. However, BX10 increased the concentration of citric acid, whereas BD2 decreased it. Moreover, malic acid was only found in rhizosphere soil of BX10.
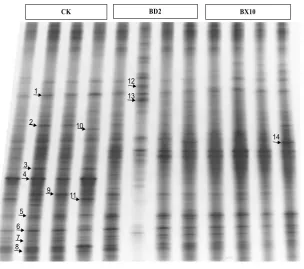
DGGE analysis of the rhizosphere soil. DGGE lanes of 16S rRNA gene are shown in Figure 3. Among the three different soils, DGGE lanes con-sisted of a few stronger bands and a large number of fainter bands. Similar DGGE patterns were observed within the same soybean genotype. A neighbor-joining phylogenetic tree was con-structed to visualize the relationships among the sequences from soils (Figure 4). The band 14 was specific to rhizosphere soil of BX10, and sequence analysis showed that the band shared the highest similarity to uncultured proteobacterium. The 12 and 13 bands of BD2 rhizosphere soil were assigned to the Acinetobacter sp. and Candidatus Amoebinatus sp., respectively.
CK BD2 BX10
1
2
3 4
5 6 7 8
9 10
11
12 13
[image:3.595.67.372.53.322.2]14
Figure 3. Denaturing gradient gel electrophoresis(DGGE) finger-print of rhizosphere microbial communities from the rhizosphere soils of CK, BX10, and BD2
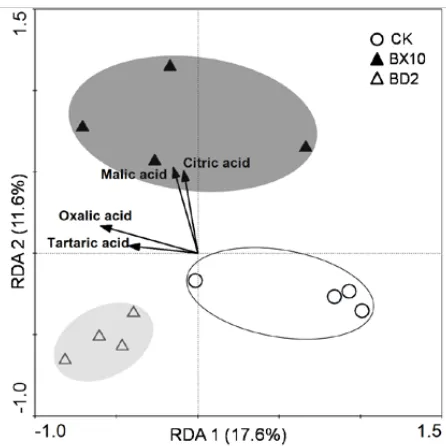
[image:3.595.93.505.564.732.2]RDA results were summarized in a plot contain-ing soil samples, and bacterial communities were clearly separated into three groups (Figure 5). The first axis explained 17.6% of total variation, while the second axis explained 11.6%. Samples-organic acid correlations were high (P < 0.05), especially for axis 1 (0.824) and axis 2 (0.923). In the biplot, citric acid and malic acid generally showed sig-nificantly positive correlation with rhizosphere bacterial communities of BX10 (P < 0.05).
CCLP of rhizosphere bacteria. The AWCD from Biolog ECO plates as a whole along with the incubation time is shown in Figure 6. The rate of colour development over time was generally sig-moidal for all samples. The rate of AWCD from BX10 was higher than that from BD2 and CK.
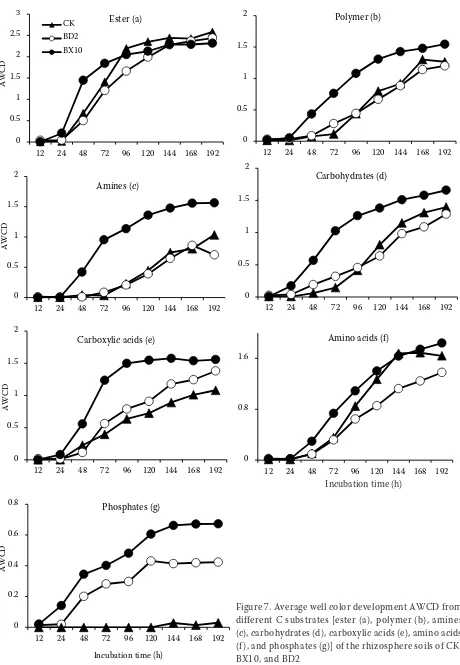
The values of AWCD calculated from the ex-tracted wells along with the incubation time are shown in Figure 7. The rates of utilization of phosphate and, to a lesser extent, of carboxylic acids were higher for BX10 and BD2 than for CK (P < 0.05). However, there were little differences in the utilizations of ester among the soil extracts. Unexpectedly, the ability of amino acid metabolism in BD2 was reduced (P < 0.05).
DGGE analysis of the Biolog ECO wells. The DGGE profiles of all substrates showed some dis-tinct bands among the soil samples (Figure S1). Sequences analysis shows the distinct organ-isms for BX10 and BD2 rhizosphere soils after incubation.
DISCUSSION
DGGE profiles of rhizosphere soil and RDA results revealed that the two soybean genotypes induced distinct bacterial communities. Organic acid contents showed that the rhizosphere soil of BX10 had an increased concentration of citric acid and malic acid compared with CK and BD2 (Figure 2). Under Al toxicity conditions, BX10, an Al-tolerant soybean, may secret more organic acids than BD2 in hydroponic culture (Dong et al. 2004). A similar result was also reported in a previous study (Yang et al. 2000), where an Al-exclusion mechanism in soybean cultivars was conferred by enhanced and specific Al-induced exudation of citrate. RDA results also showed that citric acid and malic acid had a significantly positive correlation with bacterial communities of BX10 (Figure 5), suggesting that citric acid and malic acid may be a positive selection force with some microbes in the rhizosphere soil. Rudrappa et al. (2008) found that malic acid secreted from the roots of Arabidopsis thaliana selectively sig-nals and recruits the beneficial rhizobacteria. Our results suggested that two soybeans induced some special bands (BD2-12, 13, and BX10-14). A pos-sible explanation for these results is hypothesized: organic acid secreted by soybean roots, such as citric acid and malic acid, selectively stimulates some rhizobacteria.
[image:4.595.66.289.478.701.2]CLPP was successfully used to monitor shifts in microbial communities in soil and other natural environments (Ros et al. 2008). The CCLP showed a clearly different ability to consume a range of carbon sources. Sequence analysis from DGGE profiles in the Biolog wells indicated that differ-ent subsets of rhizosphere communities became
Figure 5. Ordination biplot diagrams generated by redundancy analysis (RDA). The groups of CK, BD2, and BX10 are highlighted in colorless, grey, and black, respectively
0 0.2 0.4 0.6 0.8 1 1.2 1.4 1.6 1.8
24 48 72 96 120 144 168 192
AW
C
D
Incubation time (hour) CK
BD2 BX10
Figure 6. Average well color development (AWCD) in Biolog ECO plates of CK, BX10, and BD2 as a whole
[image:4.595.308.525.556.723.2]dominant after incubation. This finding could be partially attributed to the fact that culturable bacteria are ‘r-strategists’, and they respond very
quickly to the changes in types of exudates in the rhizosphere compared with the oligotrophic spe-cies (K-strategists) in the wells (Buyer et al. 2002).
0 0.5 1 1.5 2 2.5 3
12 24 48 72 96 120 144 168 192
AW
C
D
Ester (a) CK
BD2 BX10
0 0.5 1 1.5 2
12 24 48 72 96 120 144 168 192
Polymer (b)
0 0.5 1 1.5 2
12 24 48 72 96 120 144 168 192
AW
C
D
Amines (c)
0 0.5 1 1.5 2
12 24 48 72 96 120 144 168 192
Carbohydrates (d)
0 0.5 1 1.5 2
12 24 48 72 96 120 144 168 192
AW
C
D
Carboxylic acids (e)
0 0.8 1.6
12 24 48 72 96 120 144 168 192
Incubation time(h) Amino acids (f)
0 0.2 0.4 0.6 0.8
12 24 48 72 96 120 144 168 192
AW
C
D
[image:5.595.69.529.47.712.2]Incubation time (h) Phosphates (g)
Figure 7. Average well color development AWCD from different C substrates [ester (a), polymer (b), amines (c), carbohydrates (d), carboxylic acids (e), amino acids (f ), and phosphates (g)] of the rhizosphere soils of CK, BX10, and BD2
Corresponding authors:
Yonghua Yang and Jinliang Qi, Nanjing University, Mailing School of Life Sciences, Nanjing 210093, P.R. China phone: + 86 25 8359 4220, fax: + 86 25 8330 5493, e-mail: YangYH@nju.edu.cn, QiJL@nju.edu.cn
In conclusion, the two soybean genotypes in-duced distinct rhizosphere microbial communi-ties. Moreover, malic acid and citric acid in the rhizosphere soil of BX10 may have notable effects on soil microbial communities.
Acknowledgements
We are very grateful to Prof. Deyue Yu from the Nanjing Agricultural University and Ms. Jelena Acimovic from the University of Toronto for their helpful comments in composing the manuscript.
REFERENCE
Berg G., Eberl L., Hartmann A. (2005): The rhizosphere as a reservoir for opportunistic human pathogenic bacteria.
Envi-ronmental Microbiology, 7: 1673–1685.
Buyer J.S., Roberts D.P., Russek-Cohen E. (2002): Soil and plant effects on microbial community structure. Canadian Journal
of Microbiology, 48: 955–964.
Campbell C.D., Grayston S.J., Hirst D.J. (1997): Use of rhizosphere carbon sources in sole carbon source tests to discriminate soil microbial communities. Journal of Microbiological Methods,
30: 33–41.
Dong D., Peng X., Yan X. (2004): Organic acid exudation induced by phosphorus deficiency and/or aluminium toxicity in two
con-trasting soybean genotypes. Physiologia Plantarum, 122: 190–199.
Garland J.L., Mills A.L. (1991): Classification and characteriza-tion of heterotrophic microbial communities on the basis of patterns of community-level sole-carbon-source utilization.
Applied and Environmental Microbiology, 57: 2351–2359.
Jaeger C.H., III, Lindow S.E., Miller W., Clark E., Firestone M.K. (1999): Mapping of sugar and amino acid availability in soil around roots with bacterial sensors of sucrose and tryptophan.
Applied and Environmental Microbiology, 65: 2685–2690.
Kochian L.V. (1995): Cellular mechanisms of aluminum toxicity and resistance in plants. Annual Review of Plant Physiology
and Plant Molecular Biology, 46: 237–260.
Ma J.F., Ryan P.R., Delhaize E. (2001): Aluminium tolerance in plants and the complexing role of organic acids. Trends in
Plant Science, 6: 273–278.
Nardi S., Sessi E., Pizzeghello D., Sturaro A., Rella R., Parvoli G. (2002): Biological activity of soil organic matter mobilized by
root exudates. Chemosphere, 46: 1075–1081.
Ovreas L., Forney L., Daae F.L., Torsvik V. (1997): Distribution of bacterioplankton in meromictic lake saelenvannet, as de-termined by denaturing gradient gel electrophoresis of PCR-amplified gene fragments coding for 16S rRNA. Applied and
Environmental Microbiology, 63: 3367–3373.
Rengel Z. (2002): Genetic control of root exudation. Plant and Soil, 245: 59–70.
Ros M., Goberna M., Pascual J.A., Klammer S., Insam H. (2008): 16S rDNA analysis reveals low microbial diversity in community level physiological profile assays. Journal of Microbiological
Methods, 72: 221–226.
Rudrappa T., Czymmek K.J., Pare P.W., Bais H.P. (2008): Root-secreted malic acid recruits beneficial soil bacteria. Plant
Physiology, 148: 1547–1556.
Smalla K., Wachtendorf U., Heuer H., Liu W.T., Forney L. (1998): Analysis of BIOLOG GN substrate utilization patterns by microbial communities. Applied and Environmental
Micro-biology, 64: 1220–1225.
Smalla K., Wieland G., Buchner A., Zock A., Parzy J., Kaiser S., Roskot N., Heuer H., Berg G. (2001): Bulk and rhizosphere soil bacterial communities studied by denaturing gradient gel electrophoresis: plant-dependent enrichment and seasonal
shifts revealed. Applied and Environmental Microbiology, 67:
4742–4751.
Yang T., Liu G., Li Y., Zhu S., Zou A., Qi J., Yang Y. (2012): Rhizo-sphere microbial communities and organic acids secreted by aluminum-tolerant and aluminum-sensitive soybean in acid
soil. Biology and Fertility of Soils, 48: 97–108.
Yang Z.M., Sivaguru M., Horst W.J., Matsumoto H. (2000): Alu-minium tolerance is achieved by exudation of citric acid from
roots of soybean (Glycine max). Physiologia Plantarum, 110:
72–77.
Zhou J., Bruns M.A., Tiedje J.M. (1996): DNA recovery from soils of diverse composition. Applied and Environmental
Microbiol-ogy, 62: 316–322.