Decarburization of 3%Si–1.1%Mn–0.05%C Steel Sheets by Silicon Dioxide
and Development of {100}
h
012
i
Texture
*Toshiro Tomida
Corporate Research & Development Laboratories, Sumitomo Metal Industries, Ltd., Amagasaki 660-0891, Japan
Decarburization of silicon steel sheets by annealing with oxide separators has been found to cause a high degree of {100}-texture development. Cold-rolled Fe–3%Si–1.1%Mn–0.05%C sheets of 0.35 mm thickness were laminated with separators containing SiO2. They were
then annealed under a reduced pressure at about 1300 K in a ferrite and austenite two phase region. It has been observed that carbon concentration notably decreases down to 0.001% during the lamination annealing. Thus an almost complete decarburization of sheet steels was possible, whereas no oxidation of silicon as well as manganese and iron occurred. Associated with decarburization, columnar ferrite grains grew inward from sheet surfaces due to the phase transformation from austenite to ferrite. A {100}h012itexture dramatically developed in the columnar grains. Fully decarburized materials consisted of grains of 0.6 mm diameter, more than 90% of which were closely aligned with {100}h012iorientation. Another aspect of great interest in the grain structure after decarburization was that there existed convoluted domains of a few mm in width, in which dozens of grains were oriented in a single variant of the texture, (100)[012] or (100)[021]. The decarburization is considered to be caused by the thermo-chemical reaction, 2C+SiO2!Si+2CO. The texture development is most likely to be due to the
orientation dependence of surface free energy under an oxidation-free surface condition.
(Received February 28, 2003; Accepted April 30, 2003)
Keywords: decarburization, phase transformation, diffusion, texture, silicon dioxide, silicon steel
1. Introduction
It is well known that the columnar ferrite grains that grow inward from specimen surfaces due to the phase transforma-tion from austenite () to ferrite () posses a directional nature not only morphologically but also crystallographical-ly. Such a columnar grain growth may result from the removal of a-stabilizing element,1–6)the introduction of an
stabilizer,3,7)or the temperature change8–10) under appro-priate conditions. Various crystallographic textures with {100}, {110}, {111} and {731} planes parallel to specimen surfaces have been reported associated with the columnar grain growth. However the reported textures are, in common, rather diffuse as compared to the sharp textures often observed for the materials after secondary recrystallization. Moreover, despite the importance of {100} and {110} textures to the silicon steel sheets used for magnetic applications (electrical steels), the investigation to date has been mostly limited to silicon-free steels.
Since decarburization is typical of the removal of -stabilizing elements, the texture developed upon columnar grain growth of phase has been well studied by the decarburization of plain carbon steels. Abe and Ito1,2) examined the columnar grains grown by decarburizing 0.2 to 0.8%C steels in a wet hydrogen gas atmosphere at elevated temperatures, and they identified {110} and {731} preferred orientations. Higgins,et al.3)made a similar experiment on 0.28%C steels and reported that {100}, {110}-{310}, {111} and {411} textures appeared depending on surface treatment and decarburization temperature. The textures near the {100} and {110} orientations were also reported for the columnar
grains9,10) that were developed upon the ! !
transformation by temperature variation. However, these textures are relatively diffuse, and investigation has been
barely made on silicon-bearing steels as mentioned earlier. An apparent problem which arises on the investigation of columnar grain growth in silicon-bearing steels is that the
loop disappears when silicon is alloyed to iron over 2.5%. An ample alloying of-stabilizing elements such as carbon and manganese is therefore necessary. Besides, the decarburiza-tion annealing in a wet hydrogen gas atmosphere causes severe surface and internal oxidations of silicon and manganese, which may influence texture development. The author and a co-worker4–6)hence studied the columnar grain growth in silicon-bearing steels by the removal of manga-nese, instead of decarburization. To obtain enough stability of phase, 1 to 1.5% of manganese and 0.05 to 0.1% of carbon were alloyed into iron along with 2 to 3% of silicon. The steels were then annealed in an = two phase region around 1200 K under a vacuum, which caused the removal of manganese due to vaporization without oxidizing specimen surfaces. A marked development of {100} texture was observed to occur by the manganese removal. Although this transformation due to the loss of manganese was rather sluggish so that columnar grains grew only to the depth of about 50mm, the results indicated that strongly textured materials might be obtained by the transformation-induced grain growth under adequate conditions.
In the present study, a method for decarburizing silicon-bearing steel sheets, during which the oxidation of sheet surfaces is avoided, has been investigated to obtain strongly {100}-textured sheet materials. A method was employed, in which Fe–3%Si–1.1%Mn–0.05%C sheets of 0.35 mm thick-ness were laminated with SiO2-containing separators and annealed in an = two phase region under a reduced pressure. It is shown in this article that the lamination annealing leads to a notable decarburization, by which the sheet materials can be fully decarburized avoiding the oxidation of silicon and manganese and a high degree of texture development in {100}h012iorientation is caused in
*This Paper was Originally Published in Japanese in J. Japan Inst. Metals
66(2002) 824–831.
the material. The mechanisms of decarburization and texture evolution are then discussed. In the article following to this, the development of cube texture {100}h001i and thereby obtained doubly oriented silicon steel sheets will be described.11)
2. Experimental Procedure
A steel ingot of the chemical composition tabulated in Table 1 has been prepared by a vacuum melting. In this steel,
and phases coexist at a relatively wide range of temperatures approximately between 1000 and 1400 K as shown in Fig. 1. The resulting ingot was processed to 4.0 mm thick plates by hot forging and then hot rolling. After pickling, they were then cold-rolled to 0.35 mm thick sheets. The samples of150150mm2in dimensions were cut from the cold-rolled sheets and used in the following annealing experiment.
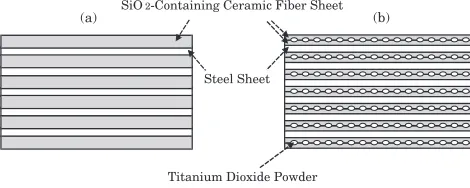
Sheet samples were laminated with oxide separators which not only acted to prevent the samples from sticking but also reacted with the samples to cause decarburization. Two types of lamination arrangement shown in Fig. 2 were used. In the first case shown in Fig. 2(a), the samples were laminated with sheet-form separators consisting of about 3mm diameter fibrous materials which contained 52% SiO2and 48% Al2O3. The sheet-form separators were prepared by a papermaking process. The thickness and apparent density of the separators were 1 mm and 0.3 g/cm2 respectively. Prior to lamination, the separators were heat-treated in the atmosphere at 1273 K for 1 h to remove an organic binder that was necessary in the papermaking process. After the heat-treatment, the separator
showed an X-ray profile which indicated the presence of mullite (2Al2O3SiO2) and an amorphous phase.
In the second case, the arrangement shown in Fig. 2(b) was used to study the influence of the addition of TiO2 powder into separators on decarburization. The TiO2 powder (99% purity) of an amount of 40 g/m2 was placed between two 0.5 mm thick separator sheets, and they were together inserted between the samples. These separator sheets were the same as those used in the first case except for sheet thickness. For comparison, some samples were laminated with 3 mm thick Al2O3 plates of 99.9% purity.
The laminated samples were placed in a vacuum furnace, and the pressure of atmosphere was reduced to about103or 1 Pa. Then they were heated at a rate of 1 or 10 K/min to the temperatures ranging from 1173 to 1323 K and were kept for the time periods up to 12 h. Some samples were halfway heated and immediately cooled. Unless mentioned otherwise, the pressure of annealing atmosphere and the heating rate are
103Pa and 1 K/min respectively.
The cold-rolled and annealed samples were examined in chemical composition, texture and microstructures; about
5050mm2portions at the centers of150150mm2sheet samples were examined. Textures were measured by X-ray diffractometry with a molybdenum target and by EBSP (Electron Back Scattering Pattern) coupled to a scanning electron microscope. By X-ray diffractometry, {200}, {111}, {211}, {222} and {310} pole densities were obtained as multiples of those for iron powders. The measurements were made at sheet surfaces and 20 to 30mmbelow sheet surfaces for X-ray diffractometry and EBSP respectively. Microstruc-tures were observed by optical microscopy and OIM (Orientation Imaging Microscopy) capability of EBSP. The sample surfaces were polished and etched in Nital solution for optical microscopy unless mentioned otherwise. Those for EBSP were electro-polished after mechanical polishing.
3. Experimental Results
3.1 Decarburization by SiO2 and columnar grain
growth
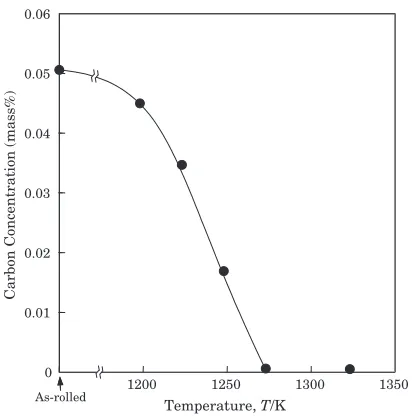
[image:2.595.307.542.75.169.2]The decarburization phenomena observed without TiO2 powder in separators are first described. Figure 3 is the plot of carbon concentrations after annealing for 12 h as a function of annealing temperature. Below 1200 K, the carbon concentra-tion scarcely changes during annealing for 12 h. However, it greatly decreases at temperatures higher than 1250 K. At 1273 K, carbon concentration decreases to below 0.002% for 12 h. Therefore the sheet samples could be completely Table 1 Chemical composition of the steel used (mass%).
C Si Mn P S sol-Al
0.051 3.02 1.12 0.0141 0.0016 0.0018
0 1700
900
0.02 0.04 0.06 0.08 0.1 Carbon Concentration (mass%)
Temperature
,
T
/K
α
α+γ
α+θ
Fe-C-3%Si-1%Mn
γ
1100 1300 1500
Initial Composition
Fig. 1 Phase diagram for Fe–C–3%Si–1%Mn calculated using Thermocalc.
Steel Sheet
SiO2-Containing Ceramic Fiber Sheet
Titanium Dioxide Powder
(a) (b)
[image:2.595.54.287.481.760.2]decarburized by the lamination annealing using SiO2 -containing separators.
In Fig. 4, the changes in carbon concentration at 1248 and 1323 K are shown as a function of annealing time. It is clearly seen, particularly in the data at 1248 K, that carbon concentration decreases proportionally to the time period of annealing. The carbon concentration decreases at a rate of about 0.003%/h at 1248 K and reduces down to 0.017% for 12 h. At 1323 K, the decarburization rate becomes about 5 times larger than that at 1248 K so that carbon is almost thoroughly removed within 4 h of annealing. Note that a sizable amount of carbon is removed even during heating when the rate of heating is 1 K/min as shown in Fig. 4(b); a
decreased carbon concentration is observed without being kept at 1323 K.
Since the observed decarburization might be caused due to a remaining oxygen gas in annealing atmosphere, annealing experiment was made at 1323 K under two different levels of vacuum, 1 and103Pa, to see if decarburization is dependent on vacuum levels. The obtained data are shown in Fig. 4(b). Whereas the decrease in carbon concentration during heating is somewhat pressure-dependent, the rate of decarburization observed at 1323 K is little dependent on the pressure of annealing atmosphere. The decrease in carbon concentration during heating under a vacuum of103Pa is larger than that under a vacuum of 1 Pa, which is totally against the mechanism of decarburization due to a remaining oxygen gas. Thus the remaining oxygen gas could not be the primary reason to cause decarburization.
Concentrations of manganese and silicon were also observed to vary during annealing. As shown in Fig. 5, the concentration of manganese decreases from 1.1 to 1.0% during heating, and it further decreases to 0.9% for 12 h at 1323 K. This decrease in manganese concentration is thought to be due to vaporization of manganese, of which equilibrium vapor pressure is rather high at high temperatures; the equilibrium vapor pressure of manganese, for instance, at 1323 K is 8.3 Pa12)which is3104times larger than that of iron. The silicon concentration, on the other hand, tends to increase in the early stages of annealing. It increases by about 0.05% as samples are completely decarburized. This increase in silicon concentration is closely related to the decarburiza-tion mechanism as will be described later.
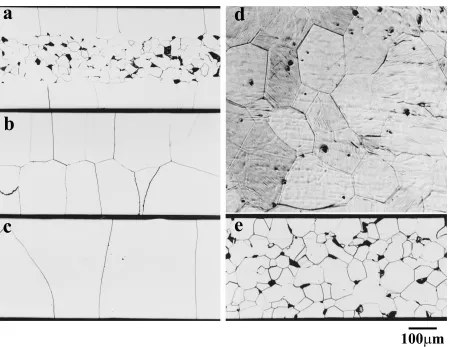
Figures 6(a) to (c) show the optical micrographs of complete cross sections of the samples annealed at 1323 K. It is seen that columnargrains develop from sheet surfaces into the center. Beyond the growth front of columnar grains, the mixed structure that is the remnant of and phases stable at the annealing temperature is observed; the dark particles are pearlite. After an annealing for 2 h, the columnar grains developed from both surfaces impinge at the center of sheet thickness, and the mixed structure disappears. It is also
1200 1250 1300 1350
Temperature, T/K 0
0.01 0.02 0.03 0.04 0.05 0.06
Carbon Concentration (mass%)
As-rolled
Fig. 3 Carbon concentrations of samples after annealing for 12 h.
0 0.02 0.04 0.06
0 200 400 600 800
Annealing Time, t /min
0 0.02 0.04
As-rolled
at 1323 K at 1248 K 10 Pa
Carbon Concentration (mass%)
-3
10 Pa-3
1 Pa
(a)
(b)
Fig. 4 Variations in carbon concentration during annealing at (a) 1248 K and (b) 1323 K. Heating rates are (a) 10 K/min and (b) 1 K/min.
0 200 400 600 800
Annealing Time, t /min 0.8
0.9 1 1.1
Mn
Concentration (mass%)
3 3.05 3.1
Si
Mn
As-rolled
Silicon Concentration (mass%)
[image:3.595.66.272.71.279.2] [image:3.595.68.273.502.759.2] [image:3.595.321.532.562.756.2]seen that the columnar grains grow not only inward from surfaces but also in the directions parallel to surfaces (the increase in column radii). The diameter of columnar grains increases keeping the ratio of diameter to length of columnar grains to be from 1 to 2.
Figure 6(d) is the optical micrograph of the sheet surface after annealing at 1248 K for 12 h, which has been taken without post-annealing treatments such as polishing and etching. It is of great interest that the sheet surface after annealing is free from oxidation and thermally etched. No identifiable oxide via optical microscopy existed on the sheet surfaces after annealing in this experiment. The sheet surfaces had the luster of metals, and any internal oxidation was not observed either.
In order to see if the presence of Al2O3 in separators influences decarburization, an annealing experiment using pure Al2O3 separators was made. In Fig. 6(e) is shown the microstructure of cross sections after annealing at 1323 K using Al2O3 plate separators. Despite a long annealing for 12 h, no distinct decarburized layer with developed columnar grains is observed near sheet surfaces. The decrease in carbon concentration was only 0.006%, which was contrasted with the result that little carbon remained after the same long annealing with SiO2-containing separators as shown Fig. 4. Therefore, considering small but possible effects of a remaining oxygen gas in annealing atmosphere, a stable
oxide of Al2O3is likely to be idle for the removal of carbon. Then the influence of the addition of TiO2 powder into separators was studied. In Fig. 7, the variations in carbon and manganese concentrations at 1323 K are shown as a function of annealing time. The decrease in carbon concentration is Fig. 6 Optical micrographs of (a)–(c), (e) cross-sections and (d) a surface of samples annealed using (a)–(d) SiO2-containing separators
and (e) an Al2O3plate separator. The samples were annealed (a) at 1323 K for 1 h, (b) at 1323 K for 2 h, (c) at 1323 K for 8 h, (d) at 1248 K
for 12 h, and (e) at 1323 K for 12 h.
0 400 800 1200
0 0.02 0.04 0.06
Carbon Concentration (mass%)
0.4 0.6 0.8 1 1.2 1.4
Manganese Concentration (mass%)
C
Mn
As-rolled Annealing Time, t /min
[image:4.595.75.525.67.414.2] [image:4.595.322.532.566.758.2]linearly proportional to annealing time for first 4 h, and carbon is almost completely removed after an annealing for 8 h. This behavior is similar to that observed in the case without TiO2 powder (see Fig. 4). However the rate of decarburization is smaller than that seen in Fig. 4, and thus decarburization is delayed. On the contrary, the decrease in manganese concentration is enhanced by the presence of TiO2 (also see Fig. 5). The concentration of manganese decreases down to 0.5% for 12 h of annealing, which is more than twice the variation observed without TiO2. Because of the delay in decarburization, the development of columnar grains was also retarded, whereas the morphological char-acteristics of developed columnar grains were unchanged. The microstructures similar to those in Fig. 6 were observed with the presence of TiO2.
3.2 {100}h012itexture development
Figure 8 shows the textures after cold rolling and the variations in texture during annealing. After cold rolling, the components with {100}, {111} and {211} planes parallel to
the rolling plane are observed in the decreasing order of intensity. Then during heating up to 923 K, the {111} texture component is somewhat strengthened at the expense of other components, since deformed structures undergo recovery and primary recrystallization. At 1323 K, the {111} component is gradually weakened, and instead the {100} texture develops to become the strongest single component. Note that since these measurements were made at sheet surfaces, the abovementioned {100} texture development was the one which occurred in the columnar grains growing inward from sheet surfaces.
It is well recognized by comparing the data in Figs. 8(a) and (b) that the primary effect of addition of TiO2 powder into separators is the enhancement of {100} texture devel-opment. Without the presence of TiO2 powder, a {111} component of a sizeable intensity is still observed to remain after long annealing. However, with the presence of TiO2 powder, the {100} texture dramatically evolves so that the intensities of all other components are almost entirely diminished. It is also noteworthy that this texture develop-ment has been little influenced by the variation in pressure of annealing atmosphere in the range under investigation, although the data are not shown here.
The microstructure and texture of the sample which has just undergone heating up to 1323 K with TiO2 powder are displayed in Fig. 9. It is seen in the microstructure of cross
0 400 800 1200
0.001 0.01 0.1 1 10 100
Pole Density
As-rolled
<100> <111>
<211>
<110>
Heated to 923 K
Annealing Time, t /min
0 400 800 1200
0.001 0.01 0.1 1 10 100
Pole Density
<100> <111>
<211>
<110>
Annealing Time, t /min
(a)
(b)
As-rolled
Heated to 923 K
Fig. 8 Pole density variation during annealing at 1323 K (a) without and (b) with TiO2powder.
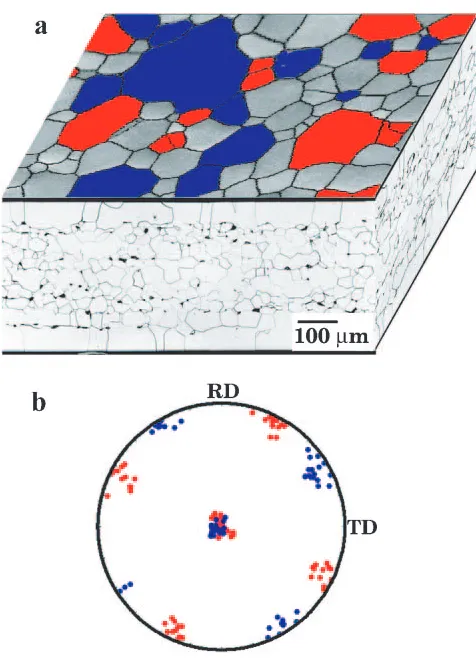
Fig. 9 Grain structures of the sample after heating up to 1323 K; (a) an OIM image of surface grain structures and optical micrographs of cross-sections, (b) a {100} pole figure for the selected grains near sheet surfaces, which have {100} planes within 15 of the sheet plane. Those
[image:5.595.66.272.339.757.2] [image:5.595.307.545.391.720.2]sections that columnar grains are already grown to the depth of 60 to 70mm from sheet surfaces associated with decarburization. The average diameter of columnar grains seen in the surface OIM image is about 100mm. Therefore, the ratio between length and diameter of columnar grains is about 1.5 as aforementioned. Orientation analysis on the columnar grains by EBSP has revealed that about 30% of the grains in this stage of decarburization have {100} planes within 15with respect to the sheet plane and they are closely aligned with {100}h012i orientation that has h100i axes in the directions rotated from RD and TD by about 26about the sheet surface normal (ND). It is worth noting that there are two possible variants of the {100}h012i texture allowed under the symmetry of rolling processes, (100)[012] and (100)[021], and those variants are more or less homoge-neously distributed in this early stage of decarburization.
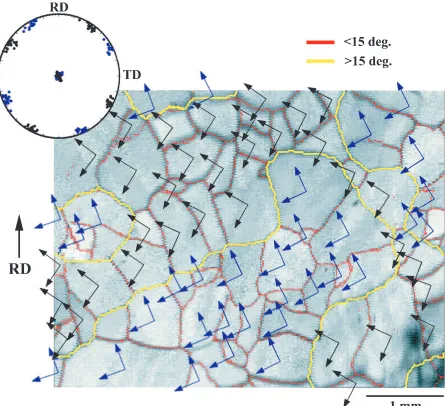
A typical example of grain structures after complete decarburization is presented in Fig. 10. This sample was annealed using TiO2 powder at 1323 K for 12 h to reduce carbon concentration down to about 0.001%. In a45mm2
[image:6.595.77.524.71.477.2]surface area, 66 grains of which average grain diameter is 0.64 mm have been identified. All the grains seen in this figure have {100} planes nearly parallel to the sheet surface. The average misorientation angle between the {100} planes and the sheet surface is 4.4. It is also clear that the grains are well aligned with {100}h012iorientation, which is the same preferred orientation as observed in the early stages of decarburization. However, although the two variants of the {100}h012i texture are homogeneously distributed in the early stages, these variants are notably separated in this final stage of decarburization forming convoluted domains of a few mm in width, in which dozens of grains are oriented in a single variant. The domains are seen to be separated by a series of high angle boundaries between grains of different texture variants, whereas the grain boundaries within domains are of low angles as displayed in the surface OIM image as yellow and red lines respectively. A similar but somewhat weaker {100}h012i texture was observed to develop during the annealing without addition of TiO2 powder into separators.
4. Discussion
4.1 Decarburization mechanism
By the lamination annealing with separators containing SiO2, Fe–3%Si–1.1%Mn–0.05%C sheets of 0.35 mm thick-ness could be decarburized down to about 0.001% of carbon concentration without oxidization of silicon and manganese. Let us first discuss the mechanism of decarburization.
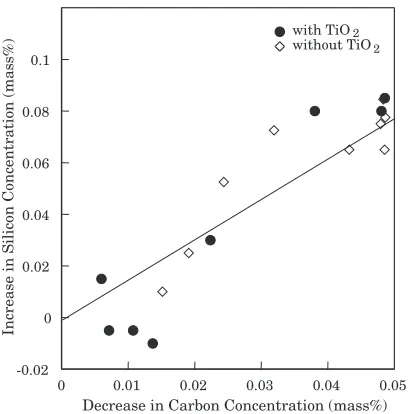
It has been observed as shown in Fig. 5 that silicon concentration slightly increases during decarburization. This variation in silicon concentration is again plotted in Fig. 11 as a function of the amount of carbon removed, including the data obtained both with and without TiO2 powder in separators. It is evident from these plots that the increase in silicon concentration is nearly linear to the amount of carbon removed. As carbon concentration decreases by 0.05%, silicon concentration increases by 0.06 to 0.08%; note that, although an apparent increase in silicon concentration may be caused by the removal of manganese which simultaneously occurs, this contribution to the increase in silicon concentra-tion is at most 0.015%. This means, on the molecular weight basis, that as two moles of carbon are removed, about one mole of silicon is dissolved into steels. Then one might consider the following thermochemical reaction for decar-burization.
2½C þ hSiO2i ¼ ½Si þ2ðCOÞ; ð1Þ
where hi, [] and () denote pure solids, solute in solids and gaseous states respectively. As illustrated in Fig. 12(a), this reaction is the process in which SiO2 adjoining steels is reduced by solute carbon resulting in the dissolution of silicon into steels and the production of CO gas.
The equilibrium for the above reaction can be calculated from the free energy change, 909600218:5Tþ12:6T
logðTÞ(J/mol)13)for the reaction,
hSiO2i ¼ hSii þ ðO2Þ;
and the free energy change, 11170087:65T (J/mol)13) for the reaction,
hCi þ1
2ðO2Þ ¼ ðCOÞ;
as follows,
PCO ¼ ðac=a1=2Si Þ exp½ð686200393:8T
þ12:6TlogðTÞÞ=ð2RTÞ: ð2Þ
HerePCO is the equilibrium partial pressure of CO gas,T is temperature, R is the gas constant, and aSi and ac are the activities of silicon and carbon respectively. When CO gas partial pressure becomes smaller thanPCO, the reaction in eq. (1) proceeds from left to right to cause decarburization.
Given the activities of silicon and carbon, PCO is then readily calculated. The activity of silicon in Fe–3%Si– 1%Mn–0.05%C at 1323 K, which has been calculated using Thermocalc,14)is4106. That of the carbon in Fe–3%Si– 0.05%C at 1273 K has been reported to be 0.12.15)Therefore let the activities of silicon and carbon in our material be
4106 and 0.12 respectively. Putting the values into eq. (2), the PCO shown in Fig. 12(b) has been obtained; the activities were assumed to be independent of temperature. The PCO increases with increasing temperature, and it becomes about 100 Pa at 1323 K which is the annealing temperature in this experiment. Since the experimental pressure of annealing atmosphere is from 103 to 1 Pa, the actual CO gas partial pressure at sample surfaces would be kept far below thePCOat the annealing temperature. Hence the decarburization in this experiment may be caused by the reaction in eq. (1). It may also be remarked that the dissolution of silicon into steels is an important process to enhance decarburization since it greatly reduces the activity
7 8 9 10
Inverse of Temperature, T-1/ 10-4K-1 10-3
10-1 101 103
PCO
,
P
/Pa
1000 1200
1400
Temperature, T /K
(a)
(b) [C]
[O]
[Si] SiO (CO)
2
[image:7.595.67.274.70.277.2]Steel Atmosphere
Fig. 12 (a) Schematic representation of decarburization reaction and (b) calculated CO partial pressure as a function of inverse of temperature.
0 0.01 0.02 0.03 0.04 0.05 Decrease in Carbon Concentration (mass%) -0.02
0 0.02 0.04 0.06 0.08 0.1
Increase in Silicon Concentration (mass%)
with TiO without TiO2 2
[image:7.595.336.517.72.371.2]of silicon (from 1 to4106at 1323 K) and increasesPCO. As long as the reaction in eq. (1) proceeds from left to right, silicon in steels is not oxidized. Since manganese as well as iron has a less oxidation tendency than silicon, they are not oxidized either under this circumstance. Hence the reaction in eq. (1) is in good agreement with the observation that the surfaces of samples have been kept free from oxidation during decarburization. Under an oxidation-free surface condition, the vaporization of manganese in steels at elevated temperatures is known to be enhanced.16)This could be a factor to cause the large decrease in manganese concentration during decarburization. Moreover the influ-ence of TiO2 on decarburization as well as the removal of manganese is presumably related to the variation in surface properties by the presence of TiO2. However, further study is necessary to understand this point.
4.2 Microstructure evolution
The evolution process of microstructures that single phase
regions consisting of columnar grains develop from sheet surfaces into an=two phase region is in good accordance with the abundant results previously reported for plain carbon steels.1–3)The kinetics of the microstructure evolution would be accounted for by the theories that incorporate with diffusion of substance and phase transformation.17)
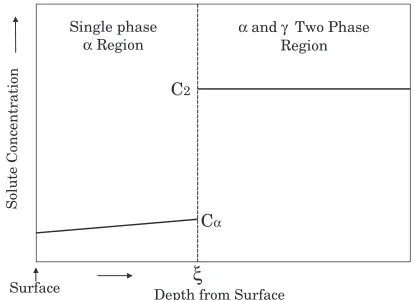
A schematic diagram of the concentration profile of diffusing substance in the system that should be assumed in the present case is shown in Fig. 13. In the region in the inside in whichandphases coexist, no diffusion of solute occurs since the chemical potential of the solute has to be constant because of the equilibrium between the two phases. The diffusion of the solute takes place only in the single phase
region growing inward from surfaces. The migration of the planar boundary between these two regions is then related to the outward flux of solute in the single phaseregion at the boundary,Jb, as
d=t¼Jb=ðC2CÞ: ð3Þ
Here is the depth from surfaces, at which the boundary is located at a time, t. C2 and C are the average solute concentration in the two phase region and the solute concentration inphase in equilibrium with phase in the
two phase region, respectively. If we restrict ourselves to take only the diffusion of carbon into consideration, the flux at the boundary,Jb, can be approximated as the flux at the surface,
Js. This is because the diffusivity of carbon inphase at the experimental temperature is large enough for the diffusion to cause the observed amount of carbon flow with little carbon concentration variation. Since theJsin this experiment,i.e., the decarburization rate, has been observed to be mostly constant in respect of annealing time (see Figs. 4 and 7), the
Jbunder consideration is regarded to be independent on time. Therefore, according to eq. (3), the boundary migrates with a constant velocity into the inside; i.e., the evolution of columnar grains occurs at a constant rate, which is the case observed in this experiment.
4.3 Texture evolution
Apart from microstructures, a remarkable feature in columnar grain growth in the present experiment is that {100}h012itexture has greatly evolved resulting in as high a degree of texture as sometimes observed for materials after secondary recrystallization. Many factors that need to be considered for the texture evolution during columnar grain growth have been argued in literature.1–3,9,10)Those are (a) the possible variants of the phase transformation from to
based upon the texture of phase as well as the orientation relation between andphases such as Kurdjumov-Sachs relation, (b) the role of surface energy upon the nucleation and growth ofphase, (c) the role of surface energy upon the texture evolution in phase in relation with (a), (d) the influence of surface topology and chemistry since it relates to (b) and (c), and (e) the dependence of decarburization rates on crystal orientations. In addition, (f) Hashimotoet al.9,10) have proposed that the anisotropy in lattice strains of phase transformation may influence the variant selection in (a).
Many of them,e.g., (a), (c) and (f), are however the factors to be considered only for the nucleation of phase in
matrices near surfaces. These factors may be disregarded, sinceislands in= two phase structures would serve as nuclei for the columnar grain growth in the present case. The factor (e) might operate. However, this effect would be soon smeared out after columnar grains extend to a little depth from surfaces, since the diffusivity of carbon in phase should be very large in comparison with the decarburization rate.
The factors that need to be considered in the present case are likely to be the surface-energy-related ones, i.e., the factors, (b) and (d). It is obvious that if the surface energy of {100} planes of phase is the lowest in all surface orientations, {100}-orientedislands tend to preferentially grow at the expense of phase until surfaces are entirely covered withphase. In addition, if the radii of columnar grains increase at the same time with the growth in ND as illustrated in Fig. 14, the {100} texture may further evolve during the columnar grain growth driven by surface energy difference. The experimental facts that the {100}h012i texture has evolved not only in the early stages of decarburization but also in the later stages and the radii of columnar grains have increased associated with the growth in ND support the surface-energy-related mechanism. As for the factor (d), it should be emphasized that sample surfaces have
Depth from Surface
Solute Co
ncentration
ξ
C2
Cα
Surface
Single phase
α Region
[image:8.595.65.272.596.746.2]α and γ Two Phase Region
been kept free from oxidation during decarburization. It is known for Fe–3%Si18) that the surface conditions under which the formation of oxide layers is suppressed while foreign atoms such as oxygen and sulfur are adsorbed are important to lower the surface energy of {100} planes. The observed surface conditions appear to satisfy those condi-tions, since some oxygen atoms would be always supplied onto specimen surfaces through the reaction of eq. (1) while the formation of oxide layers is avoided. Therefore surface energy is the most plausible driving force to account for the observed evolution of texture.
It is then naturally thought that the alignment of h012i directions with RD is caused by the presence of texture in the
islands that may serve as nuclei for columnar grain growth. Hayeret al.19)reported that a {100}h012i texture appeared when ultra low carbon steels were cold-rolled at a large thickness reduction over 90% and recrystallized upon annealing. Since the reduction of cold rolling in this experiment is also rather high around 91%, the recrystalliza-tion after cold rolling could also provide the recrystallized matrix with a sizable amount of {100}h012itexture compo-nent. In fact, a {100} texture component has been identified as a subdominant component after primary recrystallization prior to decarburization, although the in-plane orientation of the component has not been determined. Probably such a {100}h012i component was inherited into the texture of
islands and it acted as nuclei for the {100}h012i texture evolution.
4.4 Formation of domains with different texture variants
Finally let us consider what has caused the formation of domains in which grains are aligned with a single variant of {100}h012itexture, (100)[012] or (100)[021]. Since the two texture variants have been more or less homogeneously distributed in the early stages of decarburization (see Fig. 9), the domain formation should not be attributed to the inhomogeneity of the texture in islands but be searched for in the growth process of columnar grains. Surface energy does not take effect in this case since surface energy never changes by such domain formation. It is seen in Fig. 10 that the amount of high angle boundary, which are in general of high energy, is considerably smaller than that in the case where the two texture variants are homogeneously distrib-uted. The role of grain boundary energy, therefore, need to be
considered to account for the domain formation. In the later stages of columnar grain growth where the number of {100}h012i-oriented grains considerably increases and they grow further at the expense of neighboring {100}h012i -oriented grains, the effect of grain boundary energy might manifest itself.
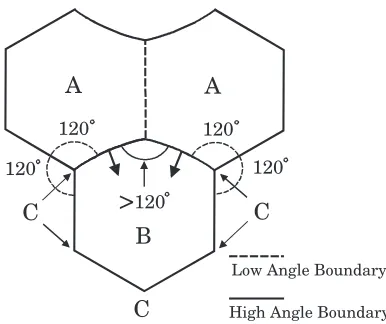
In Fig. 15, one of the simplest cases of the impingement of {100}h012i-oriented columnar grains to be considered is illustrated, where three 6-sided grains impinge around a triple point at the center. Here the two grains denoted as A are oriented in the same texture variant, while the other denoted as B is oriented in the different texture variant. Then two of the three boundaries meeting at the center triple point are of high angles,i.e., of high tension, whereas the other boundary is of a low angle. In order for grain boundary tension to balance at the triple point, the angle made between the two high angle boundaries meeting at the triple point has to be larger than 120. If the angles made between boundaries meeting at the triple points denoted as C are 120, the grain B always has two convex sides and thus tends to shrink. It is understood from this consideration that if an aggregate of {100}h012i-oriented grains of a single variant is formed, the aggregate tends to grow consuming the adjoining non-aggregated {100}h012i-oriented gains of the different var-iant. Hence, the aggregation of {100}h012i-oriented grains of a single variant gradually proceeds and eventually the domain structure as observed in this experiment is formed.
5. Conclusions
The decarburization of silicon steel sheets by SiO2and the texture developed upon decarburization have been studied. The study has led to the following conclusions.
(1) As the sheet steels of 0.35 mm thickness which contain about 3% of silicon, 1% of manganese and 0.05% of carbon are laminated with in-between separators con-taining SiO2and annealed under a reduced pressure at elevated temperatures above 1300 K, a marked dec-arburization down to 0.001% of carbon concentration occurs. No oxidation of silicon and manganese as well as iron takes place during decarburization. The dec-arburization is thought to be caused by the
thermo-120 120 120
>
120Low Angle Boundary
High Angle Boundary
A
A
B
C
C
120
[image:9.595.328.521.69.231.2]C
Fig. 15 Schematic representation of in-plane view of impingement of three {100}h012i-oriented columnar grains.
Growth in Axial Directions due to Decarburization
Growth in Radial Directions Low Surface Energy {100} Grain
Sheet Surface
α/γ Two Phase Structure
[image:9.595.65.271.76.201.2]chemical reaction described as 2C+SiO2!Si+2CO. (2) During decarburization, silicon concentration slightly
increases and manganese concentration decreases. The increase in silicon concentration is ascribed to the dissolution of silicon into steels in accordance with the above reaction. The decrease in manganese concentra-tion is likely to be caused by vaporizaconcentra-tion of manga-nese.
(3) Induced by the phase transformation fromtodue to the above chemistry change, the columnar grains develop from sheet surfaces toward the center of sheet thickness. During the columnar grain growth, a {100}h012i texture greatly evolves and becomes the strongest single component.
(4) The texture development is enhanced by the addition of TiO2 powder into separators, although decarburization is somewhat retarded by the presence of TiO2. After complete decarburization, the sheet materials consist of grains of about 0.6 mm diameter, more than 90% of which are closely aligned with {100}h012iorientation. (5) In the later stages of the texture evolution, convoluted domains of a few mm in width are formed, in which dozens of grains are aligned with a single variant of the {100}h012itexture, (100)[012] or (100)[021].
(6) The texture development is most likely to be due to the orientation dependence of surface free energy under an oxidation-free surface condition. The alignment of h012i directions with RD is ascribed to the primary recrystallization of cold-rolled structures before dec-arburization, which provides {100}h012i-oriented nu-clei to the surface-energy-driven selective growth.
Acknowledgments
The author gratefully acknowledges instructive discus-sions with Dr. Taiji Nishizawa (Professor Emeritus of
Tohoku University), Dr. Shigeharu Hinotani, Dr. Yasuhiro Maehara and Dr. Naoyuki Sano with R&D Laboratories of Sumitomo Metal Industries Ltd. He also wishes to thank Mr. Shigeo Uenoya with the R&D Laboratories for his helpful advices and assistance in experimental work.
REFERENCES
1) H. Abe and K. Ito: J. Japan Inst. Metals32(1968) 927–932. 2) K. Ito: Trans. ISIJ11(1971) 86–94.
3) G. T. Higgins, M Fang and R. De Young:Proc. 4th Int. Conf. on Texture, (Cambridge, July, 1975) pp. 54–63.
4) T. Tomida and T. Tanaka: Tetsu-to-Hagane´79(1993) 1350–1355. 5) T. Tomida and T. Tanaka: ISIJ Int.35(1995) 548–556.
6) T. Tomida: J. Mater. Eng. Perform.5(3)(1996) 316–322.
7) K. Azuma, H. Abe, S. Goto, K. Ito and Y. C. Wu: J. Japan Inst. Metals 31(1967) 1034–1035.
8) R. G. Aspden, J. A. Berger and H. E. Trout: Acta Metall.16(1968) 1027–1035.
9) O. Hashimoto and S. Satoh and T. Tanaka: Tetsu-to-Hagane´66(1980) 102–111.
10) O. Hashimoto and S. Satoh and T. Tanaka: Tetsu-to-Hagane´66(1980) 112–121.
11) T. Tomida, S Uenoya and N. Sano: Mater. Trans.44(2003) 1106–1116. 12) R. Hultgren, R. L. Orr, P. D. Anderson and K. K. Kelley: see O. Kubaschewski, E. Ll. Evans and C. B. Alcock: Metallurgical Thermochemistry, 4th edition, Japanese translation, (Pergamon Press, England, 1967; Sangyo Tosho, Tokyo, 1968) p. 339.
13) O. Kubaschewski, E. Ll. Evans and C. B. Alcock: Metallurgical Thermochemistry, 4th edition, Japanese translation, (Pergamon Press, England, 1967; Sangyo Tosho, Tokyo, 1968) pp. 183–192.
14) B. Sundman, B. Jansson and J.-O. Andersson:CALPHAD9(1985) 153. 15) T. Nishizawa: Bulletin Japan Inst. Metals12(1973) 401–417. 16) F. D. Richardson: Physical Chemistry of Melts in Metallurgy,
(Academic Press, London, 1974) pp. 483–487.
17) C. Wagner: see W. Jost: Diffusion in Solids, Liquids, and Gasses, (Academic Press Inc., New York, 1960) pp. 69–77.
18) E. D. Hondros and L. E. Stuart: Philos. Mag.17(1968) 711–727. 19) R. H. Heyer, D. E. McCabe and J. A. Elias:Flat Rolled Products, III,