Supported by the Czech Science Foundation (Grant No. S13-04580) and by the Internal Grant Agency of the Czech University of Life Sciences Prague (Project No. 20142053).
Effect of selenium-enriched defatted rape seeds on tissue
cadmium and essential elements utilization in rats
A. Myška
1, J. Száková
1, A. Fučíková
1, P. Mlejnek
2, V. Zídek
2, J. Tremlová
1,
O. Mestek
3, R. Koplík
4, J. Zídková
4, M. Melčová
4, P. Tlustoš
11Faculty of Agrobiology, Food and Natural Resources, Czech University of Life Sciences Prague, Prague, Czech Republic
2Institute of Physiology, Czech Academy of Sciences, Prague, Czech Republic
3Faculty of Chemical Engineering, University of Chemistry and Technology Prague, Prague, Czech Republic
4Faculty of Food and Biochemical Technology, University of Chemistry and Technology Prague, Prague, Czech Republic
ABSTRACT: The effect of selenium-enriched defatted rapeseeds (DRS) added to the diet on Se uptake by rat organisms (whole blood, liver, kidney) was investigated in model conditions. Additionally, the response of other essential trace and major mineral elements (Cu, Ca, Fe, K, Mg, Mn, P, S, and Zn) in rat organisms on selenium and/or DRS addition was assessed. The experimental diets for the individual experimental groups were prepared as follows: group DRS 0 (control diet), group DRS 30 (30% of soybean meal in the diet replaced with DRS), group DRS60 (60% of soybean meal in the diet replaced with DRS), and group DRS100 (100% of soybean meal in the diet replaced with DRS), either unenriched or naturally fortified with Se. Whereas Se con-tent in the blood and liver of the animals remained unchanged, increased Se levels were observed in kidney of the selenized DRS100 group compared to the others. Moreover, the results showed decreasing Cd content in the rat liver with increasing Se content in the diet, confirming antagonism of these elements. Concerning the essential elements, the application of the selenized DRS did not result in any serious imbalance in the utilization of these elements. In contrast, Se addition seems to be helpful for the improved utilization of essential elements such as P, S, and Zn, compared to the DRS-containing diet without Se fortification.
Keywords:Se; Brassica napus; fortification; Rattus norvegicus; trace and major minerals
INTRODUCTION
Selenium (Se) is an essential trace element in-volved in various biochemical and physiological processes. However, there is a narrow range be-tween essential and toxic levels in animals and humans (Kieliszek and Blazejak 2013). Se is in-corporated into proteins to make selenoproteins, some of which are important antioxidant enzymes. The antioxidant properties of selenoproteins help
in-creased risk of mortality, poor immune function, and cognitive decline (Rayman 2012). There is increasing evidence that the harmful effects of the sub-optimal Se intake would significantly decline if additional Se was made available either through supplementation or fortification of certain foods (Schrauzer 2009). However, the unregulated intake of dietary or pharmacological Se supplements, mainly in inorganic form, has potential to expose the body tissues to toxic levels of Se with subsequent negative consequences for DNA integrity (Brozmanova et al. 2010). There are various approaches for dietary Se supplementation, where the addition of selenized yeast is frequently considered as the efficient one, because yeast species such as Saccharomyces cer-evisiae, Candida utilis, and Yarrowia lipolytica are able to accumulate substantial amount of Se in their cells (Rayman 2004; Kieliszek and Blazejak 2013; Kieliszek et al. 2015).
Increased dietary intake of Se can result in various changes in the uptake and accumulation of other essential elements. The intensity of the inter-element interactions in rat organisms depends on the intake of individual elements. Yu and Beynen (2001) combined low, normal, and high levels of Cu and Se in the rat diet. In rats fed either low or nor-mal amounts of Se, higher intake of Cu decreased Se absorption and increased urinary excretion. In contrast, no similar effects were observed in rats fed the high-Se diet. The elevated Cu content in the diet resulted in increased Se content in liver and kidney of rats fed the normal Se diet; interestingly, no effects were reported for low or high levels of Se in the diet. Similarly, Monedero-Prieto et al. (2014) investigated the response of Se supplemen-tation in rats on Zn, Fe, Cu, and Mn levels in liver and muscle, as well as urinary excretion of these elements (Zn, Cu, Fe, and Mn) under oxidative stress (protein deficiency). Alterations in excre-tion and/or tissue deposiexcre-tion were observed only in the case of Cu and Fe. Dietary supplementation with Se and Zn resulted in increasing Se content in lumbar muscle of lambs, whereas Zn content remained unchanged (Gabryszuk et al. 2007). Special attention was paid to the Se interaction with toxic elements, especially Cd. Sasakura and Suzuki (1998) proved complexation mechanisms of Cd with selenoprotein P. Lazarus et al. (2009) showed a more substantial decrease in blood Cd and Se in rats exposed to both elements compared to those exposed to them individually. In the rat liver,
Cd accumulation decreased in Se-supplemented animals compared to the rats exposed solely to Cd, as well. Thus, a decrease of Cd deposition in rat tissues due to the Se application seems to be one of the mechanisms working against Cd toxic effects. The abovementioned results indicate that the potential inter-element interactions should be taken into account when investigating the beneficial effects of Se supplementation in the animal diet. Some regions in Europe including the Czech Republic are characterized by low soil Se levels. Szakova et al. (2015) determined the Se content in the above-ground biomass of wild plant spe-cies growing in two uncultivated meadows at two different locations with low Se content in the soil. This factor, together with low plant availability, resulted in low Se content in the above-ground biomass of plants, regardless of location, soil pa-rameters, and Se level in the soil. As verified by Broadley et al. (2010) in field conditions, a foliar application of 10 g Se (applied as selenate) per ha would increase the Se concentration in wheat grain 10-fold from current ambient levels. Therefore, this approach seems to be effective for crop Se biofortification. Brassica species are efficient in Se accumulation and therefore are good sources for Se biofortification purposes. The Se specia-tion analyses were performed in the selenized and non-selenized rapeseed plants (Brassica napus) and selenate, selenocysteine, Se-methylseleno-cysteine, and one as yet unidentified Se species were found in extracts of control plants. In addi-tion, the extracts of the fortified plant contained selenomethionine (Klognerova et al. 2015). The results indicated the effect of climatic conditions and soil physicochemical parameters on the pro-portional representation of each species, as well. The residual fraction obtained after oil process-ing of Brassica seeds, defatted rapeseeds (DRS), is an important protein source in animal diets where imported soybean meal can be effectively replaced. High accumulation of Se in the seeds and meal (1.92–1.96 μg Se/g ) was detected. The Se speciation studies showed that up to 85% of the total Se in the meal was selenomethionine, whereas other Se species were not identified (Seppanen 2010). Similarly, Balan et al. (2014) determined selenomethionine as the predominant Se species in the rapeseed meal.
(represent-ing 15% of the total diet) in the rat diet did not show any harmful effect on the biochemical and haematological response of the rat organisms. Moreover, Banuelos and Mayland (2000) reported increased Se values in blood and excreta of cows fed Se-enriched dried Brassica napus aboveground biomass (containing approximately 3.5 mg Se/kg in dry matter). Thus, the addition of the selenized DRS could be an effective measure to increase the selenium status of farm animals in the Czech Republic. In the present work, the effect of Se-enriched DRS added to diet on the Se uptake by rat organisms was investigated under model condi-tions. Additionally, the response of other essential and toxic elements in rat bodies to Se and/or DRS addition was assessed, too.
Hypothesis: the optimized rate of selenized DRS in the rat diet will not affect the uptake or distri-bution of essential major and trace elements in the rat organism, whereas levels of toxic elements (especially Cd) will decrease.
MATERIAL AND METHODS
Experimental design. Male Wistar Kyoto rats
(average body weight ~200 g) were obtained from the breeder (Velaz, Prague, Czech Republic) at 30 days of age and housed in cages (one animal per cage) in a room with controlled temperature (23–25°C) under natural light conditions. The experiment was repeated twice. In the first experi-ment (called Control DRS), the untreated DRS was applied. In the second experiment (called selenized DRS), the DRS was prepared from the rapeseed treated by foliar application of Na2SeO4 in the Se amount corresponding to a rate of 50 g Se/ha. For the control DRS experiment, 24 animals were used, and the animals were randomly divided into four groups of six animals each. For the selenized DRS experiment, 32 animals divided in four groups of eight animals each were used; the animals were fed a semi-synthetic diet according to the experi-mental design for 47 days in the case of the control DRS experiment and for 60 days in the case of the selenized DRS experiment, respectively. Feed and water were supplied to the animals ad libitum. Feed consumption and body weight of the animals were monitored weekly.
The control group was fed with the untreated semi-synthetic diet consisting of 50% wheat coarse meal, 13% fish meal, 14% soybean meal, 0.28% CaHPO4,
1.12% limestone, 4% alfalfa hay, 1% mineral ad-ditives (AMINOVITAN STER PLUS, Biofaktory Ltd., Prague, Czech Republic), 7.5% feeding yeast, 4.5% wheat germ, and 10% oat meal. In the case of DRS-treated groups, defined portions of soybean meal were replaced by the defatted DRS prepared from the oilseed rapeseeds of the 00-quality variety NK Oktans as follows: the seeds were milled and defatted in the Soxhlet apparatus (P-LAB, Prague, Czech Republic) using hexane as the extraction agent for 4 h. Subsequently, the meal was dried at 105°C for 2 h and homogenized. The individual experimental groups were given the following ex-perimental diets: group DRS0 (control diet), group DRS30 (30% of soybean meal in the diet replaced with DRS), group DRS60 (60% of soybean meal in the diet replaced with DRS), and group DRS100 (100% of soybean meal in the diet replaced with DRS). The nutritional characteristics of the DRS were as follows: proteins 30.5%, lipids 2.5%, metabolizable saccharides 18.4%, dietary fibre 35.4%, ash 6.7%, water 6.5%, metabolizable energy 938 kJ/100 g.
At the end, the animals were euthanized by ex-sanguination after being anesthetized with Xylapan (xylazine) and Narketan (ketamine), and whole blood and liver were sampled. The sampled tissues were kept at –18°C and freeze-dried; aliquots of blood samples were stored in heparinized tubes.
Analytical methods.For the determination of
element levels in freeze-dried and homogenized animal tissues and diets, an aliquot (~500 mg of dry matter) of the sample was weighed in a di-gestion vessel. Concentrated nitric acid (8.0 ml) (Analytika Ltd., Prague, Czech Republic) and 30% H2O2 (2.0 m) (Analytika Ltd.) were added. The mixture was heated in an Ethos 1 (MLS GmbH, Leutkirch im Allgäu, Germany) microwave-assisted wet digestion system for 30 min at 220°C. After cooling, the digest was quantitatively transferred to a 25 ml glass tube, topped up with deionized water, and kept at laboratory temperature until measurements were taken. For the element mea-surements of whole blood, the same decomposi-tion procedure was applied, where 0.3 ml of the whole-blood sample was taken for the analysis.
nebu-lizer. Inductively coupled plasma-atomic emission spectrometry (ICP-OES) (Agilent 720; Agilent Technologies Inc.) equipped with a two-channel peristaltic pump, a Struman–Masters spray cham-ber, and a V-groove pneumatic nebulizer made of inert material was applied for the determination of Cd, Cu, Fe, Mn, Zn, P, and S levels in the di-gests. The experimental conditions were as fol-lows: power of 1.2 kW, plasma flow of 15.0 l/min, auxiliary flow of 0.75 l/min, nebulizer flow of 0.9 l/min. Flame atomic absorption spectro- metry (F-AAS) (Varian 280FS; Varian Australia Pty Ltd., Mulgrave, Australia; air flow of 13.5 l/min, acetylene flow of 2.2 l/min, burner height of 13.5 mm, nebulizer uptake rate of 5 ml/min) was used for Ca, Mg, and K determination in the digests.
Statistical analysis.The analytical data were
processed using MS Excel 2007 and STATISTICA 12 CZ statistical software. One-way analysis of vari-ance (ANOVA) at a significvari-ance level of α = 0.05 followed by Tukey’s test were applied to the data.
RESULTS AND DISCUSSION
Se and other essential element uptake by rats.
The addition of both selenized and non-selenized DRS did not significantly affect the body weight of the animals at the end of the experiment. Animal weight was 463 ± 28 g for group DRS30 and 500 ± 46 g for DRS100 without any significant differ-ence for control DRS. Animal weight was 496 ± 44 g for group DRS60 and 545 ± 65 g for DRS100 without any significant difference for selenized DRS regardless of the DRS rate. Therefore, in ac-cordance with reported studies (Hill 1991; Smithard 1993), our results confirm that in the temperate climate, DRS can replace soybean meal as the most important protein-rich feed component. Table 1 indicates that the DRS addition did not result in any significant change in trace or major element content in the experimental diet, except the stepwise increase in Se level in the selenized DRS experiment. With regard to toxic elements, the diets contained detectable levels of Cd varying between 0.16 ± 0.03 mg/kg for DRS0 and 0.13 ± 0.01 mg/kg for DRS100, without any significant difference between the experimental groups. To evaluate the risk associated with Cd content, the results were compared with Directive 2002/32/EC on undesirable substances in animal feed, which
sets the maximum permissible limit of Cd for feed-ing mixtures of 1 mg/kg. Although the Cd levels in the diets were far below this limit, its impact on Cd accumulation in rat tissue was assessed within this investigation.
The element levels in the whole blood of animals are summarized in Table 2, showing a negligible effect of the control DRS on element levels. Al-though the Se blood levels remained unchanged within the selenized DRS experiment, substan-tial changes in some elements were observed. Fe content significantly (P < 0.05) decreased in the DRS100 group compared to the DRS0 group (by 20%), suggesting Se–Fe antagonism (Watts 1994). Similarly, decreasing concentrations in whole blood with increasing Se content in the diet were observed for other elements such as Mg, Mn, and P, whereas K concentrations tended to increase in the DRS30 and DRS60 groups. No Se-induced changes were observed for blood levels of Cu and Zn, the other elements involved in antioxidative processes. Similar observations were reported by Tomza-Marciniak et al. (2011) for the blood of cattle. The authors reported an insignificant decrease in the mentioned elements only. As far as Ca and S are concerned, their concentrations in rat blood remained unchanged.
Ta ble 2. Elemen t c on ten ts in whole blo
od of ra
ts ac cor ding t o t he inc re asing def at te d ra pe se ed s ( DR S) ra te
(mg/kg of dr
y ma
tter) in t
he die
t
1. The a
verage
s mar
ke
d
by t
he same le
tter did not sig
nific an tly diff er a t P
< 0.05 w
ithin indiv idu al c olumns ; d at a ar e pr es en te d a s me
an ± st
and ar d de vi ation ( n = 3) Se (mg/kg) C a (mg/kg) C u (mg/kg) Fe (mg/kg) K (mg/kg) M g (mg/kg) Mn (mg/kg) P (mg/kg) S (mg/kg) Z n (mg/kg) Control DR S ( n = 6) DR S0
0.511 ± 0.104
a
56.3 ± 6.1
a
0.935 ± 0.006
a
381 ± 17
a
1 297 ± 102
a
31.7 ± 2.3
a
0.623 ± 0.031
a
367 ± 18
a
1 416 ± 56
a
4.38 ± 0.70
a
DR
S30
0.487 ± 0.075
a
58.3 ± 8.3
a
0.957 ± 0.032
a
369 ± 15
a
1 356 ± 61
a
30.8 ± 2.8
a
0.610 ± 0.041
a
351 ± 30
a
1 403 ± 36
a
3.91 ± 0.30
a
DR
S60
0.475 ± 0.119
a
56.5 ± 5.1
a
1.05 ± 0.09
a
405 ± 12
a
1 433 ± 61
a
32.4 ± 2.2
a
0.624 ± 0.015
a
377 ± 24
a
1 531 ± 35
a
4.47 ± 0.27
a
DR
S100
0.461 ± 0.143
a
54.7 ± 2.8
a
0.968 ± 0.157
a
353 ± 65
a
1 310 ± 39
a
31.9 ± 6.3
a
0.586 ± 0.108
a
357 ± 67
a
1 401 ± 26
a
3.7 ± 0.80
a Seleni ze d DR S ( n = 8) DR S0
0.241 ± 0.04
a
37.5 ± 8.5
a
0.764 ± 0.060
a
416 ± 26
b
2 920 ± 453
a
29.8 ± 3.0
a
0.387 ± 0.050
b
312 ± 37
a
1 347 ± 51
a
2.39 ± 0.62
a
DR
S30
0.270 ± 0.015
a
43.5 ± 9.3
a
0.781 ± 0.071
a
423 ± 5
b
3 620 ± 306
b
30.6 ± 3.1
a
0.368 ± 0.046
ab
303 ± 39
ab
1 461 ± 65
a
2.53 ± 0.50
a
DR
S60
0.231 ± 0.046
a
39.4 ± 5.7
a
0.717 ± 0.067
a
376 ± 14
ab
3 458 ± 550
ab
26.6 ± 3.1
ab
0.220 ± 0.022
a
269 ± 25
ab
1 298 ± 29
a
2.18 ± 0.49
a
DR
S100
0.232 ± 0.035
a
47.3 ± 2.4
a
0.702 ± 0.09
a
325 ± 23
a
3 090 ± 504
ab
24.6 ± 3.4
b
0.280 ± 0.010
a
257 ± 44
b
1 239 ± 84
a
2.34 ± 1.64
a
1 DR
S 0 (
con
tr
ol die
t), DR
S 30 (30% of s
oy
be
an me
al in t
he die t r epl ac ed w ith DR S), DR
S60 (60% of s
oy
be
an me
al in t
he die t r epl ac ed w ith DR S), DR
S100 (100% of s
oy
be
an
me
al in t
he die t r epl ac ed w ith DR S) unenr ic he d (Con tr ol DR
S) or na
turally f or tifie d w ith S e (S eleni ze d DR S) Ta ble 1. Elemen t c on ten ts in the e xp er imen tal die ts
1 ac
cor ding t o t he inc re asing def at te d ra pe se ed s (DR S) rat
e (mg/kg of dr
y ma
tt
er). The a
verage
s mar
ke
d by t
he
same le
tter did not sig
nific an tly diff er a t P
< 0.05 w
ithin indiv idu al c olumns ; d at a ar e pr es en te d a s me an ± st and ar d de vi ation ( n = 3) Se (mg/kg) C a (mg/kg) C u (mg/kg) Fe (mg/kg) K (mg/kg) M g (mg/kg) Mn (mg/kg) P (mg/kg) S (mg/kg) Z n (mg/kg) Control DR S DR S0
0.354 ± 0.012
a
12 453 ± 69
a
6.23 ± 0.32
a
286
±
69
a
7 889 ± 115
a
1 832 ± 61
a
46.5 ± 2.6
a
9 211 ± 85
a
2 596 ± 99
a
49.6 ± 5.2
a
DR
S30
0.328 ± 0.021
a
13 250 ± 277
a
6.12 ± 0.11
a
312
±
62
a
8 265 ± 559
a
1 845 ± 38
a
48.6 ± 9.2
a
8 695 ± 225
a
2 854 ± 126
a
44.5 ± 0.8
a
DR
S60
0.336 ± 0.008
a
12 985 ± 698
a
5.96 ± 0.69
a
259
±
25
a
8 125 ± 255
a
1 712 ± 59
a
49.3 ± 5.4
a
8 126 ± 7.6
a
2 854 ± 68
a
55.3 ± 7.3
a
DR
S100
0.345 ± 0.007
a
13 259 ± 452
a
5.86 ± 0.36
a
325
±
16
a
8 214 ± 77
a
1 851 ± 85
a
48.3 ± 4.2
a
7 996 ± 59
a
2 755 ± 36
a
47.3 ± 6.0
a Seleni ze d DR S DR S0
0.398 ± 0.009
a
11 585 ± 409
a
6.65 ± 0.13
a
203 ± 25
a
8 693 ± 22
a
1 923 ± 51
a
45.9 ± 0.3
a
8 606 ± 34
a
2 414 ± 125
a
54.6 ± 4.3
a
DR
S30
0.402 ± 0.043
a
12 743 ± 747
a
5.59 ± 1.11
a
243 ± 53
a
8 533 ± 685
a
1 714 ± 318
a
47.9 ± 8.6
a
9 093 ± 189
a
2 192 ± 436
a
43.1 ± 8.5
a
DR
S60
0.520 ± 0.013
b
13 114 ± 228
a
6.01 ± 0.17
a
196 ± 16
a
7 595 ± 87
a
1 683 ± 229
a
46.2 ± 0.7
a
8 797 ± 9
a
2 787 ± 363
a
52.3 ± 7.8
a
DR
S100
0.600 ± 0.014
b
13 991 ± 58
a
4.61 ± 0.06
a
227 ± 5
a
7 524 ± 140
a
1 681 ± 99
a
45.7 ± 3.0
a
8 983 ± 156
a
2 542 ± 127
a
49.5 ± 1.8
a
1DR
S 0 (
con
tr
ol die
t), DR
S 30 (30% of s
oy
be
an me
al in t
he die t r epl ac ed w ith DR S), DR
S60 (60% of s
oy
be
an me
al in t
he die t r epl ac ed w ith DR S), DR
S100 (100% of s
oy
be
an
me
al in t
he die t r epl ac ed w ith DR S) unenr ic he d (Con tr ol DR
S) or na
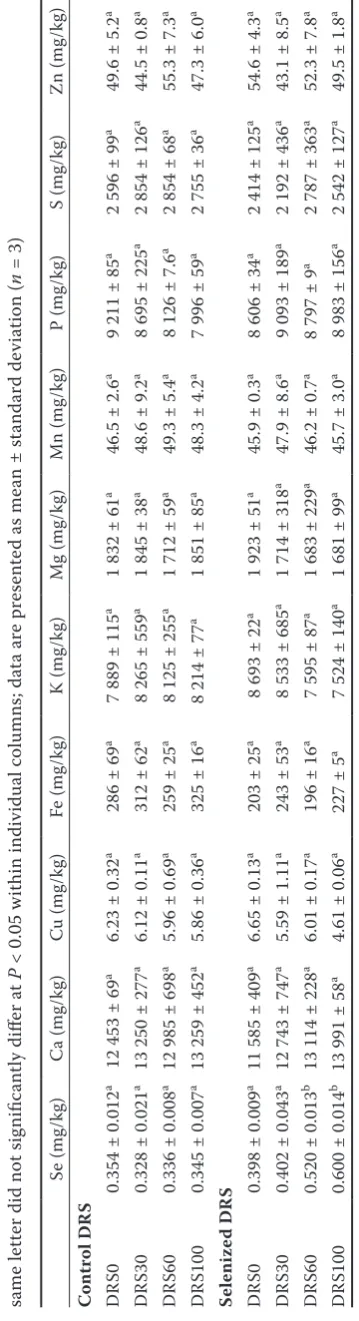
[image:5.595.73.253.101.763.2]Ta ble 3. Elemen t c on ten ts in ra t k idne y ac cor ding t o t he inc re asing def at te d ra pe se ed s ( DR S) ra te
(mg/kg of dr
y ma
tter) in t
he die
t
1 .The a
verage
s mar
ke
d by t
he
same le
tt
er did not sig
nific an tly diff er a t P
< 0.05 w
ithin indiv idu al c olumns ; d at a ar e pr es en te d a s me an ± st and ar d de vi ation Se (mg/kg) C a (mg/kg) C u (mg/kg) Fe (mg/kg) K (mg/kg) M g (mg/kg) Mn (mg/kg) P (mg/kg) S (mg/kg) Z n (mg/kg) Control DR S ( n = 6) DR S0
7.89 ± 1.30
a
270 ± 38
a
41.6 ± 8.2
b
189 ± 10
a
9 655 ± 287
a
602 ± 13
a
2.81 ± 0.04
a
9 227 ± 154
a
8 648 ± 163
a
74.1 ± 2.9
a
DR
S30
7.62 ± 0.83
a
253 ± 18
a
32.7 ± 7.6
ab
202 ± 23
a
9 239 ± 173
a
630 ± 55
a
2.96 ± 0.26
a
9 512 ± 869
a
9 267 ± 139
a
74.8 ± 6.2
a
DR
S60
7.07 ± 0.83
a
285 ± 25
a
35.7 ± 5.1
ab
203 ± 11
a
9 203 ± 95
a
644 ± 45
a
3.53 ± 0.13
b
9 679 ± 685
a
9 437 ± 187
a
78.5 ± 5.6
a
DR
S100
7.79 ± 0.99
a
261 ± 16
a
27.7 ± 5.6
a
195 ± 25
a
9 362 ± 77
a
643 ± 35
a
3.29 ± 0.19
b
9 346 ± 482
a
9376 ± 179
a
77.2 ± 1.6
a Seleni ze d DR S ( n = 8) DR S0
6.42 ± 0.43
ab
258 ± 36
a
33.1 ± 4.6
a
285 ± 32
a
8 627 ± 418
a
781 ± 25
ab
2.54 ± 0.16
a
10 790 ± 329
ab
8 779 ± 197
a
72.1 ± 6.5
a
DR
S30
6.74 ± 0.81
ab
360 ± 99
b
35.0 ± 4.0
a
286 ± 43
a
9 220 ± 522
ab
864 ± 53
b
2.89 ± 0.43
a
12 016 ± 770
b
9 663 ± 920
a
86.4 ± 10
b
DR
S60
5.97 ± 0.40
a
246 ± 34
a
33.4 ± 4.6
a
236 ± 24
ab
8 749 ± 641
a
789 ± 41
ab
2.71 ± 0.38
a
11 555 ± 432
ab
9 379 ± 681
a
78.4 ± 3.4
ab
DR
S100
7.68 ± 0.63
b
295 ± 74
ab
32.8 ± 9.5
a
209 ± 47
b
9 701 ± 564
ab
690 ± 15
a
2.85 ± 0.72
a
10 303 ± 665
a
8 925 ± 264
a
72.8 ± 11
a
1DR
S 0 (
con
tr
ol die
t), DR
S 30 (30% of s
oy
be
an me
al in t
he die t r epl ac ed w ith DR S), DR
S60 (60% of s
oy
be
an me
al in t
he die t r epl ac ed w ith DR S), DR
S100 (100% of s
oy
be
an
me
al in t
he die t r epl ac ed w ith DR S) unenr ic he d (Con tr ol DR
S) or na
turally f or tifie d w ith S e (S eleni ze d DR S) Ta ble 4. Elemen t c on ten ts in
liver of ra
ts ac cor ding t o t he inc re asing def at te d ra pe se ed s ( DR S) ra te
(mg/kg of dr
y ma
tt
er) in t
he die
t
1.The a
verage
s mar
ke
d by t
he
same le
tter did not sig
nific an tly diff er a t P
< 0.05 w
ithin indiv idu al c olumns ; d at a ar e pr es en te d a s me an
± standard deviation
Se (mg/kg) C a (mg/kg) C u (mg/kg) Fe (mg/kg) K (mg/kg) M g (mg/kg) Mn (mg/kg) P (mg/kg) S (mg/kg) Z n (mg/kg) Control DR S ( n = 6) DR S0
3.55 ± 0.28
a
123 ± 2
a
12.3 ± 0.5
a
348 ± 31
a
9 234 ± 160
a
578 ± 38
a
6.10 ± 0.54
a
9 125 ± 613
a
8 022 ± 624
ab
83.8 ± 9.0
b
DR
S30
3.19 ± 0.22
a
116 ± 12
a
12.4 ± 1.1
a
366 ± 46
a
9 371 ± 465
a
570 ± 57
a
6.10 ± 0.54
a
9 002 ± 844
a
8 165 ± 901
b
80.4 ± 9.2
ab
DR
S60
3.15 ± 0.29
a
107 ± 6
a
11.8 ± 0.8
a
311 ± 21
a
9 307 ± 440
a
515 ± 16
a
6.04 ± 0.37
a
7 943 ± 239
b
7 092 ± 269
a
69.7 ± 1.8
a
DR
S100
3.26 ± 0.72
a
108 ± 13
a
12.3 ± 0.7
a
329 ± 63
a
9 121 ± 381
a
537 ± 41
a
5.95 ± 0.48
a
8 535 ± 709
ab
7 549 ± 423
ab
79.3 ± 7.3
ab Seleni ze d DR S ( n = 8) DR S0
4.48 ± 0.29
a
142 ± 18
a
11.7 ± 0.8
a
396 ± 88
a
10 707 ± 689
a
619 ± 59
a
6.13 ± 0.66
a
9 707 ± 921
a
8 084 ± 743
a
81.6 ± 8.1
a
DR
S30
4.79 ± 0.49
a
126 ± 17
a
11.3 ± 1.1
a
357 ± 41
a
10 523 ± 699
a
560 ± 56
a
5.72 ± 0.78
a
8 605 ± 821
a
7 361 ± 793
a
77.3 ± 11.8
a
DR
S60
4.42 ± 0.53
a
129 ± 24
a
11.9 ± 1.2
a
399 ± 68
a
10 527 ± 448
a
566 ± 33
a
5.81 ± 0.80
a
8 701 ± 713
a
7 467 ± 524
a
74.7 ± 6.7
a
DR
S100
4.85 ± 0.53
a
127 ± 22
a
12.3 ± 0.9
a
339 ± 61
a
11 123 ± 259
a
589 ± 64
a
5.79 ± 0.83
a
9 037 ± 185
a
7 544 ± 762
a
78.0 ± 8.5
a
1DR
S 0 (
con
tr
ol die
t), DR
S 30 (30% of s
oy
be
an me
al in t
he die t r epl ac ed w ith DR S), DR
S60 (60% of s
oy
be
an me
al in t
he die t r epl ac ed w ith DR S), DR
S100 (100% of s
oy
be
an
me
al in t
he die t r epl ac ed w ith DR S) unenr ic he d (Con tr ol DR
S) or na
[image:6.595.331.498.98.767.2] [image:6.595.80.259.102.759.2]the available findings are often contradictory. For instance, Lazarus et al. (2009), Ghazi et al. (2012), and Monedero Prieto et al. (2014) concluded that dietary Se had no effect on Zn levels in rats and chicken. Chmielnicka et al. (1988) observed in-creasing Zn content in rats exposed to single-dose applied inorganic Se. These findings indicate that the potential effect of Se on the other essential elements depends on many factors such as ani-mal species, Se dose, Se species applied, single vs long-term Se application etc.
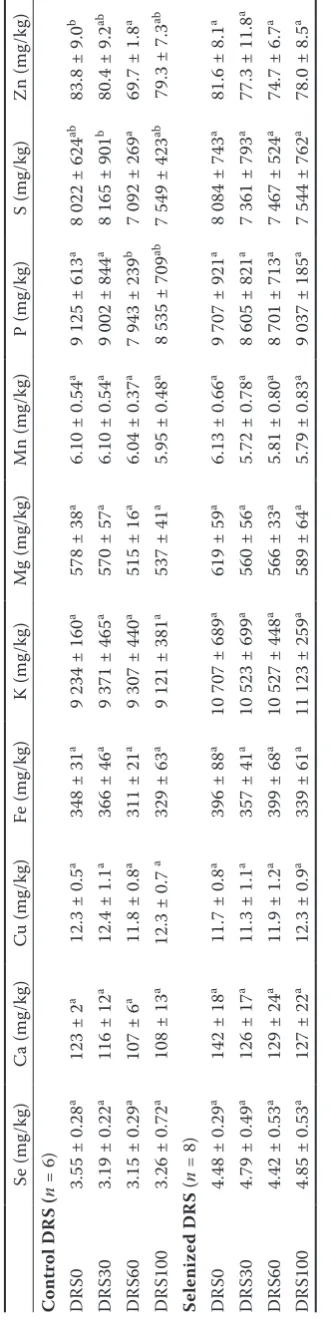
In the rat liver (Table 4), no significant changes in levels of Se or the other elements examined were observed. A slight decrease in P, S, and Zn levels was observed in the control DRS experi-ment, whereas no changes occurred in the case of selenized DRS groups of animals. Therefore, similarly as for kidney, the results indicated that the increased Se intake via the selenized DRS could correct the potential imbalances in uptake and deposition of essential elements caused by the addition of DRS to the diet. These findings are still speculative; therefore, further thorough investigation is needed to confirm or decline this hypothesis.
Interactions of elements in rats according to the
Se uptake.The interactions among the essential
elements as affected by changing Se intake are very variable, confirming the role of Se rate and/ or application mode. The effect of Se deficiency on the rat tissue distribution of the essential trace elements associated with oxidant and/or anti-oxidant processes (i.e. Fe, Mn, Cu, and Zn) was investigated by Giray et al. (2003), who found that especially Fe and Mn levels were the most altered in the investigated tissues. The age-dependent changes in Fe and Zn levels in rat liver under Se deficiency were reported by Matsumoto et al. (2009). However, no changes in Fe or Zn levels in the liver of Se-deficient rats were observed by Kotyzova et al. (2010). In contrast to Fe and Zn, the Cu levels in rat liver tissue increased as a result of Se deficiency. Yamasaki et al. (2011) observed decreased biliary excretion of Se, As, Mn, Fe, and Zn under Se-deficient conditions compared with that in normal rats and the enhanced biliary ex-cretion of Mn and As in Se-adequate conditions. These observations were related to the element complexation with glutathione (GSH). Chalabis-Mazurek and Walkuska (2014) investigated the potential impact of Se dietary supplementation
(0.2 mg Se/day/animal) on the essential element levels in the serum and liver of lambs. They ob-served that the Se supplementation significantly increased the Se concentration in both serum and liver of lambs but altered the levels of other es-sential trace elements such as Mn, Zn, Cu, and Fe. The decrease in Zn, Cu, and Fe and the increase in Mn levels in the liver were reported in their experi-ment, while the decrease of Cu and Fe levels even indicated the state of deficiency. Improvement of reproduction parameters (i.e. testis index, sperm count and motility, sperm malformation, etc.) of male rats orally exposed simultaneously to Se and Zn was observed by Yu et al. (2014). Predominantly, these results are based on relatively high Se sup-plementation levels, whereas our investigation simulated the real situation connected with the application of selenized DRS.
In our experiment, whereas the Cd concentrations in the whole blood were under the detection limits of the analytical technique, the Cd levels in the liver and kidney of the rats seemed to be related to the Se levels in the diet. The Cd levels in the liver within the selenized DRS experiment were 0.09 ± 0.03 mg/kg for DRS0, 0.08 ± 0.01 mg/kg for DRS30, 0.05 ± 0.01 mg/kg for DRS60, and 0.05 ± 0.01 mg/kg for DRS100. The statistical evaluation of the data showed a significant (P < 0.05) decrease in Cd levels with increasing Se rate in the diet. For kidney, the Cd levels within the selenized DRS experiment were 0.10 ± 0.03 mg/kg for DRS0, 0.11 ± 0.04 mg/kg for DRS30, 0.08 ± 0.02 mg/kg for DRS60, and 0.07 ± 0.02 mg/kg for DRS100. Although the differences between the experimental groups were not significant in this case, the results showed a declining Cd content tendency with increasing Se rate, as well. There-fore, the results indicated the protective effect of Se against Cd accumulation in the rat tissues because no changes in Cd levels in liver (varying from 0.08 to 0.09 mg/kg) and kidney (varying from 0.10 to 0.11 mg/kg) of the control DRS group were observed regardless of the DRS rate.
against the Cd-induced decrease of the rate of protein synthesis in mice organs was described by Staneviciene et al. (2014), although Se did not affect the metallothionine content in mouse liver (Bernotiene et al. 2013). Under Cd stress, lower Cd accumulation was found in the livers of the Se-deficient rats compared to those with normal Se intake (Kotyzova et al. 2010); these interactions will need more detailed investigations. The decreasing trend of Cd concentrations in blood serum that followed the increasing Se serum concentrations was reported by Tomza-Marciniak et al. (2011) for cattle living in the unpolluted area. On the con-trary, decreasing Se levels in chicken tissues when animals were exposed to the diet with extremely high (100 mg/kg) levels of Cd were reported (Al-Waeli et al. 2012). Further oxidative damage to the rats exposed to high levels of Cd in drinking water could occur as a result of the increased urinary excretion of Se, Cu, Mn, and Zn, i.e. the elements involved in anti-oxidative processes (Wang et al. 2011). More rarely, a potential synergistic effect of Se and other essential elements was assessed to enhance their protective effect against the Cd-induced oxidative stress. Se is incorporated into proteins to develop selenoproteins, some of which are important antioxidant enzymes, such as glu-tathione peroxidase (GPx), the enzyme playing central role in antioxidative response of the animal organism. Lazarus et al. (2009) observed the effect of Se supplementation of the Cd-exposed suckling rats on GPx activity in brain and kidney of ani-mals. Although not proven by the measurement of the enzymatic activity in this experiment, the engagement of the Se-incorporating enzymes is expectable in this case. The Se and Zn protective effect was investigated by El Heni et al. (2009) in male rats that received Cd, Cd + Zn, Cd + Se or Cd + Zn + Se (200 mg/l Cd + 500 mg/l Zn + 0.1 mg/l Se) in their drinking water, for 35 days. These quantities of Cd resulted in severe histo-logical changes in the liver and kidney of rats (El Heni et al. 2008). The authors stated that Se and Zn together assured more efficient protection of these organs against the observed oxidative stress compared to the elements alone. Moreover, Se and Zn showed a cooperative effect in the protection against Cd-induced structural damage in the rat liver. In our investigation, however, no other re-lationships except those observed for Se and Cd were observed.
CONCLUSION
The experiment presented possible replacement of the soybean meal by the DRS including the effect of selenization of the rapeseed in the diet of rats. The possible interactions of increased Se intake via the selenized DRS with both essential and risk element accumulation in the animal tissues were assessed as well. The results showed significantly decreasing Cd levels in the rat liver with increasing Se content in the diet, confirming antagonism of these elements, whereas the Cd levels in the livers of non-selenized animals remained unchanged. Concerning the essential elements, the levels of P, S, and Zn showed significant decreases in liver with increasing non-selenized DRS proportions in the diet. However, the application of Se-sup-plemented diets did not result in any significant change of the essential element levels in the rat liver, and the application of the selenized DRS did not result in serious imbalance of utilization of these elements. In contrast, Se addition seems to be helpful for better utilization of other essential elements compared to the DRS-containing diet without Se fortification. In further research, these findings need to be supported by an evaluation of the appropriate biochemical processes in rats including the detailed transformation of Se com-pounds within the rat organisms.
Acknowledgement. Correction and
improve-ment of language was provided by Proof-Reading-Service.com Ltd., Devonshire Business Centre, Works Road, Letchworth Garden City SG6 1GJ, United Kingdom.
REFERENCES
Al-Waeli A., Pappas A.C., Zoidis E., Georgiou C.A., Fegeros K., Zervas G. (2012): The role of selenium in cadmium toxicity: interactions with essential and toxic elements. British Poultry Science, 53, 817–827.
Balan J., Vosmanska M., Szakova J., Mestek O. (2014): Spe-ciation analysis of selenium in the defatted rapeseed meal. Chemické Listy, 108, 256–263. (in Czech)
Banuelos G.S., Mayland H.F. (2000): Absorption and distri-bution of selenium in animals consuming canola grown for selenium phytoremediation. Ecotoxicology and En-vironmental Safety, 46, 322–328.
sodium selenite on protein synthesis in mouse liver. Envi-ronmental Toxicology and Pharmacology, 36, 1261–1265. Broadley M.R., Alcock J., Alford J., Cartwright P., Foot I.,
Fairweather-Tait S.J., Hart D.J., Hurst R., Knott P., McGrath S.P., Meacham M.C., Norman K., Mowat H., Scott P., Stroud J.L., Tovey M., Tucker M., White P.J., Young S.D., Zhao F.J. (2010): Selenium biofortification of high-yielding winter wheat (Triticum aestivum L.) by liquid or granular Se fertilisation. Plant and Soil, 332, 5–18.
Brozmanova J., Manikova D., Vlckova V., Chovanec M. (2010): Selenium: a double-edged sword for defense and offence in cancer. Archives of Toxicology, 84, 919–938. Chalabis-Mazurek A., Walkuska G. (2014): Effect of
dif-ferent forms of selenium on trace elements in the blood serum and liver tissue of lambs. Journal of Elementology, 19, 41–53.
Chmielnicka J., Zareba G., Witasik M., Brzeznicka E. (1988): Zinc–selenium interaction in the rat. Biological Trace Element Research, 15, 267–276.
Directive 2002/32/EC of the European Parliament and of the Council of 7 May 2002 on undesirable substances in animal feed. Official Journal of the European Union, L140, 10–22.
Dzobo K., Naik Y.S. (2013): Effect of selenium on cadmium-induced oxidative stress and esterase activity in rat or-gans. South African Journal of Science, 109, Art. No. 965. El-Boshy M.E., Risha E.F., Abdelhamid F.M., Mubarak M.S., Ben Hadda T. (2015): Protective effects of selenium against cadmium induced hematological disturbances, immunosuppressive, oxidative stress and hepatorenal damage in rats. Journal of Trace Elements in Medicine and Biology, 29, 104–110.
El Heni J., Messaoudi I., Hammouda F., Kerkeni A. (2008): Protective effects of selenium (Se) and zinc (Zn) on cad-mium (Cd) toxicity in the liver and kidney of the rat: Histology and Cd accumulation. Food and Chemical Toxicology, 46, 3522–3527.
El Heni J., Messaoudi I., Hammouda F., Kerkeni A. (2009): Protective effects of selenium (Se) and zinc (Zn) on cad-mium (Cd) toxicity in the liver of the rat: Effects on the oxidative stress. Ecotoxicology and Environmental Safety, 72, 1559–1564.
Gabryszuk M., Czauderna M., Baranowski A., Strzalkowska N., Jozwik A., Krzyzewski A.J. (2007): The effect of diet supplementation with Se, Zn and vitamin E on cho-lesterol, CLA and fatty acid contents of meat and liver of lambs. Animal Science Papers and Reports/Polish Academy of Sciences Institute of Genetics and Animal Breeding, 25, 25–33.
Ghazi H.S., Habibiyan M., Moeini M.M., Abhdolmomammadi A.R. (2012): Effects of dietary selenium, vitamin E, and their
combination on growth, serum metabolites, and antioxidant defense system in skeletal muscle of broilers under heat stress. Biological Trace Element Research, 148, 322–330. Giray B., Riondel J., Arnaud J., Ducros V., Favier A., Hincal
F. (2003): Iodine and/or selenium deficiency alters tis-sue distribution pattern of other trace elements in rats. Biological Trace Element Research, 95, 247–258. Hill R. (1991): Defatted rape seeds in the diets of ruminants.
Nutrition Abstracts and Reviews Series B, 61, 139–155. Kieliszek M., Blazejak S. (2013): Selenium: significance, and
outlook for supplementation. Nutrition, 29, 713–718. Kieliszek M., Blazejak S., Gientka I., Bzducha-Wrobel A.
(2015): Accumulation and metabolism of selenium by yeast cells. Applied Microbiology and Biotechnology, 99, 5373–5382.
Klognerova K., Vosmanska M., Szakova J., Mestek O. (2015): Effect of growing conditions on selenium speciation in rapeseed (Brassica napus) tissue. Chemicke Listy, 109, 216–222.
Kotyzova D., Cerna P., Leseticky L., Eybl V. (2010): Trace elements status in selenium-deficient rats – interaction with cadmium. Biological Trace Element Research, 136, 287–293.
Lazarus M., Orct T., Jurasoviae J., Blanusa M. (2009): The effect of dietary selenium supplementation on cadmium absorp-tion and retenabsorp-tion in suckling rats. BioMetals, 22, 973–983. Matsumoto K., Terada S., Ariyoshi M., Okajo A., Hisamatsu A., Ui I., Endo K. (2009): The effect of long-running severe selenium-deficiency on the amount of iron and zinc in the organs of rats. Molecules, 14, 4440–4453.
Monedero-Prieto M.J., Perez J.M., Gonzalez-Reimers E., Hernandez-Perez O., Monereo-Munoz M., Galindo-Martin L., Quintero-Platt G., Abreu-Gonzalez P. (2014): Effects of selenium on liver and muscle contents and urinary excretion of zinc, copper, iron and manga-nese. Biological Trace Element Research, 158, 224–229. Rayman M.P. (2004): The use of high-selenium yeast to raise
selenium status: how does it measure up? British Journal of Nutrition, 92, 557–573.
Rayman M.P. (2008): Food-chain selenium and human health: emphasis on intake. British Journal of Nutrition, 100, 254–268.
Rayman M.P. (2012): Selenium and human health. The Lancet, 379, 1256–1268.
Sasakura C., Suzuki K.T. (1998): Biological interaction be-tween transition metals (Ag, Cd and Hg), selenide/sulfide and selenoprotein P. Journal of Inorganic Biochemistry, 71, 159–162.
Schrauzer G.N. (2009): Selenium and selenium-antagonistic elements in nutritional cancer prevention. Critical Re-views in Biotechnology, 29, 10–17.
Seppanen M.M., Kontturi J., Lopez Heras I., Madrid Y., Camara C., Hartikainen H. (2010): Agronomic bioforti-fication of Brassica with selenium-enrichment of SeMet and its identification in Brassica seeds and meal. Plant and Soil, 337, 273–283.
Smithard R. (1993): Full fat rapeseed for pig and poultry diets. Feed Compounder, 13, 35–38.
Staneviciene I., Bernotiene R., Sadauskiene I. (2014): The comparison of the protective effect of zinc and selenite ions against cadmium induced changes of protein syn-thesis in mice organs. Trace Elements and Electrolytes, 31, 116–123.
Szakova J., Tremlova J., Pegova K., Najmanova J., Tlustos P. (2015): Soil-to-plant transfer of native selenium for wild vegetation cover at selected locations of the Czech Republic. Environmental Monitoring and Assessment, 187, 358–366.
Terry N., Zayed A.M., De Souza M.P., Tarun A.A.S. (2000): Selenium in higher plants. Annual Review of Plant Physi-ology and Plant Molecular BiPhysi-ology, 51, 401–432. Tomza-Marciniak A., Pilarczyk B., Bakowska M., Pilarczyk
R., Wojcik J., Marciniak A., Hendzel D. (2011): Relation-ship between selenium and selected heavy metals con-centration in serum of cattle from a non-polluted area. Biological Trace Element Research, 144, 517–524.
Tvrda J., Tumova N., Fucikova A., Zidkova J., Melcova M., Szakova J., Mlejnek P., Zidek V., Mestek O., Kana A., Tlus-tos P. (2015): The biochemical and hematological response of rats on defatted rape seeds addition into the diet. Aca-demia Journal of Agricultural Research, 3, 395–401. Wang L., Zhou X.L., Yang D.B., Wang Z.Y. (2011): Effects
of lead and/or cadmium on the distribution patterns of some essential trace elements in immature female rats. Human and Experimental Toxicology, 30, 1914–1923. Watts D.L. (1994): The nutritional relationships of selenium.
Journal of Orthomolecular Medicine, 9, 111–117. Yamasaki K., Sakuma Y., Sasaki J., Matsumoto K., Anzai K.,
Matsuoka K., Honda C., Tsukada M., Endo K., Enomoto S. (2011): Biliary excretion of essential trace elements in rats under oxidative stress caused by selenium deficiency. Analytical and Bioanalytical Chemistry, 401, 2531–2538. Yu S., Beynen A.C. (2001): The lowering effect of high
copper intake on selenium retention in weanling rats de-pends on the selenium concentration of the diet. Journal of Animal Physiology and Animal Nutrition, 85, 29–37. Yu Z.Z., Chen J., Shou P.Q., Feng L. (2014): Effects of mi-cronutrients on the reproduction of infertility rat model induced by adenine. International Journal of Clinical and Experimental Medicine, 7, 2754–2762.
Received: 2015–11–25 Accepted after corrections: 2016–07–12
Corresponding Author
Prof. Ing. Jiřina Száková, CSc., Czech University of Life Sciences Prague, Faculty of Agrobiology, Food and Natural Resources, Kamýcká 129, 165 00 Prague 6-Suchdol, Czech Republic