Tannic acid (TA) is a natural phenolic compound which can be found in fruits and many kinds of plants. The content of TA in fruits, tea, and beer can strongly influence their taste, and hence, it is an important parameter to evaluate and control the quality of these products (Alasalvar et al. 2013). TA is also used as an additive in the medicinal industry, including those used for the treatment of burns and diarrhoea (Wan et al. 2007). TA may combine with metals to form tannic acid–metal complexes which have a toxic potential to the root system of plants (Kinraide & Hagermann 2010). For these reasons, the determination of tannic acid has been of great importance. Several methods have been developed for this purpose including colorimetry, chromatog-raphy, chemiluminescenceand spectrophotometry (Varanka et al. 2001; Xie & Cui 2003; Naczk & Shahidi 2004; Pelozo et al. 2008). Compared with those methods above, electrochemical techniques for tannic acid determination have some advantages such as: high sensitivity, accuracy, simplicity and low expense (Lu 2004; Xu et al. 2009; Raj et al. 2013; Vu et al. 2013). Among carbon based electrodes, pencil
graphite electrodes (PGEs) have some advantages such as commercial availability with low cost, good mechanical rigidity, disposability, renewability, and ease of modification. Due to those useful and im-portant characteristics, scientists have focused on the use of PGEs for phenolic compounds analysis (Buratti et al. 2008; Muti et al. 2013).
In this paper, we described a simple and rapid method for the determination of TA using a pretreated pencil graphite electrode (Pre-PGE).
MATERIAL AND METHODS
Reagents and equipment. All of the reagents in-cluding TA (99.8% purity) were purchased in Sigma-Aldrich (Dortmund, Germany). Deionised water was used in this study (G ≤ 0.055 μS). Dissolved oxygen was removed from all the solutions by purging with argon for 15 min (purity 99.99%; Linde Technoplyn, Prague, Czech Republic).
A solution of TA (10–2 mol/l) was freshly prepared
with deionised water and was kept in a dark bottle
Voltammetric Determination of Tannic Acid in Beverages
using Pencil Graphite Electrode
Dai Long VU 1, Bensu ERTEK 2, Yusuf DILGIN 2 and Libor ČERVENKA3
1
Biomedical Research Center, University Hospital Hradec Králové, Hradec Kralové,
Czech Republic;
2Department of Chemistry, Science & Art Faculty, Canakkale Onsekiz
Mart University, Canakkale, Turkey;
3Department of Analytical Chemistry,
Faculty of Chemical Technology, University of Pardubice, Pardubice, Czech Republic
Abstract
Vu D.L., Ertek B., Dilgin Y., Červenka L. (2015): Voltammetric determination of tannic acid in beverages using pencil graphite electrode. Czech J. Food Sci., 33: 72–76.
The pretreated pencil graphite electrode (Pre-PGE) prepared by a chronoamperometry technique was applied for the determination of tannic acid using anodic stripping differential pulse voltammetry. The currents obtained from voltammetry measurements at optimum conditions were linearly correlated with the concentration of tannic acid. Calibration curve was obtained for tannic acid in the concentration range of 5.0–500 × 10–9 mol/l. The limit of detec-tion was found to be 1.5 × 10⁻⁹ mol/l. The content of tannic acid in beverage samples determined with Pre-PGE was in good agreement with that obtained by the standard spectrophotometric method.
during the experiments. Britton-Robinson (B-R) buffer was used as supporting electrolyte.
A three electrode system consisting of PGE (working electrode), Ag/AgCl/3.0 M KCl (reference electrode) and platinum wire (counter electrode) connected to a potentiostat (PalmSens; Ivium Technologies B.V., AJ Eindhoven, the Netherlands) was used for elec-trochemical measurement. Pencil leads of 0.5 mm in diameter and 60 mm in total length (Faber Castell, Germany) and a mechanical pencil Model T 0.5 (Rotring, Hamburg, Germany) were used in this study. Electrical contact to the lead was obtained by wrapping a metallic wire to the metallic part of the holder. For each measurement, a total of 10 mm of lead was immersed into the electrolyte.
Preparation of Pre-PGEs. Pre-PGEs were prepared by two different pretreatment methods: cyclic voltam-metric technique and chronoamperovoltam-metric technique. In the first technique, the cyclic voltammograms were applied at various potential ranges [(–1.0 V → +2.0 V); (–0.3 V → +2.0 V), (+0.5 V → +2.0 V); (+1.0 V → +2.0 V) or (+1.5 V → +2.0 V)] with a scan rate of 50 mV/s for 5 scans. In the second method, the sur-face of PGE was pre-treated by applying a potential of +1.45 V for 60 s in the supporting electrolyte (0.1 M phosphate buffer solution containing 0.1 M KCl, pH 7.0). After the pretreatment, the Pre-PGEs were used for the determination of TA using anodic stripping differential pulse voltammetry (ASDPV) (potential range 0–0.8 V; potential step 25 mV; potential pulse: 25 mV; pulse time 0.05 s; scan rate 50 mV/s). The ef-fects of pH, accumulation potential and accumulation time were optimised. All of the PGE electrodes were treated directly before each measurement.
Standard spectroscopic method for determination of TA. The spectroscopic method was performed using AOAC International Official Method 952.03, which involves the reaction between TA and Folin-Dennis reagent in the presence of saturated sodium carbonate (Horwitz & Latimer 2007).
Sample preparation. The novel method was also used for the determination of TA in some food samples such as: white wine (Neuburger variety; Vinselekt Michlovský a.s., Rakvice, Czech Republic), fruit juice (Multi-vitamin variety, Vitafit; Lidl Stiftung & Co., KG, Neckarsulm, Germany), and black tea (Pigi; Total Global Beverages, Czech Republic). For this purpose, 1.5 g of black tea was extracted by 100 ml hot water for 10 minutes. The filtered sam-ple (Whatman No. 5) was transferred to a 250-ml volumetric flask, and diluted with deionized water
until the mark was reached. Wine and fruit juice sam-ples were used directly after filtration. The collected liquids were employed for both the electrochemical and spectroscopic method. Statistical differences were computed using Student’s t-test at the probability level P = 0.05 (OriginPro 9, OriginLab Corporation, Northampton, USA).
RESULTS AND DISCUSSIONS
The effect of pretreatment method. It is known that the pretreatment at positive potentials can in-crease the hydrophilic properties of the electrode surface, which provides a good adsorption property to PGE, and hence, may increase the effectiveness of the pre-concentration step in stripping techniques (Dilgin et al. 2012). Our preliminary study showed the insignificantly different effect between the two techniques for the pretreatment of PGEs (data not shown). Since the chronoamperometric method was simpler and faster than the cyclic voltammetric technique, it was chosen for the electrochemical treatment of PGEs in the subsequent experiments.
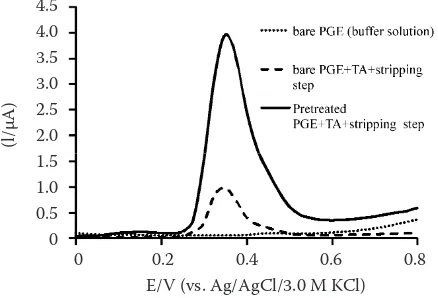
[image:2.595.304.523.521.670.2]The effect of pretreatment on the oxidation of TA. The responses of TA oxidation on Pre-PGE and bare PGE obtained by the ASDPV technique in a B-R buffer pH 4.0 were compared. As can be seen in Figure 1, the oxidation peak was obtained at the potential of 0.35 V for both Pre-PGE(3.95 ± 0.11 μA) and PGE (0.98 ± 0.08 μA) in the presence of TA (P < 0.01).
Figure 1. Anodic stripping differential pulse voltammetry curves of 0.3 × 10⁻⁵ mol/l tannic acid using bare PGE
and pretreated PGE in Britton-Robinson buffer (pH 4.0) accumulated at –0.1 V for 180 s (potential range from 0.0 to 0.8 V; potential step 25 mV; potential pulse 25 mV; pulse time 0.05 s; scan rate 50 mV/s). Bare PGE response in buffer solution served as control
0 0.2 0.4 0.6 0.8 E/V (vs. Ag/AgCl/3.0 M KCl) 4.5
4.0 3.5 3.0 2.5 2.0 1.5 1.0 0.5 0
The effect of the scan rate. The electrochemical behaviour of Pre-PGE was investigated by recording cyclic voltammograms in a B-R buffer (pH 4.0) at vari-ous scan rates in the presence of 1 × 10⁻⁵ mol/l TA.
As indicated in Figure 2, the oxidation peak potential appeared at the same position with the increase of the scan rate. This phenomenon was very different from the literature where the increase of the scan rate was followed by the shift of the oxidation peak potential. The oxidation currents increased linearly with the scan rate (Figure 2; inset) (Ia = 0.0183v + 0.0997 µA;
r2 = 0.997) indicating that the electrochemical process
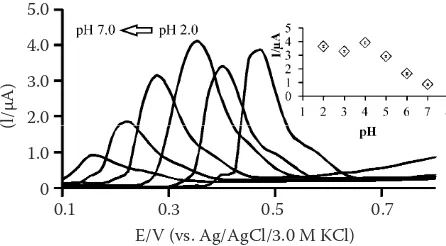
of TA at Pre-PGE was a surface-controlled process. The effect of some parameters on determination of TA by ASDPV. The pH, accumulation potential and accumulation time have important effects on the determination of TA using ASDPV. As can be seen in Figure 3, pH influenced both the oxidation potential and the oxidation current. The oxidation potential shifted to the less positive values with increasing pH from 2.0 to 7.0. The oxidation of TA did not occur on pre-PGE under alkali conditions. Accumulation potential and accumulation time ex-hibited only the oxidation current relationship (data not shown). Therefore, the optimum conditions were chosen as: supporting electrolyte (B-R buffer pH 4.0), accumulation potential (–0.1 V), and ac-cumulation time (180 s). From these conditions, a calibration curve was obtained over the concentra-tion range of TA 5–500 × 10–9 mol/l (Figure 4). The
limit of detection (LOD) using the equation LOD = 3sb/m and the limit of quantification (LOQ) using the equation LOD = 10sb/m were found to be 1.5 × 10⁻⁹ mol/l and 5.0 × 10⁻⁹ mol/l, respectively. The
parameter sb is the standard deviation of the blank response and m is the slope of the calibration plot.
The repeatability of the method was investigated by the repeated measurements of 8.0 × 10⁻⁹, 1.0 ×
10–7, and 0.5 × 10⁻⁶ mol/l TA (n = 10) and the relative
standard deviations (RSD) were found to be 5.83, 6.10, and 6.42 %, respectively.
[image:3.595.65.290.106.273.2]The enhancement of the electrochemical activity of PGE toward tannic acid can be attributed to the Figure 2. Cyclic voltammograms of Pre-PGE at various
scan rates (from 10 to 100 mV/s) in the presence of 5 × 10⁻⁵ mol/l of TA. Inset: the oxidation current of TA (5 ×
10–5 mol/l) at various scan rates. Experimental conditions:
[image:3.595.64.287.545.668.2]pH 4.0 (Britton-Robinson buffer; potential range from 0.0 to 1.0 V; potential step 25 mV)
Figure 3. Anodic stripping differential pulse voltammetry curves of 0.3 ×10⁻⁵ mol/l TA using pre-PGE at various
pH. Accumulation potential -0.1 V, accumulation time 180 s (potential range from 0.0 to 0.8 V; potential step 25 mV; potential pulse 25 mV; pulse time 0.05 s; scan rate 50 mV/s). Inset: the effect of pH on the oxidation current of TA (n = 5)
Figure 4. Anodic stripping differential pulse voltammetry curves of various concentrations of TA on Pre-PGE in Britton-Robinson buffer (pH 4.0), accumulation potential –0.1 V, accumulation time 180 s (potential range from 0.0 to 0.8 V; potential step 25 mV; potential pulse 25 mV; pulse time 0.05 s; scan rate 50 mV/s). Inset: the plot of oxidation current vs. concentration of tannic acid
0 0.2 0.4 0.6 0.8 1.0 E/V (vs. Ag/AgCl/3.0 M KCl)
3.0 2.5 2.0 1.5 1.0 0.5 0.0 –0.5
(l/µA)
5.0 4.0 3.0 2.0 1.0 0
(l/µA)
0.1 0.3 0.5 0.7 E/V (vs. Ag/AgCl/3.0 M KCl)
(l/µA)
0 0. 1 0.2 0.3 0.4 0.5 0.6
E/V (vs. Ag/AgCl/3.0 M KCl) 8.0
6.0
4.0
2.0
[image:3.595.305.529.547.665.2]increased formation of oxygen-containing groups, such as carbonyl and carboxyl on the graphite lead surface during the treatment procedure (Alipour et al. 2013). Since the response of Pre-PGE toward tannic acid decreased with the increase of pH, we may imply that specific interactions (likely hydrogen bonds) between oxygen-containing groups on the surface of the electrode and hydroxyl groups of tannic acid arise under acidic conditions. With increasing pH, deprotonisation of both oxygen-containing groups in the pencil lead and hydroxyl groups in TA occurred leading to a repulsion of negatively charged TA from the negatively charged surface. A possible mechanism for the reaction of tannic acid on the hydrophilic surface of Pre-PGE can be proposed in the following steps: (1) pre-concentration step (buffer solution at pH 4.0,
deposition potential –0.1 V, deposition time 180 s).
≡ C – OH (Pre–PGE) + HO – tannin acid(solution) ↔
↔ ≡ C – OH … H – O tannin acid(Pre–PGE)
(2) Stipping step (buffer solution at pH 4.0, positive scan from 0.0 to +0.8 V)
≡ C – OH … H – O – tannin acid(Pre–PGE)) ↔ ≡ C – OH +
+ tannin acid(ox) + ne–
The various analytical detection parameters such as accumulation time, decomposition potential, linearity ranges, and calculated LOD obtained from the Pre-PGE were compared with other modified electrodes. As can be seen from Table 1, previous studies showed an insignificant influence of accumulation potential on the pre-concentration step while our study demonstrated that the accumulation potential –0.1 V significantly enhanced the oxidation of TA. The LOD obtained from the proposed method was lower than those obtained
from other modified electrodes. It could be concluded that the Pre-PGE had a significant effect on the oxida-tion of TA. In addioxida-tion, the preparaoxida-tion of the Pre-PGEs is simpler and cheaper than the preparation of other electrodes compared in Table 1.
Interference studies. The influence of potentially interfering species on the detection of tannic acid was investigated. The criterion used for the pres-ence of interferpres-ence was a 5% or greater change in the peak current of 0.5 × 10⁻⁶ mol/l tannic acid. It
was found that 200 folds of K+, Na+, Cl–, CO 32–, and
HCO3–, 80 folds of tartaric acid and glucose, 50 folds of oxalic acid and citric acid, 40 folds of Mg2+, Ni2+,
Cr2+, Ca2, 25 folds of ascorbic acid and 15 folds of
Fe2+, Fe3+, Zn2+, Mn2+, Cu2+, Cd2+ did not interfere
with the analysis of tannic acid using the pretreated pencil graphite electrode. In comparison with the study of Xu et al. (2009), our results showed a lower influence of potentially interfering species.
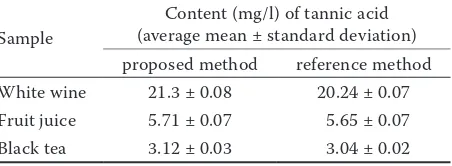
[image:4.595.65.530.124.265.2]Determination of tannic acid in real samples. The proposed method was applied to tannic acid determination in black tea infusion, white wine and fruit juice samples with results shown in Table 2. The content of TA did not show any statistical differences in comparison with the standard spectrophotometric method (P > 0.05).
Table 1.Comparison of the efficiency of some modified electrodes used in the electrocatalysis of tannic acid
Electrode Constant potential (mV)
Accumulation time
(s)
Limit of detection (10–6 × mol/l)
Limit of quan-tification (10–6 × mol/l)
Dynamic range
(10–6 × mol/l) Reference Multi wall carbon nanotubes
modified GCE1 – 300 0.1 n.a. 0.4–200 Lu (2004)
AHMP-AuNPs2 – – 0.02 n.a. 0.05–1 Raj et al. (2013)
Porous pseudo-carbon paste
electrode – 100 0.01 n.a. 0.02–1 Xu et al. (2009)
Si-gel/CPE –300 240 0.0003 0.001 0.001–1.0 Vu et al. (2013)
Pre-PGE –100 180 0.0015 0.005 0.005–0.5 this paper
1glassy carbon electrode; 24-amino-6-hydroxy-2-mercaptopyrimidine capped gold nanoparticles (AHMP-AuNPs) in aqueous medium immobilised on indium tin oxide (ITO) electrode modified with (3-mercaptopropyl)trimethoxysilane (MPTS) sol–gel
Table 2. Tannic acid contents in some samples using Pre-PGE and spectrophotometric method (n = 10)
Sample
[image:4.595.306.532.681.764.2]CONCLUSION
In this study the electrochemical determination of TA on the surface of Pre-PGE by ASDPV was firstly investigated. This kind of electrochemical sensor is proved to be of high sensitivity, excellent selectivity and reproducibility. It was shown that the pretreat-ment procedure remarkably enhanced the oxidation peak current of TA compared with the normal PGE. The proposed method was successfully applied in real samples. The detection limit of TA was estimated to be 1.5 × 10⁻⁹ mol/l in this work.
References
Alasalvar C., Pelvan E., Özdemir A.S., Kocadagili T., Mogol B.A., Pasli A.A., Özcan N., Özçelik B., Gökman B. (2013): Compositional, nutritional, and functional characteris-tics of instant teas produced from low- and high-quality black teas. Journal of Agricultural and Food Chemistry, 61: 7529–7536.
Alipour E., Majidi M. R., Saadatirad A., Golabi S.M., Aliza-deh A.M. (2013): Simultaneous determination of dopami-ne and uric acid in biological samples on the pretreated pencil graphite electrode. Electrochimica Acta, 91: 36-42. Buratti S., Scampicchio M., Giovanelli G., Mannino S.
(2008): A low-cost and low-tech electrochemical flow system for the evaluation of total phenolic content and antioxidant power of tea infusions. Talanta, 75: 312–316. Dilgin Y., Kızılkaya B., Ertek B., Isık F., Giray Dilgin D.
(2012): Electrocatalytic oxidation of sulphide using a pencil graphite electrode modified with hematoxylin. Sensors and Actuators B: Chemical, 171–172: 223–229. Horwitz W., Latimer G.W. (2007): Official Methods of
Analysis of AOAC International. 18th Ed. Maryland, AOAC International.
Kinraide T.B., Hagermann A.E. (2010): Interactive intoxi-cating and ameliorating effects of tannic acid, aluminum (Al3+), copper (Cu2+), and selenate (SeO
4
2–) in wheat roots:
a descriptive and mathematical assessment. Physiologia Plantarum, 139: 68–79.
Lu S. (2004): Electrochemical determination of tannins using multiwall carbon nanotubes modified glassy car-bon electrode. Russian Journal of Electrochemistry, 40: 750–754.
Muti M., Gençdaĝ K., Nacak F.M., Aslan A. (2013): Electro-chemical polymerized 5-amino-2-mercapto-1,3,4-thiadia-zole modified single use sensors for detection of quercetin. Colloids and Surfaces B: Biointerfaces, 106: 181–186. Naczk M., Shahidi F. (2004): Extraction and analysis of
phenolics in food. Journal of Chromatography A, 1054: 95–111.
Pelozo M.I.G., Cardoso M.L.C., Mello J.C.P. (2008): Spec-trophotometric determination of tannins and caffeine in preparations from Paullinia cupana var. sorbilis. Brazilian Archives of Biology and Technology, 51: 447–451. Raj M.A., Revin S.B., John S.A. (2013): Synthesis,
charac-terization and modification of functionalized pyrimidine stabilized gold nanoparticles on ITO electrode for the de-termination of tannic acid. Bioelectrochemistry, 89: 1–10. Varanka Z., Rojik I., Varanka I., Nemcsok J., Abrahama M.
(2001): Biochemical and morphological changes in carp
(Cyprinus carpio L.) liver following exposure to copper
sulfate and tannic acid. Comparative Biochemistry and Physiology C: Comparative Pharmacology and Toxicol-ogy,128: 467–478.
Vu D. L., Ertek B., Červenka L., Dilgin Y. (2013): Determi-nation of tannic acid using silica gel modified carbon paste electrode. International Journal of Electrochemical Sciences, 8: 9278–9286.
Wan H., Zou Q., Yan R., Zhao F., Zeng B. (2007): Electro-chemistry and voltammetric determination of tannic acid on a single-wall carbon nanotube-coated glassy carbon electrode. Microchimica Acta, 159: 109–115.
Xie C., Cui H. (2003): Detection of tannic acid at trace level in industrial wastewaters using a highly sensitive che-miluminescence method. Water Research, 37: 233–237. Xu L., He N., Du J., Deng Y., Li Z., Wang T. (2009): A de-tailed investigation for determination of tannic acid by anodic stripping voltammetry using porous electrochem-ical sensor. Analytelectrochem-ical Chimica Acta, 634: 49–53.
Received: 2014–04–23 Accepted after corrections: 2014–07–26
Corresponding author: