Under the present global scenario of CO2 in-crease (IPCC 1996), it has become pertinent for researchers all over the world to find solutions for future. Firstly, research can help to identify the crops which respond to the above situation and those which do not. Secondly, among the crops which respond, those with relatively a higher magnitude are to be identified initially to address the food and feed self-sufficiency followed by the soil improvement.
Various reviews on the response of different crops revealed that an increase in CO2 has a positive ef-fect on the plant biomass. Kimball (1986) obtained an average increase of 21% in biomass in response to elevated CO2 when he analyzed 94 observations of different plants. Cure (1985) and Cure and Acock (1986) reported that sorghum showed a stimula-tion of 5% increase in biomass with elevated CO2 levels (scaled to 550 µmol/mol). Venkteshwara Rao (1999) observed that in groundnut cv. TMV-2 bio-mass production was 29% higher in elevated CO2 (660 ppm) than in ambient CO2. In sunflower the growth was affected at elevated CO2 by increas-ing net CO2 assimilation rate (Tezara et al. 2002). It was observed that with elevated levels of CO2 (using the FACE technology) there was a greater
stimulation of belowground than aboveground biomass (Kimball et al. 2002). Under ample water and nutrients the root growth of C3 grasses was stimulated by about 47% as compared with the 12% of shoots whereas in clover (C3 legume) the root growth stimulation (25%) was nearly same as that of shoots (24%).
In this paper an attempt was made to present the response of certain rainfed crops up to veg-etative stage to enhanced levels of CO2 and were compared with chamber control at ambient level CO2, which actually takes care of the deviation in temperature and relative humidity due to the OTC. The crops were raised directly in the field to avoid the root restriction in pots. In enhanced CO2 condition, the CO2 levels were elevated to set ppm continuously 24 h from the day of sow-ing to final samplsow-ing. The response reported that the actual effect of CO2 with all other conditions maintained similar for both the treatments.
MATERIAL AND METHODS
The seeds of sorghum (Sorghum bicolor L. Moench.) cv. CSV-15, blackgram (Vigna mungo L.
Evaluation of certain rainfed food and oil seed crops
for their response to elevated CO
2
at vegetative stage
M. Vanaja, P. Vagheera, P. Ratnakumar, N. Jyothi Lakshmi, P. Raghuram Reddy,
S.K. Yadav, M. Maheswari, B. Venkateswarlu
Central Research Institute for Dryland Agriculture, Santhoshnagar, Hyderdabad, India
ABSTRACT
A study was conducted with two important rainfed food crops viz., sorghum (Sorghum bicolor L. Moench.) and
blackgram (Vigna mungo L. Happer) and two oil seed crops viz., sunflower (Helianthus annuus L.) and groundnut
(Arachis hypogaea L.) under two conditions viz., elevated CO2 (600 ppm) and ambient CO2 (365 ppm) in open
top chambers (OTCs). The observations were recorded at the vegetative stage at 7, 14, 21 and 30 days after sowing (DAS). The results showed significant differences between crops, conditions and time intervals, as well as the single and double order interactions for all the characters studied viz., total dry weight, stem dry weight, root dry weight, leaf dry weight, shoot length, root length and leaf area. Total dry weight and its components viz., stem dry weight,
root dry weight and leaf dry weight along with leaf area showed a significant increase under enhanced CO2
condi-tions. Among the four crops studied the overall results showed the highest response to elevated CO2 by blackgram
while the lowest response by sorghum.
Happer) cv. T-9, sunflower (Helianthus annuus L.) cv. MSFH-8, and groundnut (Arachis hypogaea L.) cv. JL-24 were grown in OTCs of 3 m × 3 m diam-eter, lined with a transparent PVC sheet. The seeds were sown directly in the soil (Alfisol) to study the effect of elevated CO2 level (600 ± 50 ppm) on initial plant growth up to 30 DAS. Plants were maintained stress-free by irrigation and application of recommended doses of fertilizers. There were two chambers for each treatment. Each chamber had four 1 m × 1 m plots with five rows of each crop and a minimum of ten plants in each row was maintained.
The experimental site was sandy loam in tex-ture, neutral in pH (6.8), low in available nitrogen (225 kg/ha), phosphorus (10 kg/ha) and medium to high in available potassium (300 kg K2O/ha). Two OTCs were maintained at 600 ± 50 ppm to have the elevated levels of CO2 at crop canopy level by continuously injecting 100% CO2 into plenum where it was mixed with ambient air from air compressor before entering into the chamber. Other two OTCs were maintained at ambient CO2 level (365 ppm) without any external CO2 supply and served as control chambers. The air sample from each cham-ber was drawn at 3 minutes interval into non-dis-persive infrared (NDIR) CO2 analyzer (California Analytical) and the set ppm of CO2 concentration (600 ± 50 ppm) was maintained with the help of solenoid valves, roto meters, PCs, Program Logic Control (PLC) and Supervisory Control and Data Acquisition (SCADA) software. Throughout the experimental period, continuous measurements of relative humidity and temperature of all the OTCs were possible with the sensors fitted inside the chambers. The temperature of chambers with elevated levels of CO2 remained nearly same as in the control chambers that were maintained at ambient CO2 level (Figure 1). The light intensity in chambers was 80–95% of the outside field. However, gentle washing of polythene cover was frequently required to maintain transparency.
The observations were recorded at weekly in-tervals up to a one month period on total dry weight, stem dry weight, root dry weight, leaf dry weight, shoot length, root length and leaf area in all the treatments and root:shoot ratio and specific leaf weight (leaf weight/leaf area) were derived from the above observations. Three replications with ten plants for a replication of each crop were harvested at weekly interval, i.e. thirty plants of each crop for elevated CO2 and a chamber control treatment. The measurements were recorded on lengths of shoot and root for individual plants, i.e.
10 × 3 observations for each parameter, whereas leaf area, stem dry weight, root dry weight and leaf dry weight were recorded for 10 plants/replica-tion, i.e. 2 × 3 observations for each parameter. The root length was recorded on main root of each plant. At different time intervals the leaf area was measured with leaf area meter (LI-3100) and expressed as cm2/10 plants. The dry weights of
shoot, root and leaf were recorded after a thor-ough drying of the plant material in hot air oven at 65ºC and expressed as g/10 plants. All the data was statistically analyzed using a two-way analysis of variance (ANOVA) to test the significance of treatment and their interactions.
RESULTS AND DISCUSSION
The mean per se values of characters studied at 30 DAS under elevated CO2 (600 ± 50 ppm) and chamber control (365 ppm) for four crops are presented in Table 1. The response of elevated CO2 as compared to chamber control are given in Table 2, while the ANOVA in Table 3.
The response was positive for total dry weight under elevated CO2 (600 ppm) for all four crops tested. Blackgram showed a more significant re-sponse under elevated CO2 when compared with other three crops. The increment in total dry weight under elevated CO2 at 30 DAS was 80% in black-gram compared to chamber control. In sunflower it was 32%, in groundnut 14%, and in sorghum 9% compared to chamber control (Table 2). Krizek et al. (1984) reported the increase in biomass production in pulses as a result of elevated CO2 but the relative increase in dry mass varies with plant species (Strain and Cure 1986). Trischle et al. (2000) reported an increase in total biomass in five crops in three days of emergence. Devakumar et al. (1996), Ratnakumar and Swamy (2003) found increased initial growth rates by exposing seedlings to elevated CO2.
The total dry weight was highly significant for conditions, conditions × crops, conditions × time intervals and second order interaction of condi-tions × crops × time intervals (Table 3). The first order interaction of conditions and time intervals was significant in blackgram and sunflower and non-significant in sorghum and groundnut; this shows that in sorghum and groundnut the response is not same at different time intervals.
The response of stem dry weight was the same as total dry weight and the response of different crops was positive. When compared to other three crops
incre-ment in stem dry weight of blackgram under elevated CO2 was significantly higher (101%) as compared to chamber control (Table 2). The increment in stem dry weight was 49% in sunflower, 13% in groundnut and sorghum under elevated CO2, as compared to chamber control. The analysis for individual crops response showed that conditions and conditions × time intervals are highly significant for sorghum, blackgram and sunflower stem dry weight, whereas it was non-significant for groundnut.
[image:3.595.154.440.57.568.2]In all the crops studied elevated CO2 showed a positive response for root dry weight and the re-sponse ranged from 78 to 6% compared to chamber control (Table 2). Blackgram, a pulse crop showed the highest response (78%) under elevated CO2 condition, followed by sunflower (49%), ground-nut (7%) and sorghum (6%) compared to chamber control. From the FACE experiments, Ottman et al. (2001) observed a small mean response of 3% in sorghum for shoots to elevated CO2 under well
Figure 1. Temperature and relative humidity of OTCs with and without CO2 and light intensity of OTCs and
open field
Time (hours)
0 10 20 30 40 50 60 70 80 90 100
0 2 4 6 8 10 12 14 16 18 20 22 24
0 5 10 15 20 25 30 35 40 45
0 2 4 6 8 10 12 14 16 18 20 22 24
0 500 1000 1500 2000 2500
9 10 11 12 13 14 15 16 17
Re
la
tiv
e
hu
m
id
ity
(%
)
Te
m
pe
ra
tu
re
(°
C
)
Li
gh
t i
nt
en
si
ty
(µ
m
ol
/m
2/s
)
watered conditions, which is consistent with the smaller photosynthetic response of this crop.
The response of root dry weight was also highly significant for conditions and its interaction with crops, time intervals and second order interaction of conditions × crops × time intervals (Table 3). The root dry weight response to elevated CO2 was positive but not uniform with all the crops tested. In blackgram and sunflower the response was highly significant for both conditions and its interaction with time intervals, except for groundnut where it was non-significant.
With an increase in CO2 concentration, leaf dry weight increased in all the crops. As it was observed with all the above parameters, blackgram showed the highest response and it was 71% compared to chamber control (Table 2). The next responsive crop was sunflower (22%), followed by groundnut (17%) and sorghum (8%). The leaf dry weight was
highly significant for conditions and its interaction with crops, whereas the second order interaction of crops × conditions × time intervals was non-significant (Table 3). In blackgram and sunflower the leaf dry weight was significant with conditions and its interaction with time intervals, whereas sorghum showed no response.
[image:4.595.65.532.96.299.2]The response of root and shoot dry weight in all the crops was positive with elevated CO2 when compared to chamber control. The relative re-sponse of roots to shoots differed with different crops. The increment in shoot biomass of sorghum, blackgram and groundnut was higher, as compared to the increment in root biomass; hence the root: shoot ratio values are negative at 30 DAS (Table 2). Sunflower showed a reverse response where the root:shoot ratio was positive but non-significant. Stulen and den Hertog (1993) concluded in their review on dry matter partitioning in response to
Table 2. Increase (%) in different parameters of four crops (sorghum, blackgram, sunflower, groundnut) at 30 DAS
under elevated CO2 (600 ppm) compared to chamber control (365 ppm)
Crops
Weight
Root:shoot
ratio lengthShoot lengthRoot Leaf area Specific leaf weight total
dry stem dry root dry leaf dry
Sorghum 9.084 13.47 3 6.07 4 7.774 –6.493 –3.323 4.652 6.974 0.0354
Blackgram 79.701 100.95 1 78.41 1 71.181 –11.954 7.371 –11.743 52.541 13.451
Sunflower 31.622 49.34 2 53.28 2 22.202 2.581 1.902 10.961 9.942 3.623
Groundnut 14.133 12.54 4 7.03 3 16.65 3 –3.552 –11.084 –11.884 7.333 8.862
[image:4.595.62.539.624.737.2]Superscript numbers denotes the ranking of the crops for that particular character
Table 1. Mean per se values of various characters under elevated CO2 (600 ± 50 ppm) and chamber control
(365 ppm) for four crops at 30 DAS
Characteristics
Sorghum Blackgram Sunflower Groundnut
elevated
CO2 chamber control elevated CO2 chamber control elevated CO2 chamber control elevated CO2 chamber control
Root length (cm) 18.00 17.20 10.53 11.93 10.38 9.35 8.90 10.10
Shoot length (cm) 27.65 28.60 14.58 13.58 38.80 38.08 14.45 16.25
Root dry weight (g/10 pl) 5.85 5.52 1.28 0.72 4.13 2.69 1.74 1.63
Shoot dry weight (g/10 pl) 12.80 11.28 5.09 2.53 12.30 8.23 11.18 9.94 Leaf dry weight (g/10 pl) 27.00 25.05 10.62 6.20 26.49 21.68 12.72 10.90
Total dry wt (g/10 pl) 45.65 41.85 16.99 9.45 42.92 32.61 25.65 22.47
Leaf area (cm2/10 pl) 7525 7035 2719 1783 7197 6547 2945 2744
Root:shoot ratio 0.46 0.49 0.25 0.29 0.34 0.33 0.16 0.16
elevated CO2 that there is a wide variability in root:shoot ratio and the observations varied as negative, no change and positive.
The response of shoot length under elevated CO2 (600 ppm) conditions was positive in blackgram and sunflower, whereas it was negative in sorghum and groundnut when compared to chamber control (Table 2). The response for shoot length was posi-tive and significant in blackgram for conditions and its interaction with time intervals. Bhattacharya et al. (1985) reported a significant increase in plant height, leaf expansion in sweet potato and cowpea under elevated CO2. The response of shoot length was non-significant for conditions and its interaction with crops, time intervals and second order interaction of conditions × crops × time intervals (Table 3,) hence the shoot length is the least responsive.
The four crops tested showed different responses for root length under elevated CO2. The length of the roots showed a positive increase in sunflower (10.96%) and sorghum (4.65%) after 30 days of growth under elevated CO2 (600 ppm), when com-pared to chamber control (Table 2), whereas it was negative in blackgram (–11.74%) and groundnut (–11.88%). Baker et al. (1990) recorded around 65%
more actively growing roots in rice at 800 ppm, whereas the elongation rate of individual root axes was not affected. However the spread of the roots with more root hairs resulted in increased root biomass in all the crops tested.
[image:5.595.65.533.91.373.2]The leaf area of all the crops showed a positive response under elevated CO2 condition compared to chamber control. Blackgram showed the high-est and significant response (52.54%) among the four crops evaluated. Sunflower, groundnut and sorghum are next in this order with 9.94, 7.33 and 6.97% increase in leaf area (Table 2). The response of leaf area for conditions and its interaction with time intervals was significant, whereas conditions × crops and second order interaction of conditions × crops × time intervals was non-significant (Table 3). Conditions are significant for blackgram, sunflower and groundnut, whereas interactions between con-ditions and time intervals were significant only for blackgram. The response of leaf area in sorghum was positive but non-significant. Several studies showed that the extra C in plant leaves induced by elevated CO2 resulted in an increase in leaf size, number of branches or tillers and number of nodes along the branches which support leaves, and hence greater leaf area (Allen 1990).
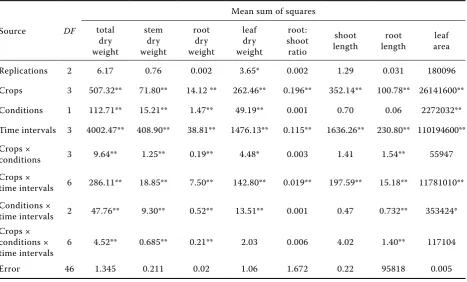
Table 3. ANOVA for various characters at 30 DAS for different crops (sorghum, blackgram, sunflower,
ground-nut) under elevated CO2 (600 ppm)and chamber control (365 ppm)
Source DF
Mean sum of squares total
dry weight
stem dry weight
root dry weight
leaf dry weight
root: shoot ratio
shoot
length lengthroot arealeaf
Replications 2 6.17 0.76 0.002 3.65* 0.002 1.29 0.031 180096
Crops 3 507.32** 71.80** 14.12 ** 262.46** 0.196** 352.14** 100.78** 26141600**
Conditions 1 112.71** 15.21** 1.47** 49.19** 0.001 0.70 0.06 2272032**
Time intervals 3 4002.47** 408.90** 38.81** 1476.13** 0.115** 1636.26** 230.80** 110194600** Crops ×
conditions 3 9.64** 1.25** 0.19** 4.48* 0.003 1.41 1.54** 55947
Crops ×
time intervals 6 286.11** 18.85** 7.50** 142.80** 0.019** 197.59** 15.18** 11781010** Conditions ×
time intervals 2 47.76** 9.30** 0.52** 13.51** 0.001 0.47 0.732** 353424* Crops ×
conditions ×
time intervals 6 4.52** 0.685** 0.21** 2.03 0.006 4.02 1.40** 117104
Error 46 1.345 0.211 0.02 1.06 1.672 0.22 95818 0.005
The specific leaf weight (leaf weight/leaf area) increased in all the crops under elevated CO2 condition when compared to chamber control. Compared to chamber control the increase in spe-cific leaf weight was higher in blackgram (13.45%) under elevated CO2 followed by groundnut (8.86%) and sunflower (3.62%), whereas sorghum showed least response (0.035%) for specific leaf weight (Table 2). This shows that the response of leaf weight was relatively higher than the expansion of the leaves and thereby leaves are thicker under elevated CO2. Huber et al. (1984) concluded that the increase in specific leaf mass (leaf weight/leaf area) was presumably due mostly to the increase in starch content but the leaves of soybean are also thicker under enhanced CO2 condition, due to the increase in palisade cells, which was not observed in maize (Thomas and Harvey 1983, Lawlor and Mitchell 1991).
Among four dry weight characteristics, sor-ghum showed the least response under elevated CO2, as compared to chamber control, except for shoot dry weight whereas groundnut was on par with sorghum. This might be due to sorghum being a C4 crop. Kimball et al. (2002) reviewed that C4 crops in general respond less, compared to C3 crops under elevated CO2.
To conclude, overall results of all the characters studied, the highest response was shown by black-gram (a pulse crop), while the lowest response was given by sorghum (a C4 crop). Sunflower and groundnut were found to place between these two. Among the four crops studied only sorghum is C4 and its response to elevated CO2 was lower than C3 crops, specifically for total biomass and its components viz., root dry weight and leaf dry weight along with leaf area and specific leaf weight. As for the increment in stem dry weight, sorghum was on par with groundnut.
Acknowledgements
This work was carried out in AP-Cess program and authors are grateful to ICAR for financial sup-port. The support and guidance provided by the Director, CRIDA is highly acknowledged.
REFERENCES
Allen L.H. (1990): Plant responses to rising carbon dioxide and potential interactions with air pollution. J. Environ. Qual., 19: 15–34.
Baker J.T., Allen L.H., Boote K.J. (1990): Growth and yield responses of rice to carbon dioxide concentration. J. Agr. Sci., 115: 313–320.
Bhattacharya N.C., Biswas P.K., Bhattacharya S., Sionit N., Strain B.R. (1985): Growth and yield response of sweet
potato to atmospheric CO2 enrichment. Crop Sci.,
25: 975–981.
Cure J.D. (1985): Carbon Dioxide Doubling Responses: a Crop Survey. In: Strain B.R., Cure J.D. (eds.): Direct Effects of Increasing Carbon Dioxide on Vegetation, DOE/ER-0238. United States Department of Energy, Washington, DC: 99–116.
Cure J.D., Acock B. (1986): Crop responses to carbon dioxide doubling: a literature survey. Agric. Meteorol., 38: 127–145.
Devakumar A.S., Udayakumar M., Prasad T.G. (1996): A simple technique to expose seedlings to elevated
CO2 for increased initial growth rates. Curr. Sci., 71:
469–472.
Huber S.C., Rogers H.H., Mowry F.L. (1984): Effect of water stress on photosynthesis and carbon partitioning in soy-bean (Glycine max L. Merr.) plants grown in the field
at different CO2 levels. Plant Physiol., 76: 244–249.
IPCC (1996): Climate change 1995: Summary for policy makers and technical summary of the working group I. In: Houghton J.T., Meria Filho L.G., Callander B.A., Harris N., Kattenburg A., Maskell K. (eds): Intergov-ernmental Panel on Climate Change. Cambridge Univ. Press, Cambridge, UK.
Kimball B.A. (1986): Ecology of crops in changing CO2
concentration. J. Agric. Meteorol., 48: 559–566. Kimball B.A., Kobayashi K., Bindi M. (2002): Responses
of agricultural crops to free-air CO2 enrichment. Adv.
Agron., 77: 293–368.
Krizek D.T., Sward R.J., Downton W.J.S. (1984): Cotton Physiology – A Treatise – SOA Monograph. DOE, Washington.
Lawlor D.W., Mitchell R.A.C. (1991): The effect of
in-creasing CO2 on crop photosynthesis and
productiv-ity: a review of field studies. Plant Cell Environ., 14: 807–818.
Ottman M.J., Kimball B.A., Pinter P.J. Jr., Wall G.W., Vanderlip R.L., Leavitt S.W., LaMorte R.L.,
Matth-ias A.D., Brooks T.J. (2001): Elevated CO2 effects on
sorghum growth and yield at high and low soil water content. New Phytol., 150: 261–273
Ratnakumar P., Swamy P.M. (2003): Effect of elevated
CO2 on seedling growth and photosynthesis in
tropi-cal species, Syzygium cumini (L.) Skeel. In: Proc. Nat. Semin. Physiological Interventions for Improved Crop Productivity and Quality: Opportunities and Con-straints, New Delhi: 92–98.
Stulen I., den Hertog J. (1993): Root growth and
Corresponding author:
Dr. M. Vanaja, Crop Science Division, Central Research Institute for Dryland Agriculture, Santoshnagar, Hyderabad, 500 059 India
phone: 91 040 24530161, fax: 91 040 24531802, e-mail: [email protected] Lambers H., Van de Geijn S.C., Cambrige M.L. (eds):
CO2 and Biosphere. Kluwer Acad. Publ., Dordrecht,
Netherlands: 99–115.
Strain B.R., Cure J.D. (1986): Direct effects of
atmo-spheric CO2 enrichment on plants and ecosystems:
A bibliography with abstracts. Rep. ORNL/ CDIC, 13: 1–199.
Tezara W., Mitchell V., Driscoll S.P., Lawlor D.W. (2002):
Effect of water deficit and its interaction with CO2
supply on the biochemistry and physiology of photo-synthesis in sunflower. J. Exp. Bot., 53: 1781–1791.
Thomas J.F., Harvey C.N. (1983): Leaf anatomy of four
species grown under continuous CO2 enrichment.
Bot. Gaz., 144: 303–330.
Trischle C.R., Polley H.W., Johnson H.B., Pennington
R.E. (2000): Seedling response to elevated CO2 in five
epigeal species. Int. J. Plant Sci., 161: 779–783. Venkteshwara Rao K. (1999): The combined effect of
elevated CO2 levels and temperature on growth
chat-eristics of groundnut (Arachis hypogaea L.). Indian J. Plant Physiol., 4: 297–301.