Corn yields in the semi-arid regions are limited by inadequate water supply and it is still diffi-cult to understand the physiological processes limiting yield under water deficiency (Yang and Midmore 2004). Improving attainable crop yields under stress conditions requires knowledge of yield formation physiological processes such as source-sink relationships (Reynolds and Trethowan 2007, Barnabas et al. 2008). Thus, Yushiharu et al. (1993) reported that three weeks after anthesis, both the chlorophyll and Rubisco contents were positively correlated with source to sink ratio. Post-anthesis water deficiency may prevent ovary fertilization by reducing silk receptivity (Basseti and Mark 1993). Corn yield formation response to changes in assimilate availability per kernel during grain filling suggests that plants establish an early
kernel sink potential to grow close to a saturat-ing assimilate availability conditions dursaturat-ing late grain-filling, which means source limitations are common only early in kernel development (Irena and Tollenaar 1999).
During the grain-filling period, water and ni-trogen availability determine the extent to which sink and source contribute to yield formation, and limited resource availability will mainly result in source restrictions by reducing current photo-synthesis and less by sink limitations (Madani et al. 2010b, Eghareuba et al. 2006). Therefore, the amount of mobile reserves in the vegetative parts will determine the yield gap (Madani et al. 2010a).
The objective of the study was to analyze the effects of water deficiency on yield formation, biomass production, and partitioning of
assimi-The impact of source restriction on yield formation of corn
(
Zea mays
L.) due to water deficiency
M. Oveysi
1, M.J. Mirhadi
1, H. Madani
2, G. Nourmohammadi
1, R. Zarghami
3,
A. Madani
41
Department of Agronomy and Plant Breeding, Islamic Azad University, Science
and Research Branch, Tehran, Iran
2
Department of Agronomy and Plant Breeding, Islamic Azad University, Arak Branch,
Arak, Iran
3
Agricultural Biotechnology Research Institute, Karaj, Iran
4
Department of Agronomy and Plant Breeding, Islamic Azad University, Gonabad
Branch, Gonabad, Iran
ABSTRACT
To understand the mechanisms causing yield limitations in defoliated plants subjected to water deficiency, the ex-periments were laid out as a randomized complete block design with split-plot arrangement. Soil-water regimes consisted of moderate irrigation until physiological maturity (W1) or short severe water stress periods (W2) at V8 stage of ontogenesis, and tasseling which allotted to the main plots. Defoliation times (V8 and tasseling) and intensities (cutting of one or two thirds of leaf blade) combinations and one control level (five Source restriction treatments) were allotted to subplots. Early defoliation caused reduction in grain yield at W1 and W2 by 19.2 and 14.8%, respectively. On the other hand, water deficiency reduced grain per ear by 23.9% and increased individual grain weight by 37.0% (plasticity of sink capacity). These results show that under water deficiency, grain yield limitation was mostly due to a reduction in dry matter allocation to grains (sink capacity) than a result of lower dry matter production (source strength). Findings suggest that in non-irrigated corn, breeders must direct their selec-tion program to increase grain set and decrease surplus leaves.
lates in corn under various source restrictions in order to assess the impact of source strength on the grain filling.
MATERIAL AND METHODS
Plant material and location. This study was conducted under water stress with the corn Hybrid SC704. The experiments were carried out in Varamin-Iran, during the growing seasons of 2007–2008 and 2008–2009. The site is located at 35°19'N latitude, 51°39'E longitude, with the altitude of 1001 m above the sea level.
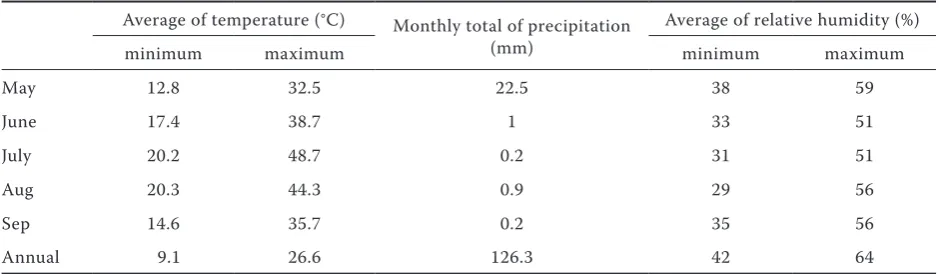
Weather and soil. This region has a semi-arid climate, with mean annual maximum and mini-mum daily air temperatures of 30.8°C and 4.6°C, respectively. The precipitation during the growing season of corn was 6 mm, as show the long-term (1978–2008) meteorological data in Varamin, Iran (Table 1). The soil was a clay loam, low in total nitrogen (5–6 g/kg), very low in organic matter (7–8 g/kg) with a pH of 7.6 and Ec = 0.88 dS/m.
Experimental design. The field experiment was laid out in a randomized complete block-design with split plot arrangement with three replications. Water regimes were allotted to main plots and defoliation levels (source manipulations) to sub-plots.
Irrigation regimes and soil water control. During the growing season, moderately irrigated plants were irrigated when the water soil content reached 75% of the available amount (SWC), cor-responding to the difference between the SWC at field capacity (θFC) and wilting point (θWP).
Soil water content (SWC) = θFC – θWP
Where: θFC and θWP are volumetric soil water contents (%) at FC and WP, respectively.
In plots under water stress (W2), short severe water stress periods at V8 and tasseling stages
were applied, which reduced soil water content to 25% of the available soil water content. So, two weeks of water stress were imposed on plants at each of two short water stress periods. The volu-metric water contents at field capacity (θFC) and permanent wilting point (θWP) were 38% and 18% on a per volume basis, respectively. Therefore, the available soil water content (SWC), volumetric soil water content before irrigation in deficit (θWP + 25% SWC) and fully irrigated (θWP + 75% SWC) plots were 20%, 23% and 33% on a per volume basis, respectively. Soil sampling is employed to determine the soil moisture content of experimental fields before the growing season. The following formulas were used to measure the gravimetric soil water content and soil bulk density (BD):
Gravimetric soil water content = MW/MS × 100% Soil bulk density (BD) = MS/VS = 1.63 g/cm2
Where: MW, MS, and VS are the masses of water present in soil mass (g), the mass of soil solids (g) and the volume of soil sample.
[image:2.595.63.533.623.760.2]Gravimetric soil water content is multiplied by soil bulk density to obtain volumetric soil wa-ter content. The relation between soil resistivity (R) and volumetric water content (W) in experi-mental field at 25°C is found to be given as W = 42.3e–0.01R; R2 = 0.82; P < 0.01 (Figure not shown). During the growth season, this equation is used to convert measured soil resistivity (R) by in-stalled granular matrix sensors (Watermark Soil Moisture Sensors, Irrometer Co. Inc., Riverside, CA) to volumetric soil water content. Granular matrix sensors were located at two depths (30 and 60 cm) in the soil profile near the fibrous root zone. For sensors installations, the hole was augured in 45 degree angle with the horizontal plane to prevent preferential water penetration down the backfilled-augured hole. The net irrigation amount was determined for all of the plots during different
Table 1. Long-term (1978–2008) meteorological data in Varamin, Iran
Average of temperature (°C) Monthly total of precipitation (mm)
Average of relative humidity (%)
minimum maximum minimum maximum
May 12.8 32.5 22.5 38 59
June 17.4 38.7 1 33 51
July 20.2 48.7 0.2 31 51
Aug 20.3 44.3 0.9 29 56
Sep 14.6 35.7 0.2 35 56
vegetative and reproductive stages of deficit and fully irrigated plants to bring soil water content to field capacity (θFC).
The amount of irrigation under stress and moderate irrigation plots was determined by the method described by Madani et al. 2010b. The amount of irrigation during the experimental pe-riod for the moderately irrigated plots and those and under water stress was 7500 and 6000 m3/ ha, respectively. According to the attained grain yields for these two irrigation regimes (Table 1), the values of water use efficiency for the moder-ately irrigated and under water stress plots were 1.2 and 0.9 kg/m3.
Nitrogen application. Diammonium phosphate ((NH4)2HPO4) and urea (CO(NH2)2) fertilizers were employed at a maximum rate of 200 and 200 kg/ha, which corresponds to 36 kg and 92 kg N/ha, respectively. 25, 50 and 25% of total N supply was top-dressed at sowing, V8 ontogenesis stage and tasseling, respectively.
Source manipulation. Defoliation times (V8 and tasseling) and intensities (cutting of one or two thirds of leaf blade) combinations and one control level (five source restriction treatments) were allotted to subplots. Treatment combina-tions consisted of D1: control plants; D2: cutting of one third leaf of blade at V8 ontogenesis stage; D3: cutting of two thirds of leaf blade at V8; D4: cutting of one third of leaf blade at tasseling; D5: cutting of two thirds of leaf blade at tasseling. All plants were defoliated in each experimental unit.
Agronomic practices and sampling. A subplot size of 3.75 m × 7 m, having 5 rows 7 m long was used and sowing was done on 20 May 2007 and 30 May 2008 at the rate of 7 plants per square
meter. Uniformity of sowing depth was achieved by using a hand dibbler to make holes 5 cm deep. The spaces between rows were 75 cm wide. Within each plot, an area of 3.5 m2 was hand harvested on 30 September to estimate the grain and bio-mass yield. Dry weights were recorded after the plant material were oven-dried at 70°C for 48 h. At harvest, a random sample of 15 plants was chosen from two middle rows for recording the number of grains per ear and 1000-grain weight. Harvest index was calculated as the ratio of grain yield to biomass. Source strength was defined as contribution of current photosynthesis for grain filling (%), which is used by Madani et al. (2010a).
Statistical analysis. Data were statistically ana-lyzed using analysis of variance, technique ap-propriate for randomized complete block-design with source restriction (defoliation) factor split on water regime. Duncan’s multiple range test (P < 0.05) was applied for mean separation when F values were significant.
RESULTS AND DISCUSSION
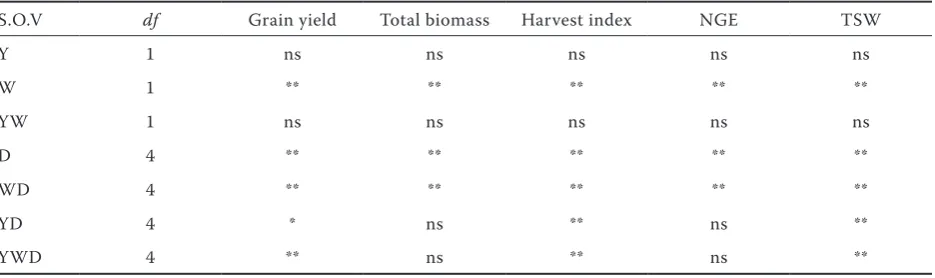
[image:3.595.65.533.86.225.2]In comparison with more optimal water sup-plies, grain yield was significantly reduced by 38.8% due to a more severe post-anthesis water deficiency (Table 2 and 3). Moderate irrigation led to a grain yield of 8.9 t/ha and a significantly higher biomass (16.4%) and harvest index (27.3%) compared to severe water stress (Table 3). It indi-cates that post-anthesis water stress reduced both source strength and sink capacity. The signifi-cant correlation between grain yield and biomass (r = 0.96, P < 0.01) under severe soil water stress Table 2. The mean squares of ANOVA for grain yield, total biomass, harvest index, number of grains per ear (NGE), 1000-grain weight (TSW) in combined analysis of 2007–2008 and 2008–2009 data
S.O.V df Grain yield Total biomass Harvest index NGE TSW
Y 1 ns ns ns ns ns
W 1 ** ** ** ** **
YW 1 ns ns ns ns ns
D 4 ** ** ** ** **
WD 4 ** ** ** ** **
YD 4 * ns ** ns **
YWD 4 ** ns ** ns **
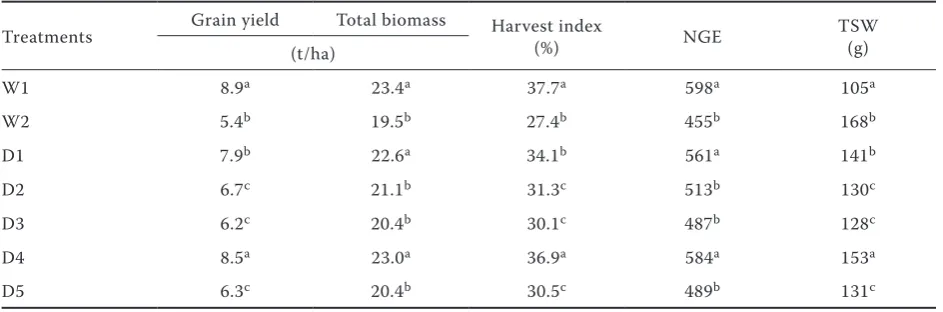
indicates that the reduction in grain yield due to post-anthesis drought was more related to a reduction in post-anthesis dry matter accumula-tion (source strength) than its allocaaccumula-tion to the grain (Figure 1). A shortage of assimilates due to water stress during grain filling significantly reduced the number of grains per ear from 598 to 455 and increased 1000-grain weight from 105 to 168 g (Table 3). Thus, Sinclair and Jamieson (2008) reported that plants regulate their sink capacity (grain set) in accordance to their source strength (N content and sucrose availability) before and around anthesis. Grain yield and number of grains per ear were strongly associated (r = 0.95, P < 0.01),
[image:4.595.63.535.99.255.2]indicating that lower allocation of assimilates to the grains and a low harvest index were mainly due to a reduced number of grains per ear, rather than to grain weight reduction (Figure 2). Grain number is usually determined before flowering (Hugo et al. 1998, Kichey et al. 2007). Thus, water stress after anthesis and during grain filling can cause more reduction in grain weight than grain number. However, Tim et al. (2001) demonstrated that correlation between rate of reduction in kernel weight by current photosynthesis restriction and rate of reduction by drought stress is significant. Cutting of one or two thirds of leaf blade at V8 in moderately irrigated plants significantly reduced Table 3. Means for grain yield, total biomass, harvest index, number of grains per ear (NGE), 1000-grain weight (TSW) as affected by source manipulation at anthesis and post-anthesis water supply in combined analysis of 2007–2008 and 2008–2009 data
Treatments Grain yield Total biomass Harvest index (%) NGE TSW(g)
(t/ha)
W1 8.9a 23.4a 37.7a 598a 105a
W2 5.4b 19.5b 27.4b 455b 168b
D1 7.9b 22.6a 34.1b 561a 141b
D2 6.7c 21.1b 31.3c 513b 130c
D3 6.2c 20.4b 30.1c 487b 128c
D4 8.5a 23.0a 36.9a 584a 153a
D5 6.3c 20.4b 30.5c 489b 131c
W1, W2 – post-anthesis moderate irrigation and serve water deficiency, respectively. D1, D2, D3, D4 and D5 – control plants, cutting of one third leaf blade at V8, cutting of two thirds leaf blade at V8, cutting of one third leaf blade at tasseling, cutting of two thirds leaf blade at tasseling. Means within each column of each category followed by the different letters are significantly different (P < 0.05) according to Duncan test. Categories are separated by blank rows
y= 0.64x– 6.2
R2= 0.96 ; P< 0.01
6 7 8 9 10 11 12 13
20 21 22 23 24 25 26 27 28 29
Grain
yield
(t/ha)
[image:4.595.306.521.552.731.2]Biomass (t/ha)
Figure 1. Relationship between biomass and grain yield
under severe soil water stress Figure 2. Relationship between number of grains per ear with grain yield under various irrigation regimes Number of grains per ear
Grain y
ie
ld (t/ha) y = 0.02x – 3.0
R2 = 0.95; P < 0.01
y = 0.023x – 5.0 R2 = 0.81; P < 0.01 Moderate irrigation Water stress
300 400 500 600 700 800 14
12
10
8
6
4
2
[image:4.595.64.286.554.732.2]harvest index and biomass (Table 3), indicating that pre-anthesis source strength limitation reduces grain yield both through lower dry matter accumu-lation and by reducing the dry matter allocation efficiency to grain filling (Reynolds and Trethowan 2007). It seems that because of controlling the effect of pre-anthesis source strength on sink capacity (Figure 3), the grain set was reduced (Table 3). It means that under high soil water contents, both source strength and sink capacity are limiting factors of grain filling process. However, plants
subjected to cutting of one third of leaf blade at tasseling in severe post-anthesis drought stress increased grain yield compare to the control plants (Table 4). Post-anthesis defoliation thus restricted neither sink capacity nor source strength (bio-mass); moreover, a higher harvest index showed that dry matter allocation to grains (sink capacity related) was improved (Table 4), which may be due to hydrostatic and osmotic pressure gradients utilization between grains and remaining leaves after defoliation (Tim et al. 2001). Depending on
y= 10.22x+ 4.43
R2= 0.74 ; P< 0.05
400 450 500 550 600 650 700 750 800
40 45 50 55 60 65 70 75
N
um
be
r o
f g
ra
in
s p
er
e
ar
(s
in
k
ca
pa
ci
ty
)
[image:5.595.69.345.62.216.2]Current photosynthesis contribution to grain yield % (source strenght)
Figure 3. Relationship between current photosynthesis contributions to grain yield (source strength) with number of grains per ear (sink capacity)
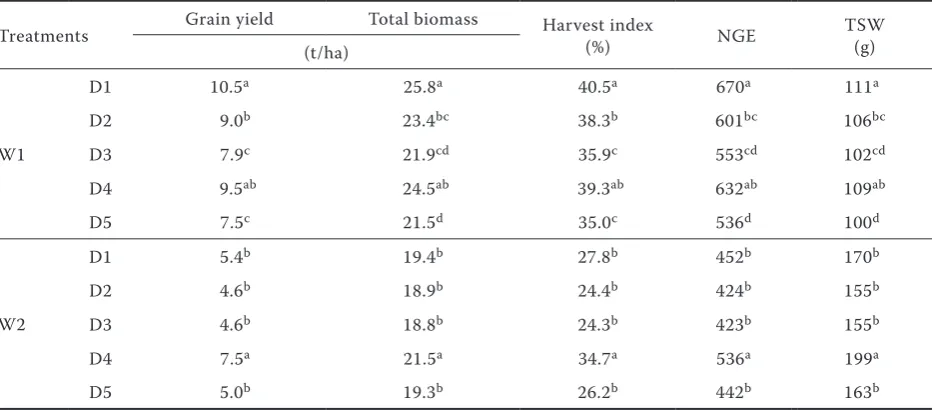
Table 4. Means for grain yield, total biomass, harvest index, number of grains per ear (NGE), 1000-grain weight (TSW) as affected by two-way interactions between all experimental factors in combined analysis of 2007–2008 and 2008–2009 data
Treatments Grain yield Total biomass Harvest index (%) NGE TSW(g)
(t/ha)
W1
D1 10.5a 25.8a 40.5a 670a 111a
D2 9.0b 23.4bc 38.3b 601bc 106bc
D3 7.9c 21.9cd 35.9c 553cd 102cd
D4 9.5ab 24.5ab 39.3ab 632ab 109ab
D5 7.5c 21.5d 35.0c 536d 100d
W2
D1 5.4b 19.4b 27.8b 452b 170b
D2 4.6b 18.9b 24.4b 424b 155b
D3 4.6b 18.8b 24.3b 423b 155b
D4 7.5a 21.5a 34.7a 536a 199a
D5 5.0b 19.3b 26.2b 442b 163b
[image:5.595.65.533.485.690.2]canopy structure, transpiration might be higher than soil evaporation because crop has a greater evapora-tive surface per unit area of ground, compared to the soil. Hence, at W2D4 treatment, leaves transpiration reduction would be higher than soil hydration after defoliation at tasseling, which might result in inhibi-tion of the loss of kernel set (sink capacity) due to water deficit. Yet, at W2D1 treatment, high water loss from leaves in non-defoliated plants subjected to water deficiency led to proportion of florets or decrease in endosperm cell division and alleviating of sink capacity. So, ample assimilates of the leaves would not be result of attainable grain yield without a capable sink. The results showed that the grain yield was not additionally limited by the defoliation under low soil water contents (Table 4). It indicates that under water stress, there is a strong evidence of sink capacity restriction compared to source strength (Ahmadi et al. 2009).
REFERENCES
Ahmadi A., Joudi M., Janmohammadi M. (2009): Late defoliation and wheat yield: little evidence of post-anthesis source limita-tion. Field Crops Research, 113: 90–93.
Bassetti P., Mark E. (1993): Senescence and receptivity of maize silks. Crop Science, 33: 275–278.
Barnabas B., Jager K., Feher A. (2008): The effect of drought and heat stress on reproductive processes in cereals. Plant, Cell and Environment, 31: 11–38.
Eghareuba P.N., Horocks R.D., Zuber M.S. (2006): Dry matter ac-cumulation in maize (Zea mays L.) in response to defoliation. Agronomy Journal, 93: 40–43.
Hugo G.C., Gianoli E., Niemeyer H.M. (1998): Changes in growth and chemical defences upon defoliation in maize. Phytochem-istry, 49: 1921–1923.
Kichey T., Hirel B., Heumez E., Dubios F., Gouis J.L. (2007): In winter wheat (Triticum aestivum L.), post-anthesis nitrogen uptake and remobilisation to the grain correlates with agro-nomic traits and nitrogen physiological markers. Field Crops Research, 102: 22–32.
Irena R., Tollenaar M. (1999): Source: sink ratio and leaf senes-cence in maize: 1. dry matter accumulation and partitioning during grain filling. Field Crop Research, 60: 245–253. Madani A., Shirani-Rad A.H., Pazoki A., Nourmohammadi Gh.,
Zarghami R. (2010a): Grain filling and dry matter partitioning responses to source: sink modifications under post-anthesis water and nitrogen deficiencies in winter wheat (Triticum aestivum L.). Acta Scientarum Agronomy, 32: 145–151. Madani A., Shirani-Rad A., Pazoki A., Nourmohammadi G.,
Zarghami R., Mokhtassi-Bidgoli A. (2010b): The impact of source or sink limitations on yield formation of winter wheat (Triticum aestivum L.) due to post-anthesis water and nitrogen deficiencies. Plant, Soil and Environment, 56: 218–227. Reynolds M.P., Trethowan R.M. (2007): Physiological interventions
in breeding for adaptation to abiotic stress. In: Spiertz J.H.J., Struik P.C., Van Laar H.H. (eds): Scale and Complexity in Plant Systems Research: Gene-Plant-Crop Relations, Wageningen UR Frontis Series, Springer, Dordrecht, 129–146.
Sinclair T.R., Jamieson P.D. (2008): Yield and grain number of wheat: a correlation or casual relationship? Authors’ Response to the importance of grain or kernel number in wheat: a reply to Sinclair and Jamieson by R.A. Fisher. Field Crop Reseach, 105: 22–26. Tim L., Brian A., Melkonian J. (2001): Loss of kernel set due to
water deficit and shade in maize. Crop Science, 41: 1530–1540. Yang Z., Midmore D. (2004): Experimental assessment of the
impact of defoliation on growth and production of water stressed maize and cotton plants. Experimental Agriculture,
40: 189–199.
Yushiharu W., Kunio M., Watanabe K. (1993): Effects of source-to-sink ratio on carbohydrate production and senescence of rice flag leaves during the ripening period. Japanese Journal of Crop Science, 62: 547–553.
Received on April 13, 2010
Corresponding author.
Meysam Oveysi, Islamic Azad University, Department of Agronomy and Plant Breeding, Science and Research Branch, Tehran, Iran