ORIGINAL RESEARCH
BRAIN
Diffusion-Weighted Imaging with Dual-Echo Echo-Planar
Imaging for Better Sensitivity to Acute Stroke
S.J. Holdsworth, K.W. Yeom, M.U. Antonucci, J.B. Andre, J. Rosenberg, M. Aksoy, M. Straka, N.J. Fischbein, R. Bammer, M.E. Moseley, G. Zaharchuk, and S. Skare
ABSTRACT
BACKGROUND AND PURPOSE: Parallel imaging facilitates the acquisition of echo-planar images with a reduced TE, enabling the incor-poration of an additional image at a later TE. Here we investigated the use of a parallel imaging– enhanced dual-echo EPI sequence to improve lesion conspicuity in diffusion-weighted imaging.
MATERIALS AND METHODS: Parallel imaging– enhanced dual-echo DWI data were acquired in 50 consecutive patients suspected of stroke at 1.5T. The dual-echo acquisition included 2 EPI for 1 diffusion-preparation period (echo 1 [TE⫽48 ms] and echo 2 [TE⫽105 ms]). Three neuroradiologists independently reviewed the 2 echoes by using the routine DWI of our institution as a reference. Images were graded on lesion conspicuity, diagnostic confidence, and image quality. The apparent diffusion coefficient map from echo 1 was used to validate the presence of acute infarction. Relaxivity maps calculated from the 2 echoes were evaluated for potential complementary information.
RESULTS: Echo 1 and 2 DWIs were rated as better than the reference DWI. While echo 1 had better image quality overall, echo 2 was unanimously favored over both echo 1 and the reference DWI for its high sensitivity in detecting acute infarcts.
CONCLUSIONS: Parallel imaging– enhanced dual-echo diffusion-weighted EPI is a useful method for evaluating lesions with reduced diffusivity. The long TE of echo 2 produced DWIs that exhibited superior lesion conspicuity compared with images acquired at a shorter TE. Echo 1 provided higher SNR ADC maps for specificity to acute infarction. The relaxivity maps may serve to complement information regarding blood products and mineralization.
ABBREVIATIONS:DW⫽diffusion-weighted; GRAPPA⫽generalized autocalibrating partially parallel acquisition; GRE⫽gradiant-recalled echo; PI⫽parallel imaging; R2⫽relaxivity map
D
iffusion-weighted imaging plays a key role in evaluating mul-tiple neurologic diseases, including stroke.1-7In DWI, the image intensity reflects the rate of water diffusion at a given loca-tion, but DWI also remains sensitive to T1 and T2 relaxation (and proton attenuation). T1 relaxation effects can be mitigated by using a long TR to allow longitudinal relaxation. Due to the in-sertion of the diffusion gradients and the associated TEprolonga-tion, however, T2 effects cannot be mitigated during image acqui-sition. Thus, T2 and diffusion effects are entangled on DWI, though it is often clinically important to differentiate their relative contribution to the final image. Therefore, the quantitative ADC images are produced, which remove the T2 weighting effect.8,9
The most efficient, reliable, and thereby conventional method for DWI acquisition is with the EPI technique. A significant lim-itation of diffusion-weighted (DW)-EPI is the presence of suscep-tibility artifacts, which manifest as geometric distortion, signal drop-out, and image blurring. To reduce such artifacts in DW-EPI, parallel imaging (PI)10,11can be used to accelerate EPI.12,13 In PI-enhanced EPI, the echo train is shortened, thereby reducing TE. A short TE in DWI is typically considered as advantageous because it results in a higher SNR and reduces the T2 contrast. However, because many lesions with reduced diffusivity also have prolonged T2 values compared with the surrounding tissue,14a short TE may reduce the conspicuity of ischemic lesions.
With the hypothesis that improved conspicuity of lesions with reduced diffusivity can be achieved by longer TEs than in conven-Received August 9, 2013; accepted after revision December 5.
From the Department of Radiology (S.J.H., K.W.Y., M.U.A., J.R., M.A., M.S., N.J.F., R.B., M.E.M., G.Z.), Stanford University, Stanford, California; Department of Radiology (J.B.A.), University of Washington, Seattle, Washington; and Clinical Neuroscience (S.S.), Karolinska Institute, Stockholm, Sweden.
This work was supported by the National Institutes of Health (2R01 NS047607-06, 2R01 EB00271108-A1, 5RO1 EB008706, 5R01 EB01165402– 02), the Center of Advanced MR Technology at Stanford (P41 EB015891), and the Lucas Foundation.
Please address correspondence to Samantha Holdsworth, PhD, Department of Radiology, Stanford University, Lucas Center, 1201 Welch Rd, Stanford, CA 94305-5488; e-mail: [email protected]
Indicates open access to non-subscribers at www.ajnr.org
tional practice, 1 option is to simply increase the TE (within rea-sonable limits) of a DWI acquisition. Another option is to in-crease the b-value (which also inin-creases the contribution of reduced diffusion in the signal). Unfortunately, both approaches reduce the SNR of the ADC image (computed from theb⫽0 and the DWI), which is used for diagnostic specificity. Another option is to add a second DW echo within the same TR15,16—an ap-proach that does not significantly impact the overall scanning time. Figure 1 depicts this dual-echo DWI approach, with 2 EPI trajectories acquired for 1 diffusion-preparation period (echo 1 and echo 2, respectively). Here, echo 2 is used to increase the sensitivity to lesions, and echo 1 provides a higher SNR image used to calculate the ADC. Furthermore, relaxivity (R2) maps can be calculated from the 2
b⫽0 images to potentially reveal an additional source of image con-trast without additional scanning time.
In this work, we imaged patients clinically suspected of acute or subacute stroke by using a PI-enhanced dual-echo DW-EPI sequence on a 1.5T clinical scanner to explore the impact that a longer TE might have on clinical management and patient out-come. Our aim was to evaluate the 2 diffusion-weighted echoes (echo 1 and echo 2) obtained from the dual-echo sequence on image quality, lesion quality, and diagnostic quality metrics, and to evaluate relaxivity maps calculated from the 2 echo images as a potential additional source of image contrast.
MATERIALS AND METHODS
Patient StudiesAll data were acquired on an inpatient 1.5T MR imaging system (Signa HD; GE Healthcare, Milwaukee, Wisconsin) equipped with an 8-channel head coil. With institutional review board ap-proval, 50 consecutive adult patients who were clinically sus-pected of stroke were scanned with the dual-echo DWI sequence
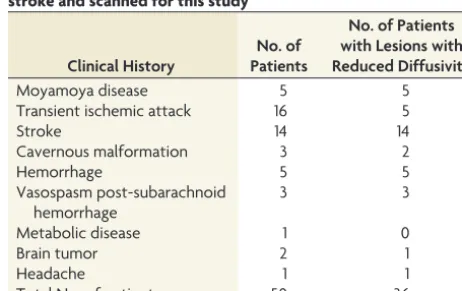
between January 13, 2011, and April 6, 2011. The product DWI sequence used as part of standard of care at our institution was used as the criterion standard comparison DWI sequence for this study. We also acquired additional routine MR images relevant to the clinical scenario: T2-weighted FLAIR, T2-weighted gradient-recalled echo (GRE), fast spin-echo, MRA of the circle of Willis, and bolus perfusion imaging. The final clinical diagnosis was based on the imaging findings that were correlated with appropri-ate clinical symptoms (Table 1).
Imaging Sequence and Reconstruction
Our generalized autocalibrating partially parallel acquisition (GRAPPA)-accelerated DWI sequence was modified to include a second-echo EPI trajectory succeeding a second 180° refocusing pulse (Fig 1). Patient data were acquired by using the following imaging parameters: GRAPPA acceleration factor of R⫽3, FOV⫽
[image:2.594.56.530.45.311.2]FIG 1. Dual-echo DWI pulse sequence showing the section-select module (blue); diffusion preparation period (yellow); and the first and second imaging echoes (echoes 1 and 2 acquired at 2 different TEs, TE1and TE2) separated by a 180° refocusing pulse.
Table 1: Clinical history of the 50 patients who were suspected of stroke and scanned for this studya
Clinical History
No. of Patients
No. of Patients with Lesions with Reduced Diffusivity
Moyamoya disease 5 5
Transient ischemic attack 16 5
Stroke 14 14
Cavernous malformation 3 2
Hemorrhage 5 5
Vasospasm post-subarachnoid hemorrhage
3 3
Metabolic disease 1 0
Brain tumor 2 1
Headache 1 1
Total No. of patients 50 36
a
[image:2.594.301.532.371.516.2]24 cm, acquisition matrix⫽192⫻192, 5-mm/0-mm section thick-ness/gap, partial Fourier encoding with 24 overscans, TE1/TE2⫽ 48/105 ms, Stejskal-Tanner diffusion preparation,17tetrahedral en-coding (4 diffusion directions) withb⫽1000 s/mm2, and 1 T2-weighted (b⫽0) image. Each volume was acquired by using 3 inter-leaves. The fully sampledb⫽0 image was formed after combining the 3 interleaves and was used to enable the estimation of GRAPPA weights. These estimated GRAPPA weights were applied to all inter-leaves of all acquired volumes separately, including theb⫽0 volume itself.13A TR of 3 seconds was used to keep T1 saturation effects small in the brain parenchyma (resulting in 95.8% and 99.3% T1 recovery at 1.5T, assuming a T1⫽950 ms/600 ms for gray and white matter, respectively18). A maximum of 23 sections was permitted in a TR of 3 seconds, and the total scanning time was 2 minutes 15 seconds. The product DWI sequence scanned routinely at our institution was used as the criterion standard DWI sequence for this study, which used a PI-enhanced (sensitivity encoding–type) EPI sequence with the fol-lowing parameters: matrix size⫽128⫻128, acceleration factor R⫽ 2, partial Fourier encoding, TR/TE⫽8 seconds/70 ms, twice-refo-cused19,20diffusion preparation, 23 sections with a 5-mm/0-mm sec-tion thickness/gap, partial Fourier encoding with 16 overscans, 3 dif-fusion directions withb⫽1000 s/mm2, one T2-weighted (b⫽0) image, and a scanning time of 50 seconds.
The postprocessing of the dual-echo DWI data was performed
by using a compiled and multithreaded Matlab code (Version 7.8.0; MathWorks, Natick, Massachusetts). Both echoes (echo 1 and echo 2) were reconstructed and sent to our hospital image data base (PACS). These DWI datasets included the isotropic DWI from the 2 echoes (E1andE2); the isotropic ADC calculated from theb⫽0 andb⫽1000 s/mm2from echo 1; and the relax-ivity maps,R2, calculated from the average of theb⫽0 andb⫽ 1000 s/mm2relaxivity maps as follows:
R2⫽1
2(RE1⫹RE2)⫽ 1 2
冉
log(B02/B01)
TE2⫺TE1 ⫹
log(DW2/DW1)
TE2⫺TE1
冊
,whereB0represents theb⫽0 s/mm2image, andDW,theb⫽ 1000 s/mm2image at 2 TEs.
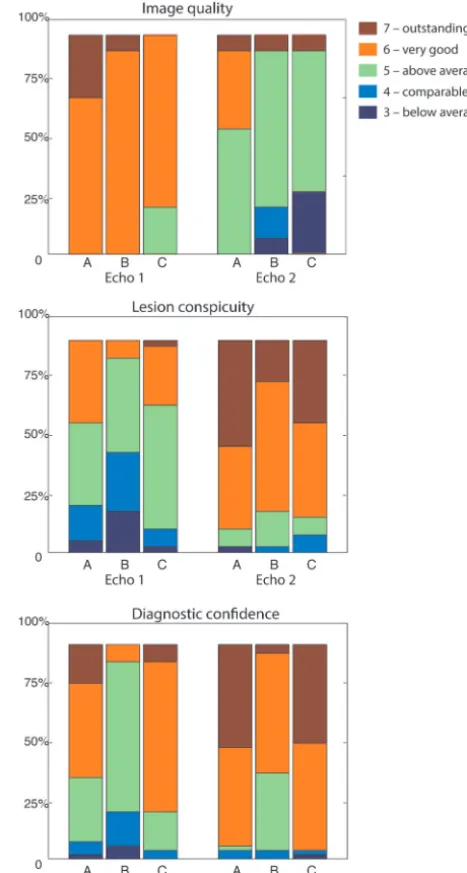
[image:3.594.297.531.49.485.2]FIG 2. Assessment of readers A, B, and C of image quality, lesion conspicuity, and diagnostic confidence. Nominal values of 3–7 repre-sent reader grading compared with the product DW-EPI (assigned as 4), represented by the percentage of total assigned values. Note that values of 1–2 (corresponding to “nondiagnostic” and “poor”) are not shown because these values were not assigned in this study.
Table 2: Agreement among readers on specific ratings using a weightedstatistic (Nⴝ50)a
Echo 1 Echo 2
Diag
Conf Conspicuity Quality Diag
Conf Conspicuity Quality A vs B ⫺0.05 0.10 0.00 0.07 ⫺0.00 ⫺0.09
A vs C 0.10 0.13 0.31 0.16 0.13 ⫺0.09
B vs C 0.02 ⫺0.02 0.00 0.09 0.14 0.31
Note:—Diag Conf indicates diagnostic confidence. a
[image:3.594.53.287.64.134.2]All ratings are withP⬎.14.
Table 3: Preference for the second echo over the first echo
Reader Fraction Percentage 95% CI PValue (1-tailed)
Reader A 35/50 70% (55%–82%) .003
Reader B 38/50 76% (62%–87%) ⬍.001
Reader C 34/50 68% (53%–80%) .008
Table 4: Percentage of cases rated greater than the product DWI (Nⴝ50)
Echo 1 Echo 2
Diag
Conf Conspicuity Quality Diag
Conf Conspicuity Quality
A vs B 92% 84% 100% 96% 98% 100%
A vs C 78% 66% 100% 96% 98% 92%
B vs C 96% 92% 100% 96% 94% 94%
Note:—Diag Conf indicates diagnostic confidence.
Table 5: Mean (SD) of ratings (Nⴝ50)
Diagnostic
Confidence Conspicuity Quality Echo 1 Echo 2 Echo 1 Echo 2 Echo 1 Echo 2 Reader A 5.7 (0.9) 6.4 (0.7) 5.1 (1.0) 6.3 (0.9) 6.3 (0.5) 5.5 (0.6) Reader B 4.8 (0.7) 5.6 (0.6) 4.4 (0.9) 6.0 (0.7) 5.8 (0.4) 4.5 (1.0)a
Reader C 5.8 (0.6) 6.4 (0.8) 5.2 (0.7) 6.1 (0.9) 6.1 (0.3) 4.8 (0.7)b
a
P⫽.004. b
[image:3.594.52.284.170.216.2]Imaging Evaluation
Three blinded board-certified neuroradiologists (readers A–C) with 7 years’, 5 years’, and 1 year experience, respectively, inde-pendently evaluated the DWIs of echo 1 and echo 2 for lesions with reduced diffusivity in 50 patients admitted for possible stroke. Each reader, blinded to the clinical symptoms and final diagnosis, first viewed the DWI from echo 1, followed by the DWI from echo 2, by using the reference product DWI as the criterion standard. The neuroradiologists made following evaluations:
1) Presence/absence of DWI-hyperintense lesions on echoes 1 and 2 (yes/no)
2) Diagnostic confidence for each echo DWI (echo 1 and 2) rel-ative to the reference image
3) For cases with DWI-hyperintense lesions, the lesion conspicu-ity of each echo image relative to the reference image 4) For cases without DWI-hyperintense lesions, the image
qual-ity of each echo image relative to the reference image
5) Overall preference for the DWI from echo 1 or echo 2 (binary forced choice).
Diagnostic confidence, lesion conspicuity, and image quality for the DWI echo images were scored on the following 7-point Likert scale: 1, nondiagnostic; 2, poor; 3, acceptable; 4, compara-ble with product DWI (the criterion standard); 5, above average; 6, very good; and 7, outstanding.
Reader B made the following additional evaluations:
1) The number of new lesions seen on the DWI of echo 2 com-pared with that of echo 1
2) The presence of something new on the DWI of echo 2 com-pared with that of echo 1 (yes/no)
3) Clinical impact: if additional information was garnered from the DWI of echo 2, would this alter clinical management, such as therapy or clinical referral? (0, no; 1, possible; 2, yes).
[image:4.594.57.534.46.452.2]For this last scenario, a representative case might be one in which echo 2 identified additional focal lesions in the same vas-cular territory. In such a case, clinical management would likely not be altered (score 0). However, if other lesions were seen in new vascular distribution, a more detailed clinical investigation may ensue for a potential embolic source (score 1). Alternatively, if echo 2 identified a new lesion in a case previously interpreted as having negative findings, management may alter in terms of pa-tient risk stratification for future stroke or initiating therapies for the current lesion or for future stroke prevention (score 2).
Lesion conspicuity and diagnostic confidence took into ac-count the readers’ ability to readily observe lesions against the background tissue, as well as lesion delineation. Diagnostic con-fidence, clinical impression, and clinical impact were assessed in the context of other imaging data (ADC, FLAIR, GRE). Small lesions on echo 2 that were difficult to confirm on ADC were given independent assessments from the readers as to whether their presence increased or decreased diagnostic confidence. Final clin-ical diagnosis was made by using all clinclin-ical and imaging material (including previous examinations, if available) and served as ground truth for the study.
Lesions detected by echo 2 were validated for the presence of acute infarction by using the ADC from echo 1. If these lesions did not have reduced diffusivity, FLAIR images were used to identify possible associated parenchymal T2 hyperintensity. Extra-axial hemorrhage was excluded from this assessment.
Relaxivity Maps
The relaxivity maps were viewed and weighed against all other imaging data for potential complementary diagnostic information.
Statistical Analysis
All statistical analyses were performed with STATA, Release 11.1 (StataCorp, College Station, Texas). Agreement among read-ers was assessed by a linearly weighted statistic. Preference for echo 1 or echo 2 was tested with an exact binomial test with a null value of 0.5. Tests for superi-ority compared with standard imaging were performed with 2-tailed Wilcoxon signed rank tests with a null median of 4 on the Likert scale (comparable with product DWI). Tests for differences in ratings between echo 1 and echo 2 were performed by using 2-tailed Wilcoxon signed rank tests. There was no correction for multiple comparisons.
[image:5.594.63.366.48.313.2]RESULTS
Table 1 shows the clinical diagnoses of all the patients who were referred for diagnostic work-up for stroke-like symptoms. Lesions with reduced diffu-sivity were found in 36 of the 50 pa-tients. Readers B and C were in perfect agreement in assessing the presence of lesions with reduced diffusivity, and both differed from reader A in 4 cases (2 patients with lesions that had reduced diffusiv-ity, and 2 lesions without reduced diffusivity;⫽0.80; 95% CI, 0.58 – 0.95).
There was little agreement among readers for specific ratings (Table 2), yet all 3 readers preferred the DWI of echo 2 over echo 1 for patients with lesions with reduced diffusivity (Table 3). Echo 1 and echo 2 images were consistently preferred over the product DWI (reference) image (Table 4). For all readers, echo 1 had bet-ter image quality than echo 2 because echo 1 was subjectively a more aesthetically pleasing and higher SNR image. However, echo 2 was rated higher than echo 1 for lesion conspicuity and diagnos-tic confidence (Table 5). Figure 2 depicts individual reader assess-ment of image quality, lesion conspicuity, and diagnostic confi-dence for echoes 1 and 2, respectively, as a percentage of the total assigned values per reader. The median values for echo 1 and 2 assessments for all patients were the following: 6 and 5, respec-tively, for image quality; and 5 and 6, respecrespec-tively, for lesion con-spicuity and diagnostic confidence.
Seventy-two new lesions were identified on echo 2 DWI (that were not seen on echo 1) in 46% of evaluated patients. Of these, 67 were confirmed as lesions with reduced diffusivity based on the ADC generated from echo 1. Three lesions were too small to as-sess; 2 were deemed to represent edema associated with T2 pro-longation based on ADC. The 72 newly identified lesions with reduced diffusivity on echo 2 were seen in 18 patients with acute
infarction and 3 patients with intracranial hemorrhage. Of the 18 patients with acute infarction, 2 had embolic infarcts from cardiac causes, 4 had infarcts related to underlying Moyamoya disease, 4 had ischemic lesions related to vasospasm and prior aneurysm coiling/clipping, 1 had isch-emic changes adjacent to operative site, and 7 patients had infarcts that were not other-wise specified clinically. Due to its added sensitivity to diffusion lesions, it was pre-dicted that echo 2 would have impacted stroke work-up in 16% of cases (8 patients) and potentially influenced 32% of cases (16 patients).
[image:6.594.63.365.47.300.2]Figure 3 is representative of a case in which the routine product DWI sequence demonstrated lower diagnostic confi-dence compared with echoes 1 and 2.
Figure 4 depicts 2 cases in which echo 2 demonstrates improved lesion conspi-cuity compared with echo 1. These pa-tients had recently undergone surgery, and the findings on echo 2—while not likely to alter clinical management as de-termined during the radiologists’ read-ings— better defined the nature of the postoperative changes (such as local
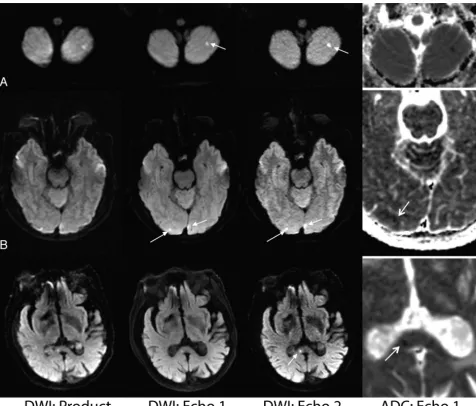
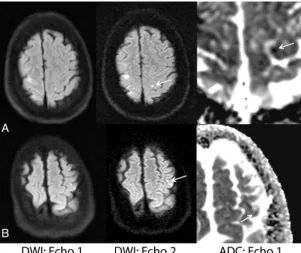
isch-FIG 5. Examples in which additional lesions identified by echo 2 suggested a potential under-lying mechanism of stroke and potentially altered diagnostic impression and clinical manage-ment.A, A 60-year-old woman with vasospasm after subarachnoid hemorrhage.B, A 65-year-old woman with embolic infarcts who also had lesions in the right cerebral hemisphere more inferiorly (not shown). On both patients, echo 2 showed missed sites of reduced diffusivity on the contralateral hemisphere (arrows), suggesting multiple vascular distribution involvement (vasospasm in multiple vascular territories or embolic source). Note that the lesions were ret-rospectively observed on echo 1 (but not on the product DWI).
[image:6.594.53.535.410.677.2]emia and/or hemorrhage), potentially revealing etiologies for perioperative symptoms.
Figure 5 depicts examples in which echo 2 identified lesions with reduced diffusivity that were missed on echo 1. Here, a site of reduced diffusivity (confirmed on ADC, formerly missed by both echo 1 and the reference DWI) in the contralateral cerebral hemisphere was identified, raising the possibility of an embolic source of infarction.
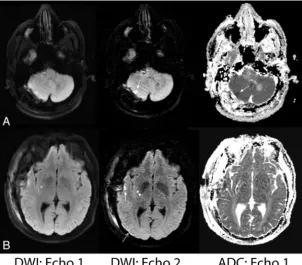
In 2 cases, echo 2 revealed lesions that would not have been deemed acute (hyperintense lesions on echo 2 DWI but not con-firmed by ADC and associated with high signal on FLAIR). In 1 such case, echo 2 revealed a halo of hyperintense signal resembling edema (Fig 6A), prompting the readers to review the ADC map. In another case, echo 2 identified both acute (low signal on ADC) and subacute (isointense to slightly bright signal on ADC) evolving areas of infarc-tion (Fig 6B) as hyperintense foci. Without the aid of ADC, echo 2 thus overestimated regions of acute ischemia in this case.
Figure 7 shows both echo 1 and echo 2 DWI and ADC of a patient with multiple embolic infarcts. Fourteen new lesions were found on
the DWI of echo 2 in this patient, all of which were confirmed as lesions with de-creased diffusivity on ADC of echo 1.
Relaxivity Maps
The R2maps were deemed useful in sev-eral regards. Both acute and chronic in-farcts demonstrated low R2 values that were readily apparent. Even small areas of ischemia were identified on the R2 maps. For instance, R2 maps frequently identified lesions presumed to represent chronic small-vessel ischemic disease in the periventricular and subcortical white matter, a finding typically identified on FLAIR and T2-weighted images. The R2 maps identified areas of subarachnoid, old cerebellar, and intraventricular hem-orrhage (including some foci that were difficult to visualize on the GRE scan). Mineralization was depicted as regions of high R2and was particularly notable in the basal ganglia (Fig 8).
DISCUSSION
This work investigated an alternative-ap-proach DWI with the use of a PI-enhanced dual-echo sequence. Typically, DWI se-quences use the shortest TE available by the vendor to avoid significant T2-weighting. The primary underlying concern is that a longer TE will result in a lower SNR, and a higher rate of false-positive lesions (that is, lesions that do not have reduced diffusivity) on DWI from increased T2-weighting. However, many lesions with reduced diffu-sivity also have a prolonged T2 value com-pared with the surrounding tissue6,8; thus, DWI studies may benefit from a longer TE. Improved conspicuity of ischemic lesions bought by long TEs has also incidentally been observed in a compar-ison among DWI acquired with different imaging parameters.9
The findings in this work support the use of a DWI approach that achieves both a high effective resolution through the use of PI and a long TE to draw the radiologist’s attention to acute ischemic lesions. However, because PI effectively shortens the TE, one ap-proach is to “waste” sequence time and use a longer TE, and the other is to incorporate a more sensitive second echo at a reason-able TE, as done in this work, and thereby use the information from both echoes. With the acquisition of 2 echoes acquired at different TEs within 1 diffusion-preparation period, we found that one can use echo 2 for improved sensitivity to ischemic le-sions with reduced diffusivity.
Radiologist Ratings
This study found that the DWI from echo 2 was useful for lesion delineation and improved detection compared with the DWI
[image:7.594.52.372.46.428.2]from echo 1 and the product DWI. Echo 2 was rated higher than both echo 1 and the reference product DWI for lesion conspicuity and diagnostic confidence (Fig 2). Echo 1 was rated as better than the product DWI sequence. While several lesions showed higher signal intensity on the product DWI than on echo 1 (related to the intermediate TE of the product DWI [70 ms] between that of echo 1 [48 ms] and that of echo 2 [105 ms]), echo 1 was preferred for its ability to resolve lesions.
Seventy-two additional lesions were identified on echo 2 (that were not seen on echo 1 in the initial reading) in 23 patients diagnosed with acute infarct. Of these, 93% were deemed le-sions with “reduced diffusion” on ADC, 4% were too small to assess, and the remaining 3% were chronic lesions. As a result, of the 50 patients scanned for this study, the findings on echo 2 were predicted to have impacted stroke work-up in 16% of cases (8 patients) and potentially influenced 32% of cases (16 patients).
Echo 2 was rated lower than echo 1 for image quality—pre-sumably on the basis of its reduced SNR. However, our data sug-gest that the benefit of heightened lesion conspicuity and diagnos-tic quality of echo 2 far outweighs the resultant decrease in image quality during clinical image interpretation. This benefit becomes particularly evident in the scoring of the 14 studies with negative findings. Despite consistently scoring echo 2 as having lower
im-age quality, the clinical confidence in a negative study remained high. We specu-late that this reflects the high sensitivity associated with echo 2. In addition, the more uniform background signal associ-ated with echo 2 allowed greater reliability in radiologic interpretation and in distin-guishing infarct from heightened coil sen-sitivity at the periphery of the image. This observation, coupled with improved sen-sitivity to lesions with reduced diffusivity, likely increased confidence in interpret-ing examinations as havinterpret-ing negative find-ings when correlated with subsequent studies.
Representative Cases
Figure 3 is representative of a case in which the routine product DWI sequence demonstrated lower diagnostic confi-dence, due to inferior image quality, com-pared with echoes 1 and 2. In this case, a small infarct present on the dual-echo DWI on Fig 3Cwas initially missed on the product DWI, a finding that could have prompted further clinical investigation for the source or altered risk for future stroke. Figures 4 and 5 show cases in which echo 2 demonstrated improved le-sion conspicuity and diagnostic confi-dence compared with echo 1. Figure 5 also shows an example of a missed contralat-eral lesion that would have changed the clinical management of the patient be-cause it raised the possibility of an embolic source of infarction. Note that many lesions detected on echo 2 could be seen retrospec-tively, either by a side-by-side comparison with echo 1 or the product DWI, or simply by scrolling through the images at a considerably slower rate than is performed in a typical clinical practice.
Of the lesions that were either too small to assess or deemed chronic, we would argue that an image with heightened sensi-tivity to lesions with a relatively small false-positive rate is preferred over a less sensitive technique where one may miss lesions. Figure 6 shows 2 examples in which the heightened sensitivity of echo 2 to both acute and chronic lesions prompted radiologists to probe other imaging sequences to render the final imaging impression. In these instances, the radiologists still preferred echo 2 because combining the infor-mation obtained in echo 2 with the ADC generated from echo 1 improved specificity and guided their diagnostic process. Nevertheless, for any TE, DWI contains mixed contributions from diffusion, proton attenuation, and T2 effects.9Even by using a single-shot EPI technique, T2 contrast on DWI is never completely eliminated because the TE is too long (mainly due to the presence of the diffusion-preparation time). Thus, in-terpreting echo 2 in isolation can yield false-positive results. DWI should be used to screen for lesions and then should be
FIG 8. A sample case showing the potential contribution of the R2map. A 69-year-old female
patient with vasospasm after subarachnoid hemorrhage. The low-R2lesion is more conspicuous
than the corresponding T2 hyperintensity on the FLAIR image. On the basis of DWI/ADC, this area represents acute right MCA territory infarction. The potential contribution of the R2map
with regard to timing of stroke and its evolution is unknown but prompts future investigation. The R2map also shows more conspicuous mineralization in the basal ganglia than the
[image:8.594.55.371.47.360.2]interpreted with reference to images obtained with other se-quences, such as FSE, FLAIR, and the ADC map.21
Practical Considerations
While the DWI of echo 2 was considered superior to that of echo 1 in all measures apart from image quality, one must acquire a higher SNR echo 1 image to produce an ADC map to aid diagnostic specificity. Figure 7 shows echo 1 and echo 2 DWI and ADC maps of a patient with multiple embolic infarcts—illustrating the difficulty of decoupling noise from the infarct on the ADC of echo 2. Figure 7 also demonstrates that echo 2 can be more reliable in distinguishing in-farct from heightened coil sensitivity present at the periphery of the image (particularly the posterior brain regions) on echo 1.
Relaxivity Maps
Another advantage of the dual-echo approach is that R2maps can be computed from theb⫽0 andb⫽1000 images acquired from the first and second echo, to reveal a potentially useful, additional image contrast typically acquired with a separate scan (Fig 8). Although not thoroughly studied, R2maps were particularly use-ful for visualizing hemorrhagic material and hemorrhagic trans-formation within a stroke, areas of mineralization, and new and old areas of infarction. In this capacity, relaxivity maps generated from the dual-echo process might provide complementary infor-mation otherwise obtainable only by requisite sequences such as FLAIR or GRE, though further research will be needed to fully explore this observation.
Limitations
With a PI factor of 3 to shorten the EPI readout coupled with the clinical DWI parameters used in this work, it was possible to ac-quire echo 2 with no increase in overall scanning time compared with its single-echo alternative, because its incorporation exploited the dead time of the sequence (ie, for 23 sections, the second echo fit within the TR of 3 seconds that we typically use clinically at our institution). However, a caveat of the dual-echo approach is that the scanning time will increase if one desires thinner sections or a higher spatial resolution than used in this work. For example, a section thickness of 3 mm coupled with 38 sections to maintain the same brain coverage as used here will result in an⬃25% increase in scan-ning time compared with the single-echo alternative (for the same in-plane resolution and TR used in this study).
Another limitation of this study is our use of the Stejskal-Tanner diffusion preparation, rather than the twice-refo-cused19,20diffusion preparation sequence that minimizes eddy current effects. We purposely chose the Stejskal-Tanner approach to help minimize the TE of echo 2—to increase the SNR and avoid excessive T2 contrast; however, this resulted in eddy current–in-duced artifacts that manifested as blurring in the final DWI of both echoes. These artifacts can be reduced with the use of eddy current– correction methodology.22,23
Future Work
There are additional ways one may be able exploit a dual-echo sequence to reveal useful information. Because both echoes share the same coil sensitivity profile, one can “flatten” the DWI by removing the coil sensitivity.24While one cannot decouple
pro-ton attenuation from coil sensitivity by using this approach, the resulting image contrast may be an interesting one to explore and will be the subject of further investigation.
CONCLUSIONS
The PI-enhanced dual-echo DWI approach is a useful method for evaluating DWI lesions. Echo 2 can be used for added sensitivity in detecting lesions with reduced diffusivity; echo 1, for higher SNR ADC maps, while R2maps calculated from both echoes may provide a potential source of complementary information. We also demonstrated that many new lesions became apparent on echo 2 that predominantly reflected acute ischemia or brain in-jury, and we maintain that the TE in DWI can be exploited to draw the radiologist’s attention to such lesions.
ACKNOWLEDGMENTS
We would like to thank Patrick D. Barnes for his generous support and assistance with this study.
Disclosures: Murat Aksoy—RELATED:Grant: National Institutes of Health. Matus Straka—UNRELATED:Employment: Kantonsspital Winterthur, Winterthur Switzer-land,OTHER RELATIONSHIPS: Director of Research, iSchemaView Inc. Roland Bam-mer—RELATED:Grant: National Institute of Biomedical Imaging and Bioengineer-ing,*UNRELATED:Board Membership: iSchemaView Inc,Comment: member, Board of Directors (no payment),Stock/Stock Options: iSchemaView Inc, founder. Michael E. Moseley—UNRELATED:Grants/Grants Pending: National Institutes of Health,* Na-tional Institute of Neurological Disorders and Stroke.* Greg Zaharchuk—UNRELATED: Grants/Grants Pending: GE Healthcare.* *Money paid to the institution.
REFERENCES
1. Le Bihan D, Douek P, Argyropoulou M, et al.Diffusion and perfu-sion magnetic resonance imaging in brain tumors.Top Magn Reson Imaging1993;5:25–31
2. Hajnal JV, Doran M, Hall AS, et al.MR imaging of anisotropically restricted diffusion of water in the nervous system: technical, ana-tomic, and pathologic considerations. J Comput Assist Tomogr
1991;15:1–18
3. Sorensen AG, Buonanno FS, Gonzalez RG, et al.Hyperacute stroke: evaluation with combined multisection diffusion-weighted and he-modynamically weighted echo-planar MR imaging. Radiology
1996;199:391– 401
4. Henkelman R.Diffusion-weighted MR imaging: a useful adjunct to clinical diagnosis or a scientific curiosity?AJNR Am J Neuroradiol
1990;11:932–34
5. Patterson DM, Padhani AR, Collins DJ.Technology insight: water diffusion MRI—a potential new biomarker of response to cancer therapy.Nat Clin Pract Oncol2008;5:220 –33
6. Sugahara T, Korogi Y, Kochi M, et al. Usefulness of diffusion-weighted MRI with echo-planar technique in the evaluation of cel-lularity in gliomas.J Magn Reson Imaging1999;9:53– 60
7. Sumi M, Sakihama N, Sumi T, et al.Discrimination of metastatic cervical lymph nodes with diffusion-weighted MR imaging in pa-tients with head and neck cancer. AJNR Am J Neuroradiol
2003;24:1627–34
8. Le Bihan D, Breton E, Lallemand D, et al.MR imaging of intravoxel incoherent motions: application to diffusion and perfusion in neu-rologic disorders.Radiology1986;161:401– 07
9. Burdette JH, Elster AD, Ricci PE.Acute cerebral infarction: quanti-fication of spin-density and T2 shine-through phenomena on dif-fusion-weighted MR images.Radiology1999;212:333–39
10. Pruessmann KP, Weiger M, Scheidegger MB, et al.SENSE: sensitivity encoding for fast MRI.Magn Reson Med1999;42:952– 62
12. Bammer R, Auer M, Keeling SL, et al.Diffusion tensor imaging using single-shot SENSE-EPI.Magn Reson Med2002;48:128 –36 13. Skare S, Newbould RD, Clayton DB, et al.Clinical multishot
DW-EPI through parallel imaging with considerations of susceptibility, motion, and noise.Magn Reson Med2007;57:881–90
14. Geijer B, Sundgren PC, Lindgren A, et al.The value of b required to avoid T2 shine-through from old lacunar infarcts in diffusion-weighted imaging.Neuroradiology2001;43:511–17
15. Feinberg DA, Kiefer B, Litt AW.Dual contrast GRASE (gradient-spin echo) imaging using mixed bandwidth. Magn Reson Med
1994;31:461– 64
16. Gallichan D, Andersson JL, Jenkinson M, et al.Reducing distortions in diffusion-weighted echo planar imaging with a dual-echo blip-reversed sequence.Magn Reson Med2010;64:382–90
17. Stejskal EO, Tanner JE.Spin diffusion measurements: spin echoes in the presence of a time-dependent field gradient. J Chem Phys
1965;42:288 –92
18. Bernstein MA, King KF, Zhou XJ.Handbook of MRI Pulse Sequences.
Burlington, Massachusetts: Elsevier Academic Press; 2004
19. Feinberg DA, Jakob PD.Tissue perfusion in humans studied by Fou-rier velocity distribution, line scan, and echo-planar imaging.Magn Reson Med1990;16:280 –93
20. Reese TG, Heid O, Weisskoff RM, et al.Reduction of eddy-current-induced distortion in diffusion MRI using a twice-refocused spin echo.Magn Reson Med2003;49:177– 82
21. Beauchamp NJ Jr, Bryan RN.Acute cerebral ischemic infarction: a pathophysiologic review and radiologic perspective. AJR Am J Roentgenol1978;171:73– 84
22. Andersson JL, Skare S, Ashburner J, et al.How to correct susceptibil-ity distortions in spin-echo echo-planar images: application to dif-fusion tensor imaging.Neuroimage2003;20:870 – 88
23. Zeineh MM, Holdsworth S, Skare S, et al.Ultra-high resolution dif-fusion tensor imaging of the microscopic pathways of the medial temporal lobe.Neuroimage2012;62:2065– 82