REVIEW ARTICLE
METABOLIC BRAIN MAPPING
Molecular Imaging for Depressive Disorders
T.-S. Lee, S.Y. Quek, and K.R.R. Krishnan
ABSTRACT
SUMMARY: Molecular imaging is the visualization, characterization, and measurement of biologic processes at the molecular and cellular levels in humans and other living systems. Molecular imaging techniques such as MR spectroscopy and PET have been used to explore the molecular pathophysiology of depression and assess treatment responses. MR spectroscopy is a noninvasive technique that assesses the levels of biochemical metabolites in the brain, while PET uses radioligands injected in the bloodstream that have high binding affinity for target molecules. MR spectroscopy findings suggest a role for glutamate/glutamine and gamma-aminobutyric acid in depression. PET has generally failed to find a correlation between radioligand binding potential and depression severity or treatment response, though it may offer promise in distinguishing responders and nonresponders to treatment. A major challenge for both modalities is that depression is a heterogeneous, multifactorial disorder, while MR spectroscopy and PET are limited to examining a few metabolites or a single radioligand at a time. This difference makes a comprehensive evaluation of neurochemical changes in the brain difficult.
ABBREVIATIONS:GABA⫽gamma-aminobutyric acid; Gln⫽glutamine; Glu⫽glutamate; 5-HT⫽serotonin; MDD⫽major depressive disorder; PCr⫽
phosphocreatinine
T
he standard definition of molecular imaging, as provided by the Molecular Imaging Center for Excellence Standard Defi-nitions Task Force, is the visualization, characterization, and measurement of biologic processes at the molecular and cellular levels in humans and other living systems.1In this way, molecular imaging may offer further insights into the molecular pathology of various diseases in animal models and human subjects, aid in the development of molecular-targeted drugs, and potentially in-dividualize established therapy regimens in clinical practice.Molecular imaging requires probes that can bind to the target molecule with high affinity. Such probes may be radiopharma-ceuticals or paramagnetic or fluorescent materials; small mole-cules such as receptor ligands or enzyme substrates; or higher molecular-weight-affinity ligands such as recombinant proteins.2 Another emerging application in molecular imaging is in the use of reporter genes. These genes can be used to visualize the levels of expression of specific endogenous and exogenous genes, as well as
other intracellular biologic phenomena such as signal transduc-tion pathways and protein-protein interactransduc-tions.3
Molecular imaging is performed with tools that enable signals from probes to be visualized and quantified in space and with time and includes techniques such as optical imaging, radiotracer im-aging, sonography, MR spectroscopy, and PET. In the present article, we will focus on the use of MR spectroscopy and PET in the examination of depression.
Major Depressive Disorder
Major depressive disorder (MDD) is a great source of morbidity and suffering worldwide. In the United States, the 12-month prevalence is 6.6% and the lifetime prevalence is 16.2%.4 Accord-ing to theDiagnostic and Statistical Manual of Mental Disorders (DSM-5),5the diagnosis of MDD is made when 5 of 9 core symp-toms are present for⬎2 weeks and indicate a change from a pre-vious level of functioning. These core symptoms in MDD are the following: depressed mood; diminished interests; appetite changes leading to weight gain or loss; sleep dysregulation; psy-chomotor changes; loss of energy; feelings of worthlessness and excessive guilt; diminished concentration; and recurrent thoughts of death. These symptoms should not be attributable to the phys-iologic effects of a medical condition or substance misuse. The diagnostic criteria for MDD are largely unchanged from the DSM-IV Text Revision,6and this similarity allows comparisons of current and future research studies with those that were
previ-Received October 2, 2013; accepted after revision February 26, 2014. From the Duke-National University of Singapore Graduate Medical School, Singapore.
Please address correspondence to Tih-Shih Lee, MD, Duke-National University of Singapore Graduate Medical School Singapore, 8 College Rd, Singapore 169857; e-mail: [email protected]
Indicates open access to non-subscribers at www.ajnr.org
ously conducted. Now, a diagnosis of depression is made on the basis of clinical judgment. As of yet, there are no definitive blood/ CSF biomarkers or neuroimaging findings that can aid the clini-cian in making the diagnosis. However, blood, CSF, and urine analyses and brain scans may be ordered by the clinician to ex-clude a medical condition or substance misuse that may have led to the depressive symptoms.
Molecular Neurobiology of Depression
The neurobiologic basis for depression has not yet been defini-tively characterized. Existing theories involve alterations of neu-rotransmitter systems and networks in limbic and cortical brain regions. Early hypotheses involve the monoamines serotonin (5-HT), norepinephrine, and dopamine; more recently, the involve-ment of glutamate (Glu) and gamma-aminobutyric acid (GABA) has also been proposed. Other neuropeptides involved in the pathophysiology of depression and that may have a role in treat-ment include corticotrophin-releasing factor, neuropeptide Y, neurokinin/substance P, and galanin.7
The accepted early dogma in the pathophysiology of depres-sion involved a reduction in monoamines 5-HT and norepineph-rine and, to a lesser extent, dopamine. Early findings that reser-pine, an antihypertensive that depletes vesicular monoamine stores, led to depressive symptoms suggested a role of mono-amines, especially catecholamines. Drugs that selectively inhib-ited the reuptake of 5-HT and norepinephrine and hence in-creased the intrasynaptic levels of these neurotransmitters were shown to be effective antidepressants.8However, direct analysis of monoamine levels has been mixed, with some reports of reduced levels of 5-HT and norepinephrine in blood, CSF, and postmor-tem brain tissue.9,10Currently, why, while the reuptake inhibitory effects of antidepressants occur within hours and days, the symp-tomatic improvement takes weeks remains an unresolved and vexing issue. Hence, other mechanisms are likely in play.11
In recent years, the focus has shifted away from monoamines to the amino acid neurotransmitters Glu and GABA.12GABA is the major inhibitory neurotransmitter in the brain and counter-balances Glu, the major excitatory neurotransmitter. The balance of Glu and GABA is essential for normal brain function. GABA deficiency has been proposed as a model for anxiety and depres-sion. In a series of studies, plasma GABA levels were lower in subjects with depression.13Patients show a cortical GABA deficit, which is reversed by chronic selective serotonin reuptake inhibi-tor treatment.14Moreover a partial GABA(A) receptor deficit is causal for depression-like behavior in animals and is reversed by chronic antidepressant treatment.15Other evidence comes from postmortem studies that show a loss of GABAergic interneurons in the dorsal lateral prefrontal cortex of subjects with depression16 and a decrease in the glutamic acid decarboxylase.17 As with GABA, there is some evidence that the glutaminergic system, es-pecially abnormalities of Glu andN-methyl-D-aspartate recep-tors, contributes to the pathophysiology of depression.18-20N -methyl-D-aspartate receptor antagonists have demonstrated antidepressant-like activity in preclinical and clinical studies. It has been postulated that glutamatergic receptor modulation may facilitate neuronal stem cell enhancement (neurogenesis) and re-lease of neurotransmitters associated with treatment response.
From an anatomic point of view, the prefrontal cortex and limbic structures, such as the anterior cingulate cortex, have been implicated in the exaggerated response of a sense of guilt and despair to negative emotions. On the other hand, alterations in the hypothalamus and parts of the brain stem have been proposed as responsible for neurovegetative symptoms (eg, sleep and appe-tite dysfunction and fatigue).21This may constitute the interface with the hypothalamus-pituitary axis. Hypothalamus-pituitary axis hyperactivity is also associated with depression, and this is manifested by increased plasma concentrations of cortisol and nonsuppression of adrenocorticotropic hormone and cortisol in the classic dexamethasone suppression test.
Impact of Oxidative Stress in Depression
Oxidative stress occurs when redox homeostasis is tipped toward an excess of free radicals, either due to their overproduction or deficiencies in antioxidant defenses.22While oxygen is essential for aerobic functioning, excessive amounts of its free radical met-abolic by-products are toxic. In high concentrations, free radicals can lead to the damage of cellular proteins, lipids, carbohydrates, and nucleic acids, which consequently may result in apoptosis and cell death.23
A growing body of research supports the involvement of oxi-dative stress in the pathophysiology of depression. A recent meta-analysis observed a significant association between depression and oxidative stress across studies.24Markers of oxidative stress have been found to be higher in patients with major depression relative to controls,25,26including in a postmortem study.27 Evi-dence for the impact of antidepressant treatment on oxidative stress, however, has been mixed, with some studies finding a de-crease in oxidative stress after antidepressant treatment28 and others finding no such change.26,29
Neuroimaging Application for Depression Research
Neuroimaging is not routinely used for clinical diagnosis of de-pressive disorders. However, it may be used for excluding a neurologic lesion (eg, stroke, tumor, or atrophy that may physi-ologically contribute to mood dysregulation). Nevertheless, neu-roimaging tools have been used to study the underlying biology and brain circuits that are relevant to the onset of depression, course of disease, and response to treatment. Volumetric studies have shown gray matter loss and volumetric reductions in subre-gions of the prefrontal cortex, medial temporal lobe, amygdala, and hippocampus across all age ranges.30,31Hippocampal volume loss may be due to hyperactivity of the hypothalamus-pituitary axis, which leads to increased circulating glucocorticoids.32 Func-tional imaging, which is not covered in this review, has been used to show the activation in the corticolimbic mood-regulating circuit.33
Role of Molecular Imaging for Depression
meth-ods were initially used to test the hypothesis of decreasing mono-aminergic function, in particular serotonin, in depression. Given the rapid advances in imaging technologies and radiotracer chem-istry, any review will likely be supplanted shortly after publication. Hence, we will simply summarize the findings to date.
MR Spectroscopy
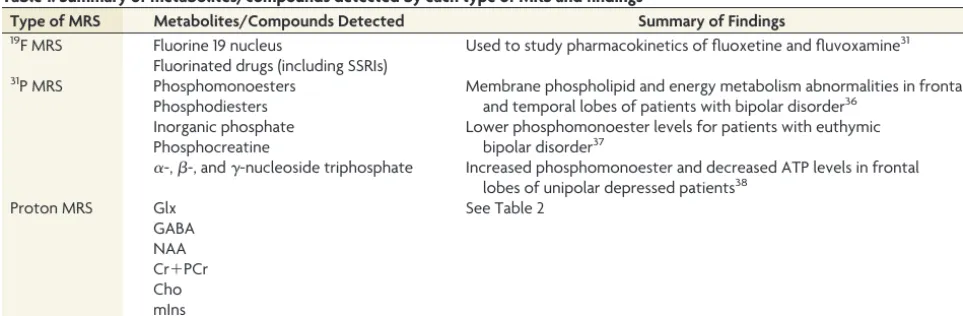
MR spectroscopy is a noninvasive technique that can provide a quantitative measure of biochemical concentration in the living brain. It has high spatial resolution and requires neither radioac-tive tracers nor ionizing radiation. Different molecules have unique MR spectra, which can be quantified by taking the area under the signal curve and measuring it against the curve of a standard metabolite. Unlike MR imaging, which measures the signal from protons in water molecules (typically at concentra-tions of approximately 35 mol/L34) to produce images, MR spec-troscopy detects the signals from compounds in lower concentra-tions (typically at concentraconcentra-tions of 0.5–10 mmol/L).35 These include1H (proton), phosphorus 31 (31P), sodium 23, lithium 7,36and fluorine 19 (19F).37MR spectroscopy has been used to understand the neurobiology of depression and to study its use in predicting treatment response. Table 1 offers a summary of me-tabolites and compounds detected by each type of MR spectros-copy and their key findings.
Fluorine MR Spectroscopy
19F MR spectroscopy has been of interest to researchers since the
early days of MR spectroscopy because a large number of psychi-atric medications contain the fluorine-19 nucleus, which is natu-rally abundant and has an MR spectroscopy sensitivity of 83% relative to protons.38Fluorinated drugs include selective sero-tonin reuptake inhibitors such as fluoxetine and fluvoxamine, which are the most commonly prescribed antidepressants in the world today.19F MR spectroscopy has been used in understand-ing the pharmacokinetics in target organs and in correlatunderstand-ing brain concentrations of the selective serotonin reuptake inhibitors fluo-xetine and fluvoxamine with clinical responses in patients with MDD,39as well as in social phobia40and in a pediatric population treated for pervasive developmental disorders.41Fluorine levels in the brain are very high and are sustained for a long time, reflecting the accumulation of the drug in the brain, which explains the potential long duration of action of the drug. Recently, Wolters et
al42explored the possibility of using dual-targeted molecular im-aging in the form of hybrid1H/19F imaging and spectroscopy for various clinical applications. Nevertheless, despite the potential utility of19F MR spectroscopy for examining the mechanisms of antidepressants, the extant literature is scarce, and this remains an area worth exploring in future research.
Phosphorus MR Spectroscopy
Phosphorus MR spectroscopy can measure phosphate metabo-lism, providing important information about cellular energetics, membrane metabolism, and pH. The common brain metabolites and molecules measured by 31P MR spectroscopy include phosphomonoesters; phosphodiesters; inorganic phosphate; phosphocreatine; and␣-,-, and␥-nucleoside triphosphate.43
31P MR spectroscopy has more often been used to examine
bipolar disorders, though findings of some studies have been ex-tended to MDD.31P MR spectroscopy studies have suggested membrane phospholipid and energy metabolism abnormalities in the frontal and temporal lobes of patients with bipolar disor-ders,44with a meta-analysis finding significantly lower phospho-monoester levels in patients with euthymic bipolar disorders than in healthy controls and patients with depression having signifi-cantly higher phosphomonoester levels than those with euthymic bipolar disorders.45This may suggest trait- and possible state-dependent abnormalities of membrane phospholipid metabo-lism, which may indicate dysfunction in brain-signal transduc-tion systems in bipolar and depressive disorders.
When one focuses on MDD alone, significantly increased phosphomonoester and decreased adenosine triphosphate levels have also been found in the frontal lobes of patients with unipolar depression compared with healthy controls.46In a recent study on late-life depression, glycerophosphoethanolamine was found to be elevated in the white matter of subjects with depression, sug-gesting an enhanced degeneration of cell membranes in these subjects relative to healthy elderly.47An important limitation of31P MR spectroscopy, however, is the relatively low sensitiv-ity of the method—approximately 5% of that of proton MR spectroscopy.48
Proton MR Spectroscopy
The proton is one of the most commonly studied nuclei in MR spec-troscopy due to its high sensitivity and abundance in most metabo-Table 1: Summary of metabolites/compounds detected by each type of MRS and findings
Type of MRS Metabolites/Compounds Detected Summary of Findings
19F MRS Fluorine 19 nucleus
Fluorinated drugs (including SSRIs)
Used to study pharmacokinetics of fluoxetine and fluvoxamine31
31P MRS Phosphomonoesters
Phosphodiesters Inorganic phosphate Phosphocreatine
␣-,-, and␥-nucleoside triphosphate
Membrane phospholipid and energy metabolism abnormalities in frontal and temporal lobes of patients with bipolar disorder36
Lower phosphomonoester levels for patients with euthymic bipolar disorder37
Increased phosphomonoester and decreased ATP levels in frontal lobes of unipolar depressed patients38
Proton MRS Glx
GABA NAA Cr⫹PCr Cho mIns
See Table 2
[image:3.594.53.535.53.211.2]lites. In addition, proton spectroscopy is easier to perform and pro-vides much higher signal-to-noise ratios than either sodium or phosphorus. Proton MR spectroscopy can be performed within 10 –15 minutes by using clinical MR imaging systems with standard radiofrequency coils developed for the acquisition of diagnostic MR images; in contrast, the standard MR imaging coils cannot be used when nuclei other than1H are studied, and special coils tuned to the desired nucleus have to be bought or built instead.35
Proton MR spectroscopy can reliably detect NAA, Cr⫹ phosphocreatine (PCr), Cho-containing compounds including phosphocholine and glycerophosphocholine, and myo-inositol in the brain. These brain metabolites measured by1H-MR spectros-copy are involved in cellular metabolism, neurotransmission, and cell membrane synthesis, or they serve as a specific marker for neu-rons and glia. The Cr⫹PCr level is relatively stable across the brain and is used as an internal concentration reference, with some cave-ats—for example, Cr⫹PCr ratios may be distorted in cases of tumor and stroke. At higher field strengths, Glu and glutamine (Gln) and others can be resolved. Gln is the precursor and a product of Glu and then is metabolized to GABA. Glu in synapses is also rapidly removed and converted back to Gln. Glutamine is synthesized in astrocytes from Glu and then in neurons is converted back to Glu. Hence Glu and Gln are closely linked molecules.
NAA functions as an acetyl donor for acetyl coenzyme A and takes part in lipid synthesis, including myelin. Because it is local-ized only in neurons, it is a putative neuronal marker. Hence a reduction in NAA levels is indicative of neuronal loss and dys-function. In the case of chronic depression, it may suggest a neu-rodegenerative process. Figure 1 shows an example of chemical shift imaging output of NAA for MR spectroscopy.
Cho is the precursor of neurotransmitter acetylcholine and membrane lipids, phosphatidylcholine and sphingomyelin,49and is a marker for the state of membrane phospholipid metabolism. An elevated Cho signal, therefore, most likely reflects higher membrane turnover and damage to myelin or neurons. The Cho signal measures not just Cho but also the underlying phospho-choline and glycerophosphophospho-choline.
Myo-inositol is traditionally considered a glial marker50 be-cause it is actively transported into astrocytes51,52and functions in osmoregulation in brain glial cells.53Higher levels probably re-flect gliosis.
Table 2 lists some important properties of and findings for the metabolites of interest described above, while Fig 2 shows proton MR spectroscopy identification for assignments of these compounds.
Comprehensive reviews and a major meta-analysis on MR spectroscopy for MDD and a review of MR spectroscopy for eval-uation of treatment efficacy have been conducted by Yildiz-Yesiloglu and Ankerst,50Rao et al,54and Caverzasi et al,55 respec-tively, and interested readers can refer to these articles for more information on the extant literature. In this article, we present key findings and attempt to draw conclusions from the data available. Despite the wide diversity of proton MR spectroscopy methods applied, brain regions studied, and molecules, there appears to be some evidence of a correlation between certain metabolite concen-trations, in particular Glu, GABA and Cho, and a good treatment response to pharmacotherapy or stimulation techniques.
Metabolites of Interest
Glx. Studies have shown decreased Glx in the anterior cingulate cortex19,56,57in patients with depression, and these levels im-proved with electroconvulsive therapy.19Decreased levels of Glx have also been found in the amygdala-hippocampus of patients with depression.58In contrast, Sanacora et al59found elevated Glu in the occipital cortex. There is evidence, however, that Glu may be differentially involved in depression and bipolar disorder. In a review, Yu¨ksel and O¨ ngu¨r60found an overall reduction of Glx in depressive disorders in contrast to elevation in bipolar disorders. This finding may suggest that depressive and manic episodes are characterized by modulation of the Glx ratio in opposite directions.
GABA. Using MR spectroscopy, Sanacora et al61found that pa-tients with depression have significantly lower GABA concentra-tions in the occipital cortex relative to healthy controls. These findings were replicated in a subsequent study by the same au-thors59by using a larger sample size. Patients who were most severely depressed and who had the lowest GABA concentrations showed the largest increase after selective serotonin-reuptake-inhibitor treatment. In contrast to findings of reduced GABA concentrations only in the occipital cortex, Hasler et al62reported that GABA, Glu, and Gln were all reduced in the prefrontal cortex of subjects with depression. Bhagwagar et al63also reported low GABA in the occipital and anterior cingulate cortices.
NAA or NAA/Cr. A meta-analysis showed no significant differ-ences in NAA values between patients with depression and healthy subjects in both the basal ganglia and frontal lobe struc-tures,50though a few studies have found a decreased NAA/Cr ratio in the thalamus64and decreased NAA in the caudate65in patients with depression. The general lack of significant findings for NAA or NAA/Cr may suggest an increased membrane turn-over in MDD without a neurodegenerative outcome.
Cho. Results were mixed, but in the meta-analysis of proton MR spectroscopy, Yildiz-Yesiloglu and Ankerst50found that adult pa-tients with MDD had higher Cho/Cr values in the basal ganglia compared with controls. Moreover, the Cho elevation reversed with antidepressant treatment.
Myo-inositol. Most studies reported negative findings in the an-terior cingulate cortex and basal ganglia and mixed results for the prefrontal cortex.54
a significant increase in GABA levels in the anterior cingulate of stressed rats, with the administration of ketamine blunting de-pression-like behavior and increasing GABA levels in the anterior cingulate. However, the results of these studies are not directly
comparable because the GABA levels were measured in different areas of the brain. Other findings that require further support include decreased in vivo concentrations of Cr, pCr, and Cho in tree shrew models69and elevated levels of mIns andin rats with
chronic mild stress.67
Hence, we can summarize that from proton MR spectroscopy, several mole-cules are likely to play a role in MDD. These include Glu, GABA, NAA, and Cho. Specifically looking for treatment response, Caverzasi et al55found a corre-lation between changes in Glu, NAA, and Cho with good treatment response to ei-ther pharmacoei-therapy or stimulation techniques. A study by Renshaw et al71 also found lower brain purine levels in fe-male patients with depression who re-sponded to treatment with fluoxetine, suggesting that treatment response might be predicted by using proton MR spectroscopy.
PET
PET uses molecules that are radio-labeled with a relatively short-lived positron-emitting nuclide, which is injected into the bloodstream so that the PET scanner can provide a digital record of the time FIG 1. 2D chemical shift imaging of N-acetylaspartate. Courtesy of Cecil Charles, Duke
[image:5.594.53.375.109.349.2]University.
Table 2: Summary of metabolites detected by proton MRS and findings
Metabolite of
Interest Key Properties
Findings for Patients with Depression Relative to Controls Glu/Glutamine Complex signal
Requires difference technique at intermediate field strengths
Decreased Glu/Gln in anterior cingulate19,56,57 Decreased Glu/Gln in amygdala-hippocampus58 Decreased Glu/Gln in prefrontal cortex62 Elevated Glu in occipital cortex59
Reduction of Glx (mainly Glu and Gln) in depressive disorder but elevation in bipolar disorder60 Response to treatment: increased levels with ECT19
GABA Complex signal
Requires different technique at intermediate field strengths
Decreased in occipital cortex59,61
Decreased in occipital and anterior cingulate cortex63 Decreased in prefrontal cortex62
Response to treatment: patients who were most severely depressed and who had lowest GABA concentrations showed largest increase after SSRI treatment59 NAA or NAA/Cr Only present in neurons
Change reflects loss or decreased function of neurons
Decreased NAA/Cr in thalamus64 Decreased NAA in caudate65
Meta-analysis: no significant differences in NAA between depressed and healthy subjects in basal ganglia and frontal lobe structures50
Cr⫹PCr Reflects tissue energetics
⬃7.8mol/g117
No significant differences in Cr levels in frontal lobe structures between depressed and healthy subjects50
Cho Concentration of pool:⬃2mol/g117 Reflects mobile Cho (TMA) moieties Cho concentration rate limiting step in
acetylcholine synthesis
Dynamic equilibrium with acetylcholine and phospholipid pathways
Mixed findings
Meta-analysis: elevated in basal ganglia50
Response to treatment: choline elevation reverses with antidepressant treatment50
mIns Diverse role in central nervous system (gliosis, cytoskeleton, cellular signaling)
Generally negative findings in anterior cingulate cortex, basal ganglia
[image:5.594.56.531.395.723.2]and place of radio-labeled molecules in the brain. The basic mo-lecular tools for PET studies are typically synthetic compounds radio-labeled with positron-emitting nuclides, which enter the brain and bind to target macromolecules. The status of neurore-ceptors is typically described in terms of the magnitude with which they bind the PET radioligand, expressed as binding poten-tial or distribution volume. Hence PET estimates of receptor
binding depend on a combination of 3 factors: 1) the number of neuroreceptors in a molecular conformation, 2) the affin-ity of neuroreceptors for the radioisotope, and 3) concentration of endogenous neu-rotransmitters near the neuroreceptors.
In seminal articles, Smith and Jakob-sen72,73and Savitz and Drevets74offered comprehensive reviews of the research findings in the field to date for various radioligands, categorized by their target neurotransmitter systems, with serotonin type 1A receptors being the most exten-sively studied. Table 3 provides an over-view of the most common neurotrans-mitter systems studied with PET imaging and the radioligands that have been used to target each component or pathway. We hereby present a few key findings of these reviews and examine their implications.
In general, PET studies have produced differences between patients with depres-sion and healthy controls across various radioligands and neurotransmitter sys-tems, though contrary evidence has also been found. In serotonin transport, bind-ing potentials are found to be lower in various brain regions of depressed pa-tients with both unipolar or bipolar disor-der for both radioligands [11C]McNeil 565275-77 and [11C]DASB,78-81 though some studies were unable to find a reliable difference between depressed and healthy subjects82,83for [11C]DASB. For the sero-tonin type 1A receptor, for which most research has been done by using [11C]WAY-100635, most studies have found that the binding potential is re-duced for patients with depression com-pared with healthy subjects,84-88though some studies have found results in the converse direction,89,90and a few others have found no difference between de-pressed and healthy subjects.91,92 How-ever, none of the results were robust enough to be used for diagnostic purposes.
While other neurotransmitter systems have not been as extensively researched, the literature available also suggested a re-duction in binding potentials for patients with depression compared with healthy subjects for the serotonin type 2 receptor by using [18F]altanserin,93,94dopamine synthesis by using[18F]fluoro-L-DOPA,95dopamine D1 receptor by using [11C]SCH 23,39096and [11C]NNC 112,97histamine H1 receptor by using [11C]doxepin,98and phosphodiesterase type 4 by by us-ing [11C](R)-rolipram.99Conflicting findings have emerged for dopamine D2/3 receptors by using [11C]raclopride, with Meyer et
[image:6.594.53.372.50.289.2]FIG 2. Proton MR spectroscopy identification of assignments of compounds. Courtesy of Cecil Charles, Duke University.
Table 3: Common neurotransmitter systems studied in PET imaging and radioligands used for each component or pathway involved
Neurotransmitter System
Component/ Pathway Involved
Radioligands Used
Serotonin Synthesis ␣-关11C兴MTrp
Transport 关11C兴McNeil 5652
关11C兴DASB Type 1A receptor 关11C兴WAY-100635
关18F兴FCWAY
关18F兴MPPF Type 1B receptor 关11C兴P943 Type 2 receptor 关18F兴setoperone
关18F兴altanserin
关11C兴MDL 100907
关18F兴FESP
Dopamine Synthesis 关18F兴fluoro-L-DOPA
D1 receptor 关11C兴SCH 23,390
关11C兴NNC 112 D2/3 receptor 关11C兴raclopride
关11C兴FLB 457
Transporter 关11C兴RTI-32
[image:6.594.54.374.343.630.2]al100finding elevated binding potentials for patients with depres-sion compared with healthy controls and Montgomery et al101 find-ing the converse. For monoamine oxidase type A, elevated levels of binding potential have been found for patients with depression com-pared with healthy subjects by using [11C]harmine.102,103
Despite detecting group differences between depressed and healthy subjects, most studies have unfortunately failed to find any correlation between binding potentials and depression sever-ity or clinical conditions across various radioligands and neu-rotransmitter systems. This failure to find a correlation surfaced for serotonin synthesis by using ␣-[11C]MTrp104; serotonin transport by using [11C]McNeil 565275,76; serotonin type 1A re-ceptor by using [11C]WAY-10063587,88,90,91,105; serotonin type 2 receptor by using [18F]setoperone,106 [18F]altanserin,93,94and [11C]MDL 100 907107; D1 receptor by using [11C]NNC 11297; and D2/3 receptor by using [11C]raclopride.100,101
Similarly, studies that have examined the effects of antidepres-sant or electroconvulsive treatment have likewise failed to find a correlation between binding potentials and depression scores when comparing pre- and posttreatment outcomes. For example, in investigating monoamine oxidase type A, Meyer et al103found that the beneficial clinical effects of antidepressant treatment failed to reliably affect regional binding of [11C]harmine in the brain. In in-vestigating the effects of electroconvulsive therapy, no correlation was found between binding potentials and treatment effects for sero-tonin type 1A receptor by using [11C]WAY-100635,85,107for sero-tonin type 2 receptor by using [18F]setoperone,108and for D2/3 re-ceptor by using [11C]FLB 457,109despite clinical improvement in most or all patients. This may limit the utility of PET imaging for assessing the clinical efficacy of medications.
Nevertheless, PET imaging may offer some promise in distin-guishing responders and nonresponders to treatment. For example, Moses-Kolko et al110found that binding of [11C]WAY-100635 for serotonin type 1A receptors in the orbital cortex was higher before treatment in nonresponders compared with responders. Miller et al111also found that accumulation of [11C]McNeil 5652 for sero-tonin transporters was reduced in patients who failed to show remis-sion after 1 year of treatment compared with healthy subjects, in contrast to those who remitted. Again, the findings are not robust enough for clinical use. More research, however, is needed in this area before more definitive conclusions can be drawn.
Another promising area in which PET imaging may be used is in examining the effects of psychotherapeutic treatment ap-proaches as opposed to medication. In a seminal study by Karlsson et al,112the pre- and posttreatment binding potentials of [11C]WAY-100635 for serotonin type 1A receptor were compared for patients who underwent psychodynamic therapy and those who received antidepressants. Surprisingly, it was found that only the former group had increased binding potential post-treatment, despite similar improvement in clinical outcomes in both groups. These findings may suggest that changes in binding potential could be related to changes in depressive cognition, as opposed to the cur-rent depressive affect as reflected by depression scores. In potential support of this finding, Meyer et al113found correlations between the binding potential of [18F]setoperone for serotonin type 2 receptor and the level of dysfunctional attitudes, as well as between the binding potential of [11C]DASB and the magnitude of negative thinking82in separate studies, even though binding potentials were not correlated with depression scores in the former and were related to current depressive episodes in the latter.
Some researchers have also explored the use of PET imaging in looking for potential differences between patients with depression who have recovered and healthy subjects, with the aim of exam-ining whether depression involves persistent underlying molecu-lar abnormalities and whether recurrence of illness may be pre-dicted by PET. Findings, however, have been limited and mixed. For example, Bhagwagar et al114found no difference in binding potential between recovered patients and healthy subjects for se-rotonin transporter by using [11C]DASB. In addition, while Bhagwa-gar et al105found that recovered patients had lower binding poten-tials of [11C]WAY-100635 for serotonin type 1A receptor compared with healthy subjects, Miller et al89found that binding potentials were increased for the same radioligand for both remitted and cur-rently subjects with depression compared with healthy subjects. Es-timates of binding potential for the latter study, however, depended heavily on the region used as reference tissue, with cerebellar white matter giving higher values for binding potentials in remitted pa-tients compared with healthy subjects and cerebellar gray matter pro-ducing results in the converse direction. In investigating serotonin type 2 receptor, Bhagwagar et al107found that recovered depressed patients had higher binding potentials of [11C]MDL 100907 in vari-ous brain regions compared with healthy subjects; for monoamine oxidase type A, binding potentials were similarly elevated for [11C]harmine in brain regions of both currently depressed and re-covered depressed subjects compared with never-depressed subjects, with recurrence of depression associated with elevated binding.103 To our knowledge, no longitudinal studies have yet been conducted to explore the utility of PET imaging for predicting the recurrence of depression in recovered patients; this may be a promising area for future research.
Given the growing interest in GABA, Klumpers et al115showed that bilateral reduction in limbic parahippocampal and right tempo-ral [11C]flumazenil binding found in MDD indicates decreased GABA(A)-benzodiazepine receptor complex affinity and/or num-ber. The inverse relationship between GABA(A) binding in the tem-poral lobe and hypothalamus-pituitary axis activity suggests that hypothalamus-pituitary axis hyperactivity is partly due to reduced GABAergic inhibition. However, this study was based only on 11 subjects with depression and 9 controls and awaits further replication.
DISCUSSION
Molecular imaging was envisaged to explain and explore the neu-romolecular basis of depressive disorders, to study pharmacologic agents, and assess treatment outcomes. In general, the mono-amines are studied by using PET, and small molecules are studied by using MR spectroscopy. Despite rapid advances in imaging technology and new radio-labeled compounds and a series of published studies, molecular imaging for MDD is still very much a work in progress.
conflict-ing findconflict-ings exist, and evidence is mixed for Cho. Despite the limitations in MR spectroscopy studies, Caverzasi et al55opined that MR spectroscopy has good potential for enhancing the un-derstanding of the mechanisms underlying MDD treatments and for helping in evaluating treatment efficacy.
For PET, comparison studies between subjects with depres-sion and healthy controls have been shown for several radio-labeled compounds. A few studies have found differences in bind-ing potentials for medication-naïve patients relative to healthy subjects or remitted, depressive patients treated with medication. These results provide some reassurance of the validity of the monoamine hypothesis in depression. However, several studies have failed to find a correlation between binding potential and depression severity or other clinical variables. Moreover, there is no correlation between the beneficial effects of potent antidepres-sant treatment and PET binding. This severely limits the utility of PET to study pharmacologic effects and treatment outcomes. If this means that the molecular systems probed by current PET ligands are stable, then the discovery of new radioactive ligands along with new scanning protocols will be needed.
The clinical utility of PET is also currently limited. While PET imaging may show differences in depressed-versus-healthy sub-jects, it is unlikely to be used for diagnostic purposes for the fol-lowing reasons: First, as mentioned above, the preponderance of evidence has shown that PET imaging is not correlated with de-pression severity and other clinical variables. Second, although the bulk of studies have found differences between depressed and healthy subjects, all of these differences have been found post hoc and there is, to our knowledge, no study that has examined the specificity and sensitivity of using PET as a potential diagnostic tool. Moreover, the ethical issues involved in injecting a potentially hazardous radio-active substance into patients may preclude its widespread use in clinical diagnosis. There is, nevertheless, some promise in using PET imaging to distinguish between responders and nonresponders to treatment, which may give us more insight into why a certain popu-lation responds to certain medications and thus whether certain medications are more suitable for certain populations. In addition, most studies in PET imaging in depression have been performed on serotonergic neurotransmissions, and more research may be needed for dopaminergic, monoamine oxidase, and catecholaminergic transmissions.
Few comparisons can be drawn between the findings of MR spectroscopy and PET because MR spectroscopy and PET have generally been used to examine different compounds. A common compound studied by both, however, is GABA, in which a puta-tive role in the pathophysiology of depression has recently been postulated. Preliminary evidence from both modalities has sug-gested decreased levels of GABA in subjects with MDD compared with controls, albeit in different brain regions. Decreases in GABA have mainly been reported in the occipital cortex by using MR spectroscopy, while PET found a reduction mainly in the limbic parahippocampal and temporal areas. However, to our knowl-edge, only a single study has been conducted on GABA with PET on a small sample. Although more studies have been performed using MR spectroscopy on GABA, definitive conclusions about the role of GABA in depression await further research and replication.
If one compared the 2 modalities, a distinct advantage of MR spectroscopy over PET is that MR spectroscopy is noninvasive and requires neither radioactive ligands nor ionizing radiation. On the other hand, MR spectroscopy is, by its very nature, re-stricted to the study of small metabolites and cannot be used to examine larger compounds that are of most interest in depres-sion, such as serotonin and dopamine.
Limitations and Future Directions
The current state of research in MR spectroscopy and PET imag-ing shares similar limitations. First, studies for both modalities are generally small, and few are replicated. Second, methodologies of implementation and analysis vary widely across different studies for both modalities, and this variation may contribute to the pro-duction of confusing and conflicting results. Uniform or stan-dardized protocols should be established to allow better compar-ison of studies
Last, one of the major challenges for both modalities is that depression is a clinical diagnosis that has no definitive neurobio-logic correlates. It is inherently heterogeneous and multifactorial, involving an array of genetic factors, environmental input, and possible epigenetic interactions, and it involves multiple regions and domains in the brain. Because MR spectroscopy and PET are limited to only examining a single metabolite or radioligand at any single time, respectively, they may be capable only of offering microwindows into the workings of the disorder and may be un-able to provide insight into the multitude of interactions that surely underlie the complex nature of the disorder.
In the future, studies involving other technologies (eg, fMRI and tractography) can complement these molecular imaging studies to perhaps provide a more nuanced and comprehensive characterization of the disorder. In addition, while numerous studies have provided evidence for the role of oxidative stress in depression, no researchers have yet used molecular imaging to examine metabolite levels in patients with depression. To our knowledge, only a single study116has used proton MR spectros-copy to examine, in vivo, glutathione levels in young people with bipolar disorder, and it found no significant correlations between glutathione (an antioxidant) and clinical scores of depression or mania. The use of molecular imaging for exploring the role of oxidative stress in depression is worth further research.
Disclosures: K. Ranga R. Krishnan—UNRELATED:Patents (planned, pending or is-sued): brain-computer interface,*Comments: not related to imaging or depression, licensed to Atentiv,Stock/Stock Options: Orexigen,Comments: not in this area or in imaging but in obesity.*Money paid to the institution.
REFERENCES
1. Mankoff DA.A definition of molecular imaging.J Nucl Med2007; 48:18N, 21N
2. Weissleder R, Mahmood U.Molecular imaging.Radiology2001; 219:316 –33
3. Kang JH, Chung JK.Molecular-genetic imaging based on reporter gene expression.J Nucl Med2008;49:164S–179S
4. Kessler RC, Berglund P, Demler O, et al.The epidemiology of major depressive disorder: results from the National Comorbidity Sur-vey Replication (NCS-R).JAMA2003;289:3095–105
6. American Psychiatric Association.Diagnostic and Statistical Manual of Mental Disorders.4th ed. Arlington, Virginia: American Psychiat-ric Association; 2000
7. Duman RS.Molecular and cellular pathogenesis of depression and mechanisms for treatment response.In: Charney DS, Sklar P, Bux-baum JD, et al, eds.Neurobiology of Mental Illness.4th ed. New York: Oxford University Press; 2013:425–37
8. Charney DS.Monoamine dysfunction and the pathophysiology and treatment of depression. J Clin Psychiatry 1998;59(suppl 14):11–14
9. Heninger GR, Delgado PL, Charney DS.The revised monoamine theory of depression: a modulatory role for monoamines, based on new findings from monoamines, based on new findings from monoamine depletion experiments in humans. Pharmacopsychia-try1996;29:2–11
10. Jacobsen JP, Medvedev IO, Caron MG.The 5-HT deficiency theory of depression: perspectives from a naturalistic 5-HT deficiency model, the tryptophan hydroxylase 2Arg439His knockin mouse.
Philos Trans R Soc Lond B Biol Sci2012;367:2444 –59
11. Pariante CM, Nemeroff CB.Unipolar depression.In: Schlaepfer TE, Nemeroff CB, eds.Handbook of Clinical Neurology: Neurobiology of Psychiatric Disorders. Amsterdam, the Netherlands: Elsevier; 2012:239 – 49
12. Brambilla P, Perez J, Barale F, et al.GABAergic dysfunction in mood disorders.Mol Psychiatry2003;8:721–37, 715
13. Petty F. Plasma concentrations of gamma-aminobutyric acid (GABA) and mood disorders: a blood test for manic depressive disease.Clin Chem1994;40:296 –302
14. Sanacora G, Mason GF, Rothman DL, et al.Increased occipital cor-tex GABA concentrations in depressed patients after therapy with selective serotonin reuptake inhibitors. Am J Psychiatry
2002;159:663– 65
15. Mo¨hler H.The GABA system in anxiety and depression and its therapeutic potential.Neuropharmacology2012;62:42–53 16. Maciag D, Hughes J, O’Dwyer G, et al.Reduced density of calbindin
immuno-reactive GABAergic neurons in the occipital cortex in major depression: relevance to neuroimaging studies.Biol Psychi-atry2010;67:465–70
17. Karolewicz B, Maciag D, O’Dwyer G, et al.Reduced level of glu-tamic acid decarboxylase-67 kDa in the prefrontal cortex in major depression.Int J Neuropsychopharmacol2010;13:411–20
18. Serafini G, Pompili M, Innamorati M, et al.Pharmacological prop-erties of glutamatergic drugs targeting NMDA receptors and their application in major depression. Curr Pharm Des
2013;19:1898 –922
19. Pfleiderer B, Michael N, Erfurth A, et al.Effective electroconvulsive therapy reverses glutamate/glutamine deficit in the left anterior cingulum of unipolar depressed patients. Psychiatry Res
2003;122:185–92
20. Petrie RXA, Reid IC, Stewart CA.The N-methyl-D-aspartate recep-tor, synaptic plasticity, and depressive disorder: a critical review.
Pharmacol Ther2000;87:11–25
21. Agarwal N, Port JD, Bazzocchi M, et al.Update on the use of MR for assessment and diagnosis of psychiatric diseases. Radiology
2010;255:23– 41
22. Ng F, Berk M, Dean O, et al. Oxidative stress in psychiatric disorders: evidence base and therapeutic implications.Int J Neu-ropsychopharmacol2008;11:851–76
23. Siwek M, Sowa-Kucma M, Dudek D, et al.Oxidative stress markers in affective disorders.Pharmacol Rep2013;65:1558 –71
24. Palta P, Samuel LJ, Miller ER, et al.Depression and oxidative stress: results from a meta-analysis of observational studies.Psychosom Med2014;76:12–19
25. Yanik M, Erel O, Kati M.The relationship between potency of ox-idative stress and severity of depression. Acta Neuropsychiatr
2004;16:200 – 03
26. Chung CP, Schmidt D, Stein CM, et al.Increased oxidative stress in
patients with depression and its relationship to treatment. Psychi-atry Res2013;206:213–16
27. Michel TM, Frangou S, Thiemeyer D, et al.Evidence for oxidative stress in the frontal cortex in patients with recurrent depressive disorder: a postmortem study.Psychiatry Res2007;151:145–50 28. Kotan VO, Sarandol E, Kirhan E, et al.Effects of long-term
antide-pressant treatment on oxidative status in major depressive disorder: a 24-week follow-up study.Prog Neuropsychopharmacol Biol Psychiatry2011;35:1284 –90
29. Sarandol A, Sarandol E, Eker SS, et al.Major depressive disorder is accompanied with oxidative stress: short-term antidepressant treatment does not alter oxidative-antioxidative systems.Hum Psychopharmacol2007;22:67–73
30. Drevets WC, Price JL, Simpson JR Jr, et al.Subgenual prefrontal cortex abnormalities in mood disorders.Nature1997;386:824 –27 31. Beyer JL, Krishnan KR. Volumetric brain imaging findings in
mood disorders.Bipolar Disord2002;4:89 –104
32. Lee AL, Olge WO, Robert M.Stress and depression: possible links to neuron death in the hippocampus.Bipolar Disord2002;4:117–28 33. Wang L, Hermens DF, Hickie IB, et al.A systematic review of rest-ing-state functional-MRI studies in major depression.J Affect Dis-orders2012;142:6 –12
34. Payne GS, Leach MO.Applications of magnetic resonance spec-troscopy in radiotherapy treatment planning.Br J Radiol2006;(79 spec no 1):S16 –26
35. van der Graaf M.In vivo magnetic resonance spectroscopy: basic methodology and clinical applications. Eur Biophys J
2010;39:527– 40
36. Lu H, Yang Y, Liu P.Brain imaging methodologies.In: Charney DS, Sklar P, Buxbaum JD, Nestler EJ, eds.Neurobiology of Mental Illness.
4th ed. New York: Oxford University Press; 2013:199 –211 37. Lyoo IK, Renshaw PF.Magnetic resonance spectroscopy: current
and future applications in psychiatric research. Biol Psychiatry
2002;51:195–207
38. Moore CM, Renshaw PF.Magnetic resonance spectroscopy studies of affective disorders.In: Krishna KR, Doraiswamy PM, eds.Brain Im-aging in Clinical Psychiatry. New York: Marcel Decker; 1997:185–214
39. Bolo NR, Hode´ Y, Ne´de´lec JF, et al.Brain pharmacokinetics and tissue distribution in vivo of fluvoxamine and fluoxetine by fluo-rine magnetic resonance spectroscopy.Neuropsychopharmacology
2000;23:428 –38
40. Miner CM, Davidson JRT, Potts NLS, et al.Brain fluoxetine mea-surements using fluorine magnetic resonance spectroscopy in pa-tients with social phobia.Biol Psychiatry1995;38:696 –98 41. Strauss WL, Unis AS, Cowan C, et al.Fluorine magnetic resonance
spectroscopy measurement of brain fluvoxamine and fluoxetine in pediatric patients treated for pervasive developmental disor-ders.Am J Psychiatry2002;159:755– 60
42. Wolters M, Mohades SG, Hackeng TM, et al.Clinical perspectives of hybrid proton-fluorine magnetic resonance imaging and spec-troscopy.Invest Radiol2013;48:341–50
43. Iosifescu DV, Renshaw PF.31P-Magnetic resonance spectroscopy and thyroid hormones in major depressive disorder: toward a bioenergic mechanism in depression. Harv Rev Psychiatry
2003;11:51– 63
44. Soares JC, Krishnan KR, Keshavan MS.Nuclear magnetic reso-nance spectroscopy: new insights into the pathophysiology of mood disorders.Depression1996;4:14 –30
45. Yildiz A, Sachs GS, Dorer DJ, et al.31P nuclear magnetic resonance spectroscopy findings in bipolar illness: a meta-analysis. Psychia-try Res2001;106:181–91
46. Volz HP, Rzanny R, Riehemann S, et al.31P magnetic resonance spectroscopy in the frontal lobe of major depressed patients.Eur Arch Psychiatry Clin Neurosci1998;248:289 –95
48. Rauch SL, Renshaw PF.Clinical neuroimaging in psychiatry.Harv Rev Psychiatry1995;2:297–312
49. Kusumakar V, MacMaster FP, Gates L, et al.Left medial temporal cytosolic choline in early onset depression. Can J Psychiatry
2001;46:959 – 64
50. Yildiz-Yesiloglu A, Ankerst DP.Review of1H magnetic resonance
spectroscopy findings in major depressive disorder: a meta-anal-ysis.Psychiatry Res2006;147:1–25
51. Griffin JL, Bollard M, Nicholson JK, et al.Spectral profiles of cul-tured neuronal and glial cells derived from HRMAS (1) HNMR spectroscopy.NMR Biomed2002;15:375– 84
52. Wolfson M, Bersudsky Y, Hertz E, et al.A model of inositol com-partmentation in astrocytes based upon efflux kinetics and slow inositol depletion after uptake inhibition. Neurochem Res
2000;25:977– 82
53. Frey R, Metzler D, Fischer P, et al.Myo-inositol in depressive and healthy subjects determined by frontal1H-magnetic resonance
spectroscopy at 1.5 Tesla.J Psychiatr Res1998;32:411–20 54. Rao NP, Venkatasubramanian G, Gangadhar BN.Proton magnetic
resonance spectroscopy in depression. Indian J Psychiatry
2011;53:307–11
55. Caverzasi E, Pichiecchio A, Poloni GU, et al.Magnetic resonance spectroscopy in the evaluation of treatment efficacy in unipolar major depressive disorder: a review of the literature.Funct Neurol
2012;27:13–22
56. Auer DP, Putz B, Kraft E, et al.Reduced glutamate in the anterior cingulate cortex in depression: an in vivo proton magnetic reso-nance spectroscopy study.Biol Psychiatry2000;47:305–13 57. Mirza Y, Tang J, Russell A, et al.Reduced anterior cingulate cortex
glutamatergic concentrations in childhood major depression.
J Am Acad Child Adolesc Psychiatry2004;43:341– 48
58. Michael N, Erfurth A, Ohrmann P, et al.Metabolic changes within the left dorsolateral prefrontal cortex occurring with electrocon-vulsive therapy in patients with treatment resistant unipolar de-pression.Psychol Med2003;33:1277– 84
59. Sanacora G, Gueorguieva R, Epperson CN, et al.Subtype-specific alterations of gamma-aminobutyric acid and glutamate in pa-tients with major depression.Arch Gen Psychiatry2004;61:705–13 60. Yu¨ksel C, O¨ ngu¨r D.Magnetic resonance spectroscopy studies of glutamate-related abnormalities in mood disorders.Biol Psychia-try2010;68:785–94
61. Sanacora G, Mason GF, Rothman DL, et al.Reduced cortical gam-ma-aminobutyric acid levels in depressed patients determined by proton magnetic resonance spectroscopy. Arch Gen Psychiatry
1999;56:1043– 47
62. Hasler G, van der Veen JW, Tumonis T, et al.Reduced prefrontal glutamate/glutamine and gamaminobutyric acid levels in ma-jor depression determined using proton magnetic resonance spec-troscopy.Arch Gen Psychiatry2007;64:193–200
63. Bhagwagar Z, Wylezinska M, Jezzard P, et al.Low GABA concentra-tions in occipital cortex and anterior cingulate cortex in medica-tion-free, recovered depressed patients.Int J Neuropsychopharma-col2008;11:255– 60
64. Mu J, Xie P, Yang ZS, et al.1H magnetic resonance spectroscopy
study of thalamus in treatment resistant depressive patients. Neu-rosci Lett2007;425:49 –52
65. Vythilingam M, Charles HC, Tupler LA, et al.Focal and lateralized subcortical abnormalities in unipolar major depressive disorder: an automated multivoxel proton magnetic resonance spectros-copy study.Biol Psychiatry2003;54:744 –50
66. Delgado y Palacios RD, Campo A, Henningsen K, et al.Magnetic resonance imaging and spectroscopy reveal differential hip-pocampal changes in anhedonic and resilient subtypes of the chronic mild stress rat model.Biol Psychiatry2011;70:449 –57 67. Hemanth Kumar BS, Mishra SK, Rana P, et al.Neurodegenerative
evidences during early onset of depression in CMS rats as detected by proton magnetic resonance spectroscopy at 7T.Behav Brain Res
2012;232:53–59
68. Xi G, Hui J, Zhang Z, et al.Learning and memory alterations are associated with hippocampal N-acetylaspartate in a rat model of depression as measured by1H-MRS.PLoS One2011;6:e28686
69. Cze´h B, Michaelis T, Watanabe T, et al.Stress-induced changes in cerebral metabolites, hippocampal volume, and cell proliferation are prevented by antidepressant treatment with tianeptine.Proc Natl Acad Sci U S A2001;98:12796 – 801
70. Perrine SA, Ghoddoussi F, Michaels MS, et al.Ketamine reverses stress-induced depression-like behavior and increased GABA lev-els in the anterior cingulate: an 11.7 T1H-MRS study in rats.Prog
Neuropsychopharmacol Biol Psychiatry2013 Nov 15. [Epub ahead of print]
71. Renshaw PF, Parow AM, Hirashima F, et al.Multinuclear magnetic resonance spectroscopy studies of brain purines in major depres-sion.Am J Psychiatry2001;158:2048 –55
72. Smith DF, Jakobsen S.Molecular tools for assessing human de-pression by positron emission tomography.Eur Neuropsychophar-macol2009;19:611–28
73. Smith DF, Jakobsen S.Molecular neurobiology of depression: PET findings on the elusive correlation with symptom severity.Front Psychiatry2013;4:8
74. Savitz JB, Drevets WC.Neuroreceptor imaging in depression. Neu-robiol Dis2013;52:49 – 65
75. Oquendo MA, Hastings RS, Huang YY, et al.Brain serotonin trans-porter binding in depressed patients with bipolar disorder using positron emission tomography. Arch Gen Psychiatry
2007;64:201– 08
76. Parsey RV, Hastings RS, Oquendo MA, et al.Lower serotonin trans-porter binding potential in the human brain during major depres-sive episodes.Am J Psychiatry2006;163:52–58
77. Reivich M, Amsterdam JD, Brunswick DJ, et al.PET brain imaging with [11C](ⴙ)McN5652 shows increased serotonin transporter
availability in major depression.J Affect Disord2004;82:321–27 78. Reimold M, Knobel A, Rapp MA, et al.Central serotonin
trans-porter levels are associated with stress hormone response and anx-iety.Psychopharmacology (Berl) 2011;213:563–72
79. Reimold M, Batra A, Knobel A, et al.Anxiety is associated with reduced central serotonin transporter availability in unmedicated patients with unipolar major depression: a [11C]DASB PET study.
Mol Psychiatry2008;13:606 –13, 55
80. Cannon DM, Ichise M, Rollis D, et al.Elevated serotonin trans-porter binding in major depressive disorder assessed using posi-tron emission tomography and [11C]DASB; comparison with bi-polar disorder.Biol Psychiatry2007;62:870 –77
81. Cannon DM, Carson RE, Nugent AC, et al.Reduced muscarinic type 2 receptor binding in subjects with bipolar disorder.Arch Gen Psychiatry2006;63:741– 47
82. Meyer JH, Houle S, Sagrati S, et al.Brain serotonin transporter binding potential measured with carbon 11-labeled DASB posi-tron emission tomography: effects of major depressive episodes and severity of dysfunctional attitudes.Arch Gen Psychiatry2004; 61:1271–79
83. Meyer JH, Wilson AA, Sagrati S, et al.Serotonin transporter occu-pancy of five selective serotonin reuptake inhibitors at different doses: an [11C]DASB positron emission tomography study.Am J Psychiatry2004;161:826 –35
84. Parsey RV, Ogden RT, Miller JM, et al.Higher serotonin 1A binding in a second major depression cohort: modeling and reference re-gion considerations.Biol Psychiatry2010;68:170 –78
85. Saijo T, Takano A, Suhara T, et al.Effect of electroconvulsive ther-apy on 5-HT1A receptor binding in patients with depression: a PET study with [11C]WAY 100635.Int J Neuropsychopharmacol
2010;13:785–91
86. Meltzer CC, Price JC, Mathis CA, et al.Serotonin 1A receptor bind-ing and treatment response in late-life depression. Neuropsychop-harmacology2004;29:2258 – 65
with major depressive disorder: an in-vivo imaging study using PET and [carbonyl-11C]WAY-100635.Int J Neuropsychopharmacol
2008;11:465–76
88. Drevets WC, Thase ME, Moses-Kolko EL, et al.Serotonin-1A recep-tor imaging in recurrent depression: replication and literature re-view.Nucl Med Biol2007;34:865–77
89. Miller JM, Brennan KG, Ogden TR, et al.Elevated serotonin 1A bind-ing in remitted major depressive disorder: evidence for a trait biolog-ical abnormality.Neuropsychopharmacology2009;34:2275– 84 90. Sullivan GM, Ogden RT, Oquendo MA, et al.Positron emission
tomography quantification of serotonin-1A receptor binding in medication-free bipolar depression. Biol Psychiatry 2009;66: 223–30
91. Parsey RV, Oquendo MA, Ogden RT, et al.Altered serotonin 1A binding in major depression: a [carbonyl-C-11]WAY100635 pos-itron emission tomography study.Biol Psychiatry2006;59:106 –13 92. Mickey BJ, Ducci F, Hodgkinson CA, et al.Monoamine oxidase A genotype predicts human serotonin 1A receptor availability in vivo.J Neurosci2008;28:11354 –59
93. Mintun MA, Sheline YI, Moerlein SM, et al.Decreased hippocam-pal 5-HT2A receptor binding in major depressive disorder: in vivo measurement with [18F]altanserin positron emission tomogra-phy.Biol Psychiatry2004;55:217–24
94. Sheline YI, Mintun MA, Moerlein SM, et al. Greater loss of 5-HT(2A) receptors in midlife than in late life.Am J Psychiatry
2002;159:430 –35
95. Bragulat V, Paillere-Martinot ML, Artiges E, et al.Dopaminergic function in depressed patients with affective flattening or with impulsivity: [18F] fluoro-L-dopa positron emission tomography study with voxel-based analysis.Psychiatry Res2007;154:115–24 96. Dougherty DD, Bonab AA, Ottowitz WE, et al.Decreased striatal
D1 binding as measured using PET and [11C]SCH 23,390 in pa-tients with major depression with anger attacks.Depress Anxiety
2006;23:175–77
97. Cannon DM, Klaver JM, Peck SA, et al.Dopamine type-1 receptor binding in major depressive disorder assessed using positron emission tomography and [(11)C]NNC-112. Neuropsychopharma-cology2009;34:1277– 87
98. Kano M, Fukudo S, Tashiro A, et al.Decreased histamine H1 recep-tor binding in the brain of depressed patients.Eur J Neurosci
2004;20:803–10
99. Fujita M, Hines CS, Zoghbi SS, et al.Downregulation of brain phosphodiesterase type IV measured with (11)C-(R)-rolipram positron emission tomography in major depressive disorder.Biol Psychiatry2012;72:548 –54
100. Meyer JH, Ginovart N, Boovariwala A, et al.Elevated putamen D(2) receptor binding potential in major depression with motor retardation: an [11C]raclopride positron emission tomography study.Am J Psychiatry2006;163:1594 – 602
101. Montgomery AJ, Stokes P, Kitamura Y, et al.Extrastriatal D2 and striatal D2 receptors in depressive illness: pilot PET studies using [11C]FLB 457 and [11C]raclopride. J Affect Disord 2007;101: 113–22
102. Meyer JH, Ginovart N, Boovariwala A, et al.Elevated monoamine oxidase A levels in the brain: an explanation for the monoamine imbalance of major depression. Arch Gen Psychiatry 2006; 63:1209 –16
103. Meyer JH, Wilson AA, Sagrati S, et al.Brain monoamine oxidase A binding in major depressive disorder: relationship to selective se-rotonin reuptake inhibitor treatment, recovery, and recurrence.
Arch Gen Psychiatry2009;66:1304 –12
104. Rosa-Neto P, Diksic M, Okazawa H, et al.Measurement of brain regional alpha-[11C]methyl-L-tryptophan trapping as a measure of serotonin synthesis in medication-free patients with major de-pression.Arch Gen Psychiatry2004;61:556 – 63
105. Bhagwagar Z, Rabiner EA, Sargent PA, et al.Persistent reduction in brain serotonin 1A receptor binding in recovered depressed men measured by positron emission tomography with [11C]WAY-100635.Biol Psychiatry2004;9:386 –92
106. Yatham LN, Liddle PF, Lam RW, et al.Effect of electroconvulsive therapy on brain 5-HT(2) receptors in major depression.Br J Psy-chiatry2010;196:474 –79
107. Bhagwagar Z, Hinz R, Taylor M, et al.Increased 5-HT(2A) receptor binding in euthymic, medication-free patients recovered from depression: a positron emission study with [11C]MDL 100,907.
Am J Psychiatry2006;163:1580 – 87
108. Lanzenberger R, Baldinger P, Hahn A, et al.Global decrease of se-rotonin-1A receptor binding after electroconvulsive therapy in major depression measured by PET. Mol Psychiatry 2013; 18:93–100
109. Saijo T, Takano A, Suhara T, et al.Electroconvulsive therapy de-creases dopamine D(2) receptor binding in the anterior cingulate in patients with depression: a controlled study using positron emission tomography with radioligand [11C]FLB 457.J Clin Psy-chiatry2010;71:793–99
110. Moses-Kolko EL, Price JC, Thase ME, et al. Measurement of 5-HT1A receptor binding in depressed adults before and after anti-depressant drug treatment using positron emission tomogra-phy and [11C]WAY-100635.Synapse2007;61:523–30
111. Miller JM, Oquendo MA, Ogden RT, et al.Serotonin transporter binding as a possible predictor of one-year remission in major depressive disorder.J Psychiatr Res2008;42:1137– 44
112. Karlsson H, Hirvonen J, Kajander J, et al.Research letter: psycho-therapy increases brain serotonin 5-HT1A receptors in patients with major depressive disorder.Psychol Med2010;40:523–28 113. Meyer JH, McMain S, Kennedy SH, et al.Dysfunctional attitudes
and 5-HT2 receptors during depression and self-harm.Am J Psy-chiatry2003;160:90 –99
114. Bhagwagar Z, Murthy N, Selvaraj S, et al.5-HTT binding in recov-ered depressed patients and healthy volunteers: a positron emission tomography study with [11C]DASB.Am J Psychiatry
2007;164:1858 – 65
115. Klumpers UM, Veltman DJ, Drent ML, et al.Reduced parahip-pocampal and lateral temporal GABAA-[11C]flumazenil binding in major depression: preliminary results.Eur J Nucl Med Mol Im-aging2010;37:565–74
116. Lagopoulos J, Hermens DF, Tobias-Webb J, et al.In vivo glutathi-one levels in young persons with bipolar disorder: a magnetic res-onance spectroscopy study.J Psychiatr Res2013;47:412–17 117. Narayana PA, Johnston D, Flamig DP.In vivo proton magnetic