ISSN Online: 2327-5227 ISSN Print: 2327-5219
DOI: 10.4236/jcc.2017.514002 Dec. 12, 2017 14 Journal of Computer and Communications
Early Detection of QoE Deterioration in HTTP
Adaptive Streaming
Phan Xuan-Tan, Eiji Kamioka
Graduate School of Engineering and Science, Shibaura Institute of Technology, Tokyo, Japan
Abstract
Apart from video rate (or requested bitrate), Mean Opinion Score (MOS) has increasingly become a primary term representing Quality of Experience (QoE) in HTTP adaptive streaming (HAS). By monitoring this metric, QoE man-agement can effectively maximize QoE for the users. However, due to various behaviors of particular commercial HAS players, deciding an appropriate monitoring interval has not been fully investigated yet. In this paper, an op-timal interval is proposed to be equal to duration of a video chunk in order to aid service managers in early detecting QoE deterioration and limiting the probability of video rate deterioration. The optimal monitoring interval is evaluated by comparing with other values of interval in terms of ratio of video rate deterioration. Furthermore, MOS-based QoE monitoring method which takes into account the proposed interval is thus compared with video rate based monitoring method. The results show that with optimal interval, MOS monitoring guarantees a low ratio of video rate deterioration (around 10% for buffering state and 40% for steady state) and small average CPU Load (about 11.45%).
Keywords
QoE, MOS, QoS, Video Rate, Detection Time, Optimal Monitoring Interval
1. Introduction
Video has become the most dominant application on the Internet. According to [1], video traffic is predicted to account for about 90 percent of global IP traffic by 2019. Recently, HTTP adaptive streaming is introduced as a promising deli-very technique for Over-The-Top (OTT) service providers such as Youtube, Netflix, etc. The market of OTT service has been rapidly expanded than ever, thus, it is necessary to maintain particular video quality level for the users. In
How to cite this paper: Xuan-Tan, P. and Kamioka, E. (2017) Early Detection of QoE Deterioration in HTTP Adaptive Stream-ing. Journal of Computer and Communica-tions, 5, 14-27.
https://doi.org/10.4236/jcc.2017.514002 Received: November 8, 2017
Accepted: December 9, 2017 Published: December 12, 2017 Copyright © 2017 by authors and Scientific Research Publishing Inc. This work is licensed under the Creative Commons Attribution International License (CC BY 4.0).
DOI: 10.4236/jcc.2017.514002 15 Journal of Computer and Communications fact, the perceived video quality is represented by QoE as the most important performance metric when video service providers are expecting to maximize the satisfaction of their users. In the last few years, contemporary researchers have proposed various QoE management models [2] [3] for monitoring and control QoE in HTTP adaptive streaming. In QoE monitoring, perceived quality is mo-nitored based on indicators’ observation. The indicators could be video rate or playback buffer or MOS. In HTTP adaptive streaming, video rate and playback buffer are typically obtained on a chunk-by-chunk basic. As such, they are al-ways observed with long unfixed interval. In other words, observation interval depends on the time points when HAS player starts and finishes download chunks. As a result, once network condition becomes worse, control action is meaningless due to the fact that video rate has already been decreased. Without depending on chunk-by-chunk basic, MOS becomes a promising monitoring indicator. Thereby, the monitoring interval turns out to be large enough to avoid high computing cost and small enough to early detect video rate deterioration. Unfortunately, such monitoring interval has not yet been carefully taken into account. In effort to establish playback buffer as well as maintain it during the streaming session, HAS player always changes its behavior from buffering state to steady state. Thus, it is not easy to determine an appropriate interval for MOS monitoring by which desirable video rate could be maintained. Relying on the behavior of playback buffer, in this paper, an optimal interval is deduced as equal to the size of a video chunk (Each type of commercial HAS player could define different size for video chunk). As a result, the probability of video rate deterioration is equal to the smallest value of 10% within steady state, whereas, the average CPU Load is about 11.45%.
The rest of the paper is organized as follows: Section 2 will provide an over-view of background knowledge; Section 3 will state related works; The proposals will be described in the Section 4; Meanwhile, Section 5 will show the evaluation results on the proposed method; Section 6 will conclude the paper and future work will also be stated.
2. Background Knowledge
2.1. HTTP Adaptive Streaming
HTTP adaptive streaming marked its initial appearance in 2006 by Move Net-works [4]. By using a combination of TCP and HTTP, it becomes a cost-effective technology for delivering video on the Internet. Equally important, it has no dif-ficulties traversing firewalls and NAT devices. Therefore, it is an appropriate choice for Over-The-Top (OTT) video services.
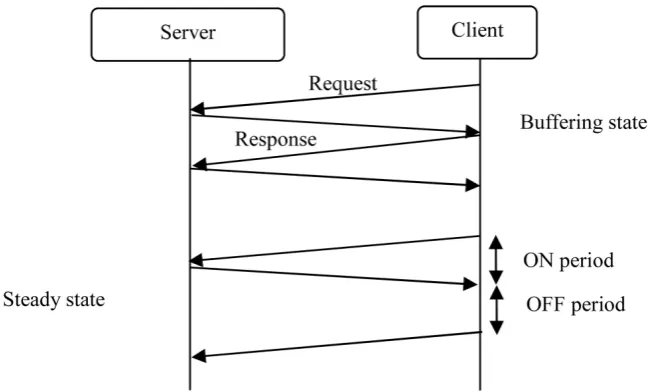
Bi-DOI: 10.4236/jcc.2017.514002 16 Journal of Computer and Communications trate Selection (ABR) [5]. The general framework of ABR composes of three subcomponents: resources estimation, chunk request scheduling and adaption as shown in Figure 1. Meanwhile, Figure 2 shows that there are two main states during HAS session: buffering and steady state. At the buffering state (or con-vergence time), HAS player attempts to establish playback buffer as quickly as possible by continuously requesting video chunks from the lowest video rate. Once a certain amount of content is either downloaded or the playback buffer reaches a predefined target (let say as Bmax), then the steady state (or periodic download) is activated. In this phase, HAS player attempts to maximize video rate by keeping playback buffer stable at Bmax. To do so, the player is required to download a chunk and then pause for a short time before downloading the next chunk. The download period and pause period are called ON and OFF pe-riod, respectively. Note that when stimulus occurs (in this paper, a stimulus is understood as available bandwidth reduction), the buffering state will be
Figure 1. ABR framework comprises of three main components: Resource estimation, request scheduling and adaption module.
[image:3.595.208.533.511.707.2]DOI: 10.4236/jcc.2017.514002 17 Journal of Computer and Communications re-activated.
2.2. Resources Estimation
Resources estimation plays an important role in ABR for selecting an appropri-ate video rappropri-ate. During HAS session, resources estimation could be done based on either available bandwidth or playback buffer or power level estimation. Availa-ble bandwidth-based estimation is often performed throughout a moving aver-age of available bandwidth. In order to maximize video rate, HAS player always attempts to stabilize a gap between available bandwidth and video rate, trans-lated into conservatism margin ratio [6] [7] Cons ratio_ ), defined as:
_ t t
t
C R
Cons ratio C
−
= (1)
where Ct, Rt are available bandwidth and video rate at time point t, respec-tively.
Service providers apply different values of Cons ratio_ (e.g. Microsoft Smooth Streaming and Apple HTTP Live Streaming apply a conservatism value of 20% and 40%, respectively).
Buffer-based estimation is done by capturing the playback buffer size of chunk by chunk. According to [8], given that Btk is playback buffer size at time point
k
t , Btk−1 is playback buffer size at time point tk−1, tk′ and tk′−1 are timestamp of HTTP video request at time point tk and tk−1, respectively, ∆t is the dura-tion time between two successive requests. So that, playback buffer size at tk is calculated as shown in Equation (2):
(
)
1 1 1
k k k
t t t k k t t
B =B − − ∆ + t′−t′− =B − − ∆ +V (2)
where V is equal to video chunk size (in second). The commercial HAS players have different values of V.
3. Related Works
In order to maximize video rate, the perceived video quality defined by QoE has to be frequently monitored. According to [9], there are QoE influence factors ca-tegorized into technical and perceptual groups. In this paper, QoE which is re-ferred to technical category, particularly to adaption logic is considered. There are three parameters possibly considered as QoE monitoring indicator: video rate, playback buffer and QoS (referred by MOS via QoS/QoE model).
DOI: 10.4236/jcc.2017.514002 18 Journal of Computer and Communications monitoring indicator in QoE management model in [2] [14] [15] [16] [17], in-cluding our study [18]. Literatures showed that with MOS, QoE management could be done in automatic and accurate way. Furthermore, if diversity in users’ rating and psychological factors are assumed to be ignored, MOS is well-suited for quickly predicting video rate deterioration [19] [20]. However, when the monitoring interval of estimated MOS is too small, CPU load of Controller (where QoE management is deployed in) becomes higher. Moreover, QoE control in some cases will be triggered in incorrect time due to time varying characteristic of available resource (e.g. available bandwidth). It leads to a demand of MOS op-timal monitoring interval.
In this paper, the optimal monitoring interval is proposed to be equal to the size of video chunk. With the optimal monitoring interval, MOS monitoring me-thod is expected to early detect video rate reduction with low computation cost. As the result, the control action is performed in early fashion. The effectiveness of the optimal interval is evaluated through evaluation criteria: ratio of video rate deterioration, average CPU load, detection time, and recovery time.
4. Methodology
4.1. MOS Estimation Model
Mean Opinion Score (MOS) is defined as the “value on a predefined scale that a subject assign to his opinion of the performance of a system” and it is understood as the average of evaluation scores across subjects [20]. According to [21], MOS could be used with either 9-scale measure or 5-scale measure. There are three methods to assess perceived video quality in HAS video streaming. The first is called as subjective assessment in which subjects are asked to provide their evalu-ations under subjective MOS of the video that they watched. This method accu-rately represents the perceived video quality. However, it is high cost in term of time and human resources method. Furthermore, it cannot be used as a real time QoE assessment method. Objective assessment is considered as the second me-thod in which MOS is calculated throughout related equations. Even though be-ing a low cost method, the accuracy of this method is quite low. Our research performs MOS estimation by applying the third method called hybrid method. It comes up with an idea of Pseudo Subjective Assessment Quality (PSQA) which was proposed by Samir Mohamed and Gerardo Rubino [14]. The purpose is to train a Random Neural Network (RNN) to capture the relationship between QoE influence factors and MOS. As the result, it is capable of evaluating video quality as accurately as human does and then can be applied for real-time QoE estima-tion in accurate and automatic way [2] [16] [17] [22]. In this paper, MOS is esti-mated based on network condition which is defined by QoS parameters (available bandwidth, packet loss, delay and jitter).
4.2. Proposed Optimal Monitoring Interval
DOI: 10.4236/jcc.2017.514002 19 Journal of Computer and Communications rate deterioration when stimulus occurs. According to [5], video rate selection can be represented as a function R(t) according to which the video rate is se-lected. A typical R(t) takes various parameters as input, for example, available bandwidth, playback buffer, power level, etc. In this research, the available bandwidth and playback buffer were investigated in order to determine the op-timal monitoring interval. Other parameters are out of scope. Some commercial HAS players apply available bandwidth-based estimation in their video rate se-lection. Traditionally, the estimation is done by per-chunk mechanism which shows a large variation. To overcome this problem, running average of available bandwidth is taken into account. Let Ct denote the system capacity (available bandwidth) at time t, Rt is video rate at time t. To ensure that video rate will not decrease, the following equation is given out:
0 1
limT TC ttd threshold T
→∞
∫
≥ (3)Moreover, in order to guarantee that an expected encoding rate will be re-quested by HAS player, Ct should meet the condition in Equation (4) (This equation actually is transformed from Equation (1)):
( )
1 _
t
R t C
cons ratio
≥
− (4)
Once those conditions in Equation (3) and Equation (4) are met during a streaming session, video rate will be maximized. However, the threshold has not been clearly identified by various HAS proprieties HAS. Instead of determining that threshold, other condition related to playback buffer is considered. A simple experiment was performed to determine the behavior of playback buffer and video rate when stimulus occurs.
The experiment’s scenario is as follow: a HAS player is playing a movie with high video rate under good network condition in which available bandwidth is high (around 5120 Kbps), packet loss, delay and jitter are negligible. Observing behaviors of both buffer occupancy level and video rate when:
1) The available bandwidth is dramatically decreased to 1024 Kbps at t = 20 s (before playback buffer reaches Bmax).
2) The available bandwidth is dramatically decreased to 1024 Kbps at t = 60 s (after playback buffer reaches Bmax).
There are two metrics wereconsidered in this experiment t_delay_buffer, and
DOI: 10.4236/jcc.2017.514002 20 Journal of Computer and Communications (2). Table 1 shows the sample dataset of experiment with two studied metric
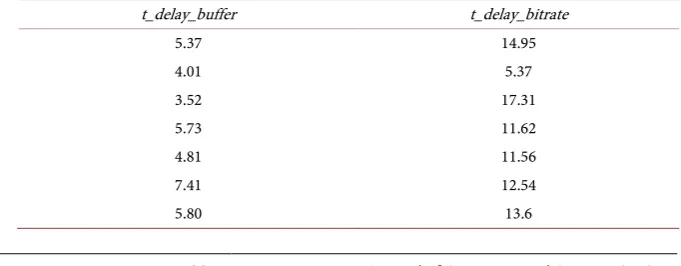
t_delay_buffer, and t_delay_bitrate. The means of the waiting time until the first negative adaptions of both playback buffer size and video rate are respectively 5.76 s and 12.69 s. Moreover, during the experiment, it was interesting to find out that the video rate usually decreases when the playback buffer degrades at least two times. The results show that playback buffer should be considered as a milestone to decide the monitoring interval of estimated MOS.
It is interesting to find that playback buffer always quickly reacts to the change of network condition. Thus, it can be used to predict video rate’s deterioration. The Equation (3) now could be replaced by other playback buffer related equa-tion. Let Btk denote buffer occupancy of HAS player at time tk,whereas, let
1 k
t
B − denote the playback buffer size at time tk−1. Therefore, in order to keep video rate stable at expected level, buffer occupancy should not significantly de-crease. So that:
1 0
k k
t t
B −B − ≥ (5)
Based on the Equation (2) in the background knowledge section, then we have:
t V
∆ ≤ (6)
Thus, (4) and (6) now become the condition to prevent video rate from dete-riorating within streaming session. It means that the stimulus has to be captured within ∆t
( )
s or before HAS player sends the next request. Therefore, the op-timal monitoring interval is proposed to be tmon=V.5. Evaluation
The purpose of this evaluation is to verify how elaborately the proposed interval facilitates maintaining the video rate level when the network condition is getting worse. More concretely, since the optimal interval of MOS monitoring is ap-plied, the following metrics has been evaluated:
• Ratio of video rate deterioration. • Average CPU load.
[image:7.595.198.539.611.744.2]• Detection time td which represents how quickly video rate deterioration can be detected if compared with method which uses video rate as monitor-ing indicator.
Table 1. Sample dataset with two metrics: t_delay_buffer and t_delay_bitrate.
t_delay_buffer t_delay_bitrate 5.37 14.95
4.01 5.37
3.52 17.31 5.73 11.62 4.81 11.56 7.41 12.54
DOI: 10.4236/jcc.2017.514002 21 Journal of Computer and Communications Recovery time tr of video rate which represents the duration time from when control action is generated until video rate is recovered to expected level.
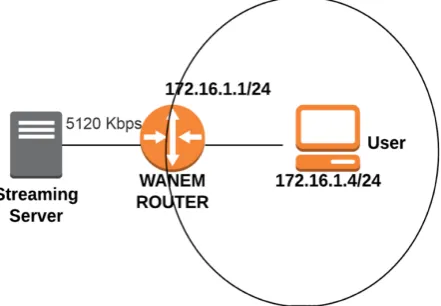
In order to evaluate those criteria, two experiments were performed with en-vironment setup as follow: A TestBed consisted of a router, a streaming server, and a client. Beyond routing and Nat function, the router played a role as a Controller which was installed on a VMware workstation of a desktop computer with Intel Core i5 3.10 GHz processor and 8 GB RAM. The Controller with QoE management algorithm (written in Python) [18] was capable of not only moni-toring and controlling QoS data (available bandwidth, packet loss, delay, and jit-ter), but also calculating MOS based on QoS data. The streaming sever was dep-loyed on a desktop computer with Windows 8.1, Intel Core i5 3.10 GHz proces-sor and 8 GB RAM. The server published a Microsoft smooth streaming (MSS) video content of “Big Buck Bunny” which is known as an open source testing movie. This movie content was encoded with multiple bit rates. Furthermore, a Smooth Streaming-compatible Silverlight player template was installed on the Smooth Streaming enabled streaming server so that Silverlight-based clients can play Smooth Streams. A video client was a laptop computer with MacOS, Core i5 and 8 GB RAM in which the latest version of Microsoft Silverlight add-on was installed. The server and the client were located in different broadcast domains and they were connected via the router. The network topology used for the ex-periments is shown in Figure 3. In addition, Wireshark, which is a network packet analyzer, installed at the router captured the HTTP request from the client. Note that MSS applies the value 2 s of V during streaming session [8], thus, in our experiment, the optimal interval of 2 s was evaluated.
For evaluating two first metrics, the experimental scenario was performed as follow: the estimated MOS was monitored with respect to interval
{
}
mon 1,1.2,1.5,1.8, 2, 2.2, 2.5, 2.8, 3, 3.2, 3.5
t ∈ . Meanwhile, the experimental
pro-cedure was:
1) A client starts watching a streaming video content.
[image:8.595.265.486.539.692.2]2) Stimulus is generated in buffering state and steady state by decreasing
DOI: 10.4236/jcc.2017.514002 22 Journal of Computer and Communications available bandwidth on purpose to make the network quality deteriorated (from 5120 Kbps to 1024 Kbps).
3) The packet loss, delay and jitter in the network and average CPU load in Controller (where QoE monitoring and QoE control are performed) are ob-served.
4) The deterioration is detected by observing the estimated MOS.
5) The available bandwidth to the user is immediately increased to recover the network quality when the deterioration of video rate is detected (from 1024 Kbps to 5120 Kbps).
Ratio of video rate deterioration is determined by ratio of the number of times the video rate decreases to the total number of times the experiment is repeated. Meanwhile, average CPU load stands for means of CPU load of the Controller in each experiment’s iteration. Particularly, with each value of tmon, the above procedure was repeated 10 times in total. Given that within 10 times, there is n
times the video rate decrease (n≤10), even though control action has already been generated. Then, the ratio of video rate deterioration which is the ratio of n
to 10 times of total was calculated for each value of tmon. Alternatively, the av-erage CPU load of the Controller for each interval was also recorded.
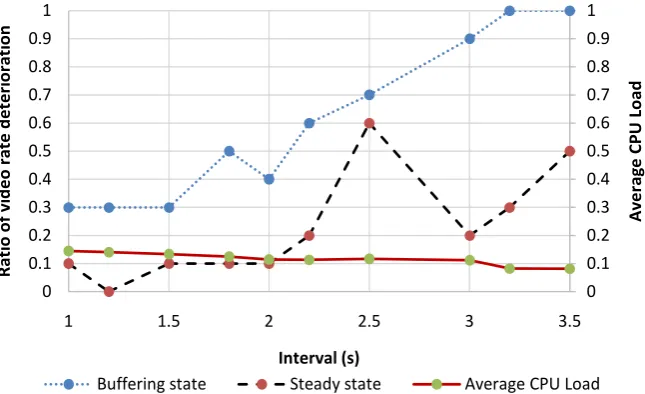
[image:9.595.211.534.497.694.2]The Figure 4 compares the ratio of deterioration of video rate according to the monitoring interval varying from 1 s to 3.5 s with both buffering state and steady state. It is clear that those ratios significantly increased when tmon >2 s. Overall, a much higher percentage of video rate deterioration could be seen in buffering state in comparison with steady state, and buffering state experienced the faster growth of such ratio. As explained in background knowledge section, during the buffering state, HAS player attempts to fill the playback buffer as quickly as possible. Whereas, during the steady state, buffer occupancy is sta-ble at Bmax. Therefore, video rate becomes more sensitive to stimulus within
Figure 4. Ratio of video deterioration within buffering state and steady state. Average CPU Load was calculated across intervals.
0 0.1 0.2 0.3 0.4 0.5 0.6 0.7 0.8 0.9 1 0 0.1 0.2 0.3 0.4 0.5 0.6 0.7 0.8 0.9 1
1 1.5 2 2.5 3 3.5
Ave ra ge C PU L oa d Ra tio o f v id eo ra te d et er io ra tio n Interval (s)
DOI: 10.4236/jcc.2017.514002 23 Journal of Computer and Communications buffering state than in the steady state. In this figure, during the streaming ses-sion, average CPU load showed a clear trend in which it linearly decreased across monitoring interval values from 14.46% to 8.18%.
Particularly, during the buffering state, an increase trend clearly could be seen in ratio of video rate deterioration when the monitoring interval was higher than 2 s. A slight fluctuation was found in range of between 1.5 s and 2 s. However, such fluctuation did not always occur when the whole procedure was repeated several times. Interestingly, the ratio reached to peak of 100% of video rate dete-rioration when monitoring interval larger than 3.2 s.
When monitoring interval was varied from 1 s to 2 s during steady state, the ratio of video rate deterioration was stable at lowest value of 0.1 of accuracy. However, when the monitoring interval was larger than 2 s, the ratio of video rate deterioration quickly rocketed to 0.6 of accuracy before witnessing a large fluctuation in range of between 2.5 s and 3.5 s. This fluctuation was also ex-plained as the result of limitation of our QoE management algorithm perfor-mance. The algorithm frequently called PSQA model (written in MATLAB) by which it could generate some “spike” in Controller’s processing time. Actually, this abnormal fluctuation could not be seen when the experiment procedure was repeated several times.
The reasonable decrease trend of average CPU load was found from the graph. The smaller monitoring interval, the higher average load over time. In this expe-riment, the performance of computer was not too high and the number of users was small, then average CPU load was not a big problem. However, it will be-come more serious when the numbers of the users are extremely large. Interes-tingly, the line of average CPU load crossed by the line of ratio of video rate de-terioration for the steady state at the point of interval of 2 s at which the average CPU load was equal 11.45% and the ratio of video rate deterioration was about 0.1.
For the detection time and recovery time criteria, MOS monitoring with de-fined optimal interval was compared with video rate-based method. The expe-rimental procedure for two scenarios of the evaluation was as follows:
1) A client starts watching a streaming video content.
2) The available bandwidth is reduced on purpose to make the network quali-ty deteriorated.
3) The packet loss, delay and jitter in the network are observed.
4) The deterioration is detected by observing the video rate and the estimated MOS.
5) The available bandwidth to the user is increased to recover the network quality when the deterioration of the video rate (for the first scenario) and esti-mated MOS (for the second scenario) are detected.
DOI: 10.4236/jcc.2017.514002 24 Journal of Computer and Communications seconds for each scenario. At t = 20 s, t = 60 s and t = 90 s, the available band-width of the client was set to low level of 1024 Kbps. During streaming sessions, video rate was continuously captured, whereas, the estimated MOS was moni-tored in every tmon=2 s.
[image:11.595.209.535.487.693.2]Figure 5 and Figure 6 show the results of experiment in both scenarios. As seen from both graphs, the video rate reached its highest value of 2962 Kbps at around t = 10 s. In Figure 5, after the available bandwidth was reduced to 1024 Kbps at t = 20 s, the video rate decreased to 2056 Kbps at t = 32.46 s. Router was immediately controlled to increase the available bandwidth to 5120 Kbps. How-ever, the video rate did not return to 2962 Kbps within several seconds. It stayed at the value of 2056 Kbps for 15 s. When the available bandwidth was decreased
Figure 5. Video rate requested by the user, available bandwidth and estimated MOS in the first scenario.
Figure 6. Video rate requested by the user, available bandwidth and estimated MOS in the second scenario.
1 2 3 4 5
0 1000 2000 3000 4000 5000 6000
0 20 40 60 80 100 120
Es
tim
at
ed
M
O
S
Kb
ps
Time (s)
Video rate Available Bandwidth Estimated MOS
1 2 3 4 5
0 1000 2000 3000 4000 5000 6000
0 20 40 60 80 100 120
Es
tim
at
ed
M
O
S
Kb
ps
Time (s)
DOI: 10.4236/jcc.2017.514002 25 Journal of Computer and Communications at t = 60 s, the video rate also lately reacted to. It decreased to 2056 Kbps at 71.99 s, and even kept staying at that level, although the router had increased the available bandwidth to 5120 Kbps. To make matters worse, when the available bandwidth was reduced to 1024 Kbps t = 90 s, the video rate started decreasing more.
In Figure 6, after the available bandwidth was reduced to 1024 Kbps at t = 20 s, t = 60 s, and t = 90 s, MOS quickly decreased to around 2.75. Those deteriora-tions were respectively detected at t = 23.90 s, t = 62.90 s and t = 92.90 s. The router managed to increase the available bandwidth to 5120 Kbps, and thus the estimated MOS also quickly returned to 5 at t = 26.90 s, t = 65.90 s and t = 95.90 s. Unlike in the Figure 6, any worse deterioration in video rate could not be seen until t = 95.69 s. But the video rate just deteriorated for a short time from t = 95.69 s to t = 98.49 s, then recover to the original highest value. This is because the estimated MOS detects the network quality change quickly, then the availa-ble bandwidth can be adjusted immediately.
It could be seen that that the video rate always takes a large delay to adapt the available bandwidth compared to the estimated MOS. This is because the video rate does not change after detecting the network quality change. In fact, the player reacts, not to the latest fragment download throughput, but to a smoothed estimate of those measurements that can be unrelated to the current available bandwidth conditions. Particularly, in Figure 5, when the available bandwidth was decreased, the video rate deterioration could be detected about 12.46 s after that. Meanwhile, Figure 6 witnessed a short reaction time of estimated MOS. It took only about 3.9 s for capturing the deterioration of estimated MOS. It means that by using optimal monitoring interval, MOS-based method can detect video rate deterioration at least td ≤8 s earlier than video rate based method. After controlling available bandwidth, the second scenario witnessed that the video rate remained unchanged or experienced a short-term reduction (observed around T = 90 s). In contrast, in the first scenario, the video rate did not return to 2962 Kbps within several seconds and it took a large tr (around 15 s) to re-turn or even did not rere-turn. This is because the playback buffer size is large enough to compensate for a negative “spike” in the available bandwidth. A small recovering time tr ≤4 s of video rate which could be seen from the second scenario is meaningful in QoE management. In other words, video rate has been guaranteed to be maximized or to be kept stable at desirable level.
6. Conclusions
DOI: 10.4236/jcc.2017.514002 26 Journal of Computer and Communications rate deterioration, short recovery time, low CPU load and low ratio of video rate deterioration. The unstable performance of control algorithm was our limitation in this work. It will be improved in the next research.
In the future, an accurate QoE control will be considered which plays an im-portant role in establishing an effective joint QoE management system.
References
[1] Cisco (2017) Cisco Visual Networking Index: Forecast and Methodology.
https://www.cisco.com/c/en/us/solutions/collateral/service-provider/visual-network ing-index-vni/complete-white-paper-c11-481360.html
[2] Seppanen, J., Varelaand, M. and Aggeliki, S. (2014) An Autonomous QoE-Driven Network Management. Journal of Visual Communication and Image Representa-tion, 25, 565-577.https://doi.org/10.1016/j.jvcir.2013.11.010
[3] Latre, S., Simoens, P., De Vleeschauwer, B., Van de Meerssche, W., De Turck, F., Dhoedt, B., Demeester, P., Van den Berghe, S. and Lumley, E.G. (2009) An Auto-nomic Architecture for Optimizing QoE in Multimedia Access Networks. Comput-er Networks, 53, 1587-1602. https://doi.org/10.1016/j.comnet.2008.11.004
[4] History of Move Networks. https://goo.gl/jkL4Nv
[5] Sani, Y. and Edwards, C. (2017) Adaptive Bitrate Selection: A Survey. IEEE Com-munication Surveys and Tutorials, 19, 2985-3014.
https://doi.org/10.1109/COMST.2017.2725241
[6] Houdaille, R. and Stephane, G. (2012) Shaping HTTP Adaptive Streams for a Better User Experience. Proceedings of 3rd Conference on Multimedia Systems, ACM, 1-9.
[7] Guguen, C.T., Le Bolzer, F. and Houdaille, R. (2017) Improving User Experience When HTTP Adaptive Streaming Clients Compete for Bandwidth. SMPTE Motion Imaging Journal, 126, 28-34.https://doi.org/10.5594/JMI.2016.2632279
[8] Akhshabi, S., Narayanaswamy, S., Begen, A.C. and Dovrolis, C. (2012) An Experi-mental Evaluation of Rate-Adaptive Video Players over HTTP. Signal Processing: Image Communication, 27, 271-287.https://doi.org/10.1016/j.image.2011.10.003
[9] Seufert, M., Egger, S., Slanina, M., Zinner, T., Hobfeld, T. and Tran-Gia, P. (2015) A Survey on Quality of Experience of HTTP Adaptive Streaming. IEEE Communica-tions Surveys and Tutorials, 17, 469-492.
https://doi.org/10.1109/COMST.2014.2360940
[10] Akhshabi, S., Narayanaswamy, S., Dovrolis, C. and Begen, A.C (2013) Server-Based Traffic Shaping for Stabilizing Oscillating Adaptive Streaming Players. Proceedings of Workshop on Network and Operating System Support for Digital Audio and Video, ACM, February, 19-24.
[11] Kim, S., Yun, D. and Chung, K. (2016) Video Quality Adaption Scheme for Im-proving QoE in HTTP Adaptive Streaming. 2016 International Conference on In-formation Networking (ICOIN), Kota Kinabalu, 13-15 January 2016, 201-205. [12] Huang, T.Y., Johari, R., McKeown, N., Trunnell, M. and Watson, M. (2015) A
Buf-fer-Based Approach to Rate Adaption: Evidence from a Large Video Streaming Ser-vice. ACM SIGCOMM Computer Communication Review, 44, 187-198.
[13] Schatz, R., Hobfeld, T. and Casas, P. (2012) Passive Youtube QoE Monitoring for ISPs. Sixth International conference on Innovative Mobile and Internet Services in Ubiquitous Computing (IMIS), Palermo, 4-6 July 2012, 358-364.
DOI: 10.4236/jcc.2017.514002 27 Journal of Computer and Communications [14] Mohamed, S. and Rubino, G. (2002) A Study of Real-Time Packet Video Quality
Using Random Neural Networks. IEEE Transactions on Circuits and Systems for Video Technology, 12, 1071-1083. https://doi.org/10.1109/TCSVT.2002.806808
[15] Hobfeld, T., Tran-Gia, P. and Fiedler, M (2007) Quantification of Quality of Expe-rience for Edge-Based Applications. 20th International Tele traffic Congress (ITC-20), Springer.
[16] Casas, P., Seufert, M. and Schatz, R. (2013) A System for On-Line Monitoring of YouTube QoE in Operational 3G Networks. ACM Sigmetrics Performance Evalua-tion Review, 41, 44-46. https://doi.org/10.1145/2518025.2518033
[17] Singh, K.D., Hadjadj-Aoul, Y. and Rubino, G. (2012) Quality of Experience Estima-tion for Adaptive HTTP/TCP Video Streaming using H.264/AVC. Conference on Consumer Communication and Networking, 127-131.
https://doi.org/10.1109/CCNC.2012.6181070
[18] Xuan-Tan, P. and Kamioka, E. (2016) Efficiency of QoE-Driven Network Manage-ment in Adaptive Streaming over HTTP. 22nd Asia-Pacific Conference on Com-munication, 517-522.
[19] Hobfeld, T., Schatz, R. and Egger, S. (2011) SOS: The MOS Is Not Enough! 3rd In-ternational Workshop on Quality of Multimedia Experience, 131-136.
https://doi.org/10.1109/QoMEX.2011.6065690
[20] Streijl, R.C., Winkler, S. and Hands, D.S. (2016) Mean Opinion Score (MOS) Revi-sited: Methods and Applications, Limitations and Alternatives. Multimedia Sys-tems, 22, 213-227. https://doi.org/10.1007/s00530-014-0446-1
[21] ITU-T, R.P. 910 (2008) Subjective Video Quality Assessment Methods for Multi-media Applications.