Antarctica in the Year 2105:
What Physical Changes
Might We Expect?
Team Gaia
Stefan Kowalewski
Anna Mason
Table of Contents
Table of Contents ... 2
Abstract ... 3
Introduction ... 4
Climate Change Scenarios ... 8
Scenario 1: Pessimistic Scenario ... 8
Scenario 2: Realistic Scenario ... 8
Scenario 3: Optimistic Scenario ... 8
Predicted Physical Changes in 2105 ... 8
Scenario 1: Pessimistic Scenario ... 8
Scenario 2: Realistic Scenario ... 14
Scenario 3: Optimistic Scenario ... 15
Discussion ... 18
Conclusions ... 20
Abstract
This report investigates possible changes to the Antarctic environment due to climate change over the next one hundred years. Three scenarios have been developed in order to assess the response of the Antarctic to different rates of climate change resulting from anthropogenic influences.
According to the predictions made in this report, there are no significant differences between the pessimistic scenario (which assumes a further increase in greenhouse gas emissions) and the realistic scenario (which assumes no strengthening in greenhouse gas emission rates). The optimistic scenario (which assumes global effort in reducing greenhouse gas emissions) results in slower and more gradual changes to the physical environment. However, due to the slow response of the Earth’s climate system, a significant global warming is still expected by the year 2105.
Introduction
The effect of climate change on Antarctica is a topic of great interest. Antarctica plays a fundamental role in the global climate and could have a profound effect on the extent to which sea level rises in the coming centuries in response to global warming.
Physical changes are already being observed in Antarctica. The important question is whether these changes are the result of natural variability or the result of global warming attributed to human activity. This report aims to investigate current climate trends, and from these, predict the physical changes that might occur in Antarctica in 2105, in relation to three different climate change scenarios.
Before proceeding with the scenario predictions, a description of the physical features of the Antarctic is needed and the issues surrounding climate change must be discussed. The following sections provide a summary on these points.
Physical Features of Antarctica
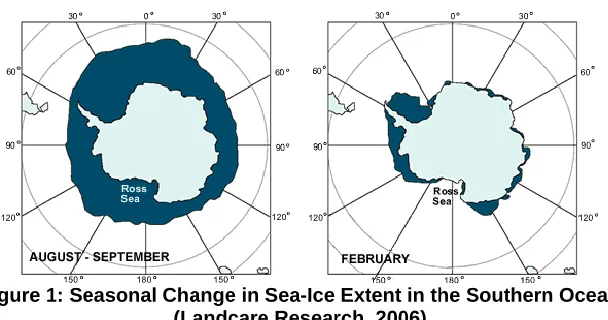
[image:4.612.156.460.340.500.2]Antarctica is the fifth largest continent on Earth, with an area of approximately 14 million km2. The sea ice surrounding the continent varies by season, with approximately 2.6 million km2 in summer and 18.8 million km2 in winter.
Figure 1: Seasonal Change in Sea-Ice Extent in the Southern Ocean (Landcare Research, 2006)
The Antarctic cryosphere (where cryosphere refers to all snow, ice and permafrost on and beneath the surface of the earth and ocean) is one of the most climatically important features of the Southern Hemisphere.
Ice covers more than 99% of Antarctica and this ice surface reflects about 80% of the incoming solar radiation back into space. The remaining 20% is absorbed by the atmosphere or reflected by clouds.
Antarctica has the greatest elevation of any continent due to its ice cap, with an average altitude of 2.3km and a maximum ice sheet thickness of approximately 4.7km. About 70% of the Earth’s freshwater resources are contained in the Antarctic ice sheet, which corresponds to an additional sea level of 70m (Oppenheimer, 2004).
metres per year in the interior regions and increase up to 200m/year towards the margins (Landcare Research, 2006). Antarctica also has a number of glaciers, whose ice flow rates can be up to 2000m/year, and approximately 1500km3 of ice moves off the coastlines as icebergs annually. Therefore, the Antarctic ice sheet mass balance is mainly determined by the rate of ice loss from iceberg calving and the rate of ice gains through refreezing ice and precipitation.
The Antarctic has one of the most extreme climates in the world. Inland temperatures range from -70°C in winter up to -35°C in summer, and coastal temperatures range from -30°C to 0°C in winter and summer respectively. The absolute humidity, on average, is lower than in the Sahara, with annual snowfalls along the polar ice cap of only 2.5-5cm/year and 25-51cm/year along the coastal mountains. Due to the strong latitudinal thermal contrast, intense cyclonic storms travel eastward around the continent while the coastal regions are affected by strong katabatic winds. The Hadley Circulation causes a permanent central high-pressure system at the pole.
The Southern Ocean and its Linkages
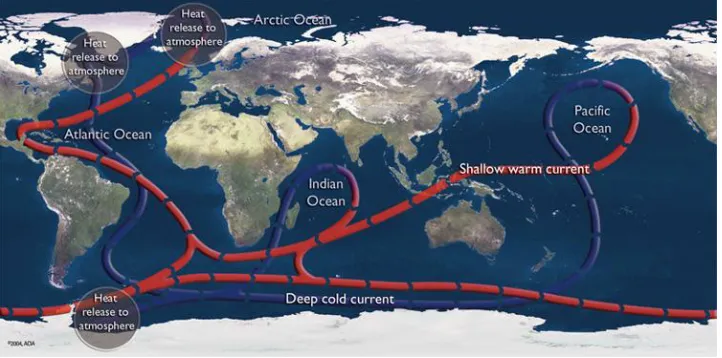
[image:5.612.127.488.351.530.2]The Circumpolar Current flows from west to east around Antarctica, connecting the Pacific, Indian and Atlantic ocean basins and their currents. The resulting global circulation redistributes heat and other properties, influencing patterns of temperature and rainfall (CSIRO Marine Research, 2006).
Figure 2: Circumpolar Current (Physical Geography.net, 2006)
The Southern Ocean is a source of intermediate and deep water that renews the world’s oceans. The cooling of the ocean and the formation of sea-ice during winter increases the density of the water, which sinks from the sea surface into the deep sea. This dense water, produced between 60°S and the Antarctic Shelf, controls the distribution of the physical and chemical properties of the deep water throughout the world’s oceans.
There are approximately 466 known species of birds, arthropods and other invertebrates, plants, lichens, algae and other single-celled organisms within the Southern Ocean biota. Oceanic biota is influenced by ocean circulation and mixing processes which regulate nutrient availability and light for photosynthesis. In turn, ocean biota has an effect on the ocean environment. Phytoplankton modulate the penetration of solar radiation in the upper ocean and biological activity traps carbon in the ocean, away from the atmosphere.
Natural Climate Variations
The Earth’s climate is dynamic and is constantly changing from natural and human-induced causes. Ice covers more than 99% of present-day Antarctica and the mean annual temperature at the coast is approximately -15°C. However, fossils preserved in the strata capping of the TransAntarctic mountains show that 200 million years ago forests and swamps existed on the continent and Antarctic temperatures were at least 15°C warmer (Barrett, 2001). This massive shift in climate is the result of natural climate variations. Natural contributors to climate change include continental drift, volcanoes, ocean currents and meteorites.
A record of the past Antarctic climate lies in the layers of sediment eroded from the continent over millions of years and deposited on the surface and in sedimentary basins around Antarctica’s margins. Ice cores from these sediments show that the climate has always changed. The Vostok ice core in central Antarctica covers the last 400,000 years, and shows that four major climatic cycles existed over this time – four large glaciation periods followed by transitional interglacial (warmer) periods.
During these four cycles, the atmospheric characteristics varied within stable limits, with a temperature amplitude variation in Antarctica of about 12°C at land level and 8°C in the troposphere. Between hot and cold periods, the greenhouse gas concentrations in the global atmosphere varied, with higher levels during the interglacial periods. Greenhouse gas concentrations were measured to be at their highest during the warmest interglacial periods (300ppmv CO2 and 750ppbv1 CH4) but these values are still
well below the present CO2 and CH4 concentrations. The current greenhouse gas levels
have not been encountered during the past 420,000 years.
The Earth’s current warm period, which began 11,000 years ago, appears to be the longest ever in 420,000 years. The Earth should, according to past history, be heading into a colder period, suggesting that human activity is contributing to climate change.
Anthropogenic Climate Change
Although Antarctica has no indigenous people and makes an insignificant contribution to global greenhouse gas emissions, the response of the rest of world to the threat of climate change will determine Antarctica’s fate in the coming century.
Human activity on Earth generates large quantities of greenhouse gases, such as carbon dioxide (CO2), methane (CH4), nitrous oxide (N2O), ozone in the lower
atmosphere and halocarbons. The atmospheric concentration of CO2 is now about 35%
above the pre-industrial level, CH4 has increased by 150% and N2O is up by nearly 20%
(Lowe, 2005). CFCs and other related compounds that did not exist in the pre-industrial era are now also contributing to the greenhouse effect.
CO2 is produced by the burning or decay of any substance containing carbon, but the
majority of anthropogenic CO2 is produced from the burning of fossil fuels such as oil,
coal, oil-based fuels and gas for electricity generation and transport (Flannery, 2005). Currently, 6000 million tonnes of CO2 is added to the atmosphere each year from the
burning of coal, gas, oil and wood-fuel, with another 1000-2000 million tonnes added from the clearing of vegetation for agriculture and human development (Lowe, 2005).
CO2 is very long lived in the atmosphere. Around 56% of all the CO2 emitted from
historical and contemporary burning of fossil fuels is still present in the air, and this is the cause, directly or indirectly, of 80% of all global warming (Kump, 2002). Prior to the Industrial Revolution, there was about 280ppm of CO2 in the atmosphere and that level
has now reached 380ppm. If CO2 emissions were to stabilise to double the level which
existed prior to the Industrial Revolution (considered the threshold of dangerous climate change), all future human emissions would need to be limited to around 290ppm. Just over 50% of this would remain in the atmosphere, raising CO2 levels to around 550ppm
by 2100 (Flannery, 2005).
International Politics and Climate Change
The atmosphere is a global commons, so any approach to climate change must be undertaken at a global level with agreement between all nations.
On the 16th of February 2005, the Kyoto Protocol entered into legal force, despite the refusal of the USA and Australia to ratify the document. The Kyoto Protocol process began in 1985 in Vienna, producing the first authoritative evaluation of the magnitude of the climate change issue (Flannery, 2005). At the Rio Earth Summit in 1992, 155 nations signed the UN Framework Convention on Climate Change, which specified that signatory nations should reduce their greenhouse gas emissions to 1990 levels by 2000. In 1997, the signatories to the UN Framework Convention assembled in Kyoto, Japan, and assigned greenhouse emission targets to developing countries and made arrangements for emissions trading. It was not until late 2004 that enough nations ratified the Protocol for it to take effect in 2005.
The current fundamental obstacle to a functional global agreement is the issue of equity. Industrialised nations use energy at a much greater rate than developing nations, despite the majority of the world’s population living in the less-industrialised countries. Quite understandably, developing nations refuse to accept any agreements that arrest their standards of living at a level below that enjoyed by industrialised nations who historically became wealthy as a result of monopoly of fossil fuel reserves and associated technologies.
The science on which the Kyoto Protocol is based is collated and assessed by the Intergovernmental Panel on Climate Change (IPCC). The IPCC is a joint subsidiary body of the United Nations Environment Program and the World Meteorological Organisation. The most recent publication of the IPCC was released in 2001 (the Third Assessment Report) and was the work of 426 experts, whose conclusions were refereed twice by 440 reviewers and approved by delegates from 100 nations (Flannery, 2005).
Climate Change Scenarios
By 2105, the world will have changed in ways that are difficult to imagine, making it challenging to predict future climate change. Three climate change scenarios have been developed, each taking a different direction in future developments. These scenarios aim to encompass a range of driving forces from demographic to social and economic developments, and they cover a range of future greenhouse gas emissions.
Scenario 1: Pessimistic Scenario
Scenario 1 assumes that no global effort is made by governmental bodies or the general public to reduce levels of greenhouse gases, resulting in a continued increase in greenhouse gases.
Scenario 2: Realistic Scenario
Scenario 2 assumes an effort is made to reduce greenhouse gases (through the ratification of the Kyoto Protocol), resulting in reduced greenhouse gas emissions by first world countries. Developing countries continue to emit, as defined in the Protocol.
Scenario 3: Optimistic Scenario
Scenario 3 assumes that global recognition above the Kyoto Protocol takes place, reducing total greenhouse gas emissions. First world countries aid the rest of the world with the incorporation of sustainable energy systems, and sustainable agricultural and reforestry practices.
Predicted Physical Changes in 2105
For the purposes of this report, only the impact of climate change upon the following features of the Antarctic environment will be considered:
Temperature
Precipitation and Snow Cover Land- and Sea-Ice Extent Sea Level
Biota
Scenario 1: Pessimistic Scenario
Temperature
Increasing concentrations of CO2 and other greenhouse gases change the radiation
budget of the earth, resulting in a rise in the global mean temperature. The global mean surface temperature has increased by 0.6°C 0.2°C since the late 19th century, and is currently increasing by 0.15°C 0.05°C/decade (IPCC, 2001).
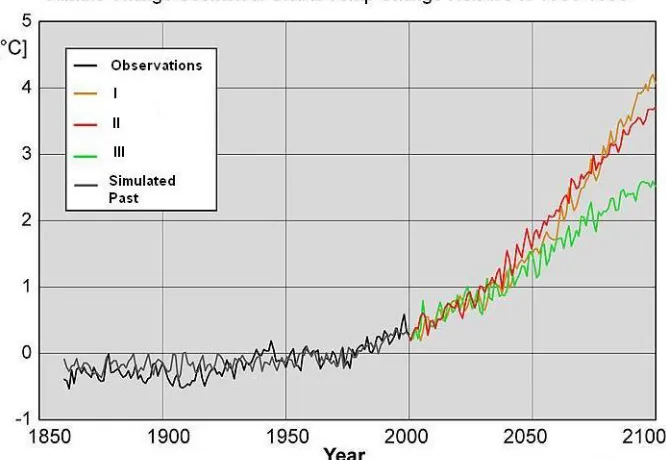
the scale i.e. around 4°C (refer Scenario I in Figure 5: Predicted Global Temperature Changes for Scenario).
In Scenario 1, the polar regions are predicted to warm between 1.5 and 4 times the global average (Harris & Stonehouse, 1991). The temperature changes are likely to be larger in the northern hemisphere than in the southern hemisphere because of the thermal buffer of the Southern Ocean.
Significant warming has been experienced along the Antarctic Peninsula since the 1950s, with a 2.5°C warming trend in the mean annual air temperature over the last 50 years. Temperatures measured at stations along the Peninsula indicate that this warming trend corresponds closely with the global temperature increase, but at a higher level, suggesting that the peninsula has high climate sensitivity. This provides further evidence to the statement above, suggesting that in Scenario 1, the temperature of the Peninsula will rise at rates of 1.5 – 4 times the global average.
It is difficult to predict how the temperature will change over the rest of the continent due to the diversity of temperature data from East and West Antarctica. One analysis of 30 years of data from stations across the continent showed a large inter-annual variability, and consistency in trends between stations, but no significant linear trend (Sansom, 1989), suggesting that there is no significant evidence of temperature changes over the continent to date.
A further analysis showed overall warming at permanently occupied stations on the Antarctic continent over the period 1959-1996, with a mean warming rate of 0.9-1.2°C per century (IPCC, 2001). The warming trends were shown to be largest in winter and smallest in autumn.
From these results, it is possible to state that there is insubstantial evidence to suggest that the temperature of the continent is changing. It suggests that any significant temperature changes will only occur over very long periods of time so changes observed over short time intervals will not provide a reliable picture of how the climate is changing.
From the existing temperature data, it can be predicted that in Scenario 1 there will be no significant change in temperature over East and West Antarctica, but warmer temperatures will be observed at the coastal regions and the Peninsula.
Precipitation and Snow Cover
Changes in precipitation and snow cover can have a major impact on the mass balance of the Antarctic Ice sheet. The ice sheet mass balance consists of gains from the precipitation of snow and ice crystals, and losses mainly through iceberg calving (surface melting and run-off, basal melting beneath the ice shelves, evaporation and snow blown off the continent account for only a small proportion of the total mass balance).
It is difficult to determine whether there have been any recent changes in precipitation over Antarctica as snow gauges are unreliable and most research stations are coastal and therefore not representative of the ice sheet as a whole. However, model results reported by the IPCC indicate that the accumulation rate for the East Antarctic ice sheet surface has increased by a rate of 1.9 mm/yr over the period 1950-1991 (IPCC, 2001).
Scenario 1 assumes that the level of greenhouse gases will continue to increase, resulting in an increased rate of global warming. The warmer air produced will transport more moisture to Antarctica, leading to a prediction that the Antarctic Peninsula will become much wetter as it is the most northern part of Antarctica and therefore has the most moderate climate.
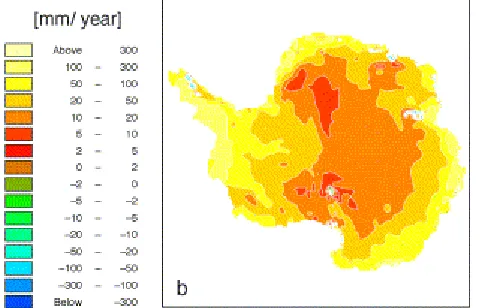
This warmer air will also lead to an increase of snowfall in winter and summer within the Antarctic continent, with the continental coastal regions experiencing the highest accumulation of snow (IPCC models predict up to a 48% increase over the area of Antarctica (Carter et al., 2000)). Figure 3: Predicted Snowfall Levels for 2105 (illustrates the IPCC predicted snowfall levels for 2105.
[image:10.612.191.431.351.505.2]This increased level of snowfall will result in an increase in the thickness of the ice sheet. There will be little impact on melt however as the temperatures will remain well below freezing, except in limited coastal localities.
Figure 3: Predicted Snowfall Levels for 2105 (Huybrechts et al., 2004)
Land- and Sea-Ice Extent
A collapse of the West Antarctic Ice Sheet (WAIS) is considered to be very unlikely during the 21st century (Huybrechts et al., 2004). Different models suggest that it takes at least a couple of centuries until the WAIS will collapse as a result of the accumulation of greenhouse gases and the associated climate change (Van der Veen, 2001). However, the WAIS may be already irreversibly affected by climate change (Oppenheimer, 1998). Ice stream velocity is thought to be the most important factor for ice sheet mass balance. To ensure the future stability of the WAIS, it is vital for these ice streams to adapt to the rate of climate change in order to conserve mass balance.
With respect to East and West Antarctica, increasing precipitation will lead to a thickening over most interior parts, while thinning is expected at the coastal areas.
crevasses and water pressure will force these crevasses to propagate through the full ice thickness. Rapid break ups will result in large numbers of elongated icebergs, which will be smaller than the large tabular icebergs calved from intact ice shelves. In addition to the significant decline of ice shelves, a major reduction in sea-ice extension is
expected. Ocean circulation may play an important role in determining the sea-ice conditions (Nicol, 2000). In turn, the amount of sea-ice can affect air temperatures. However, the role of air-sea-ice interactions is still not fully understood.
Sea Level
If we assume that the present Antarctic contribution to sea level rise remains constant for the next 100 years, a total rise of 0.19m would occur.
However, the latest IPCC report projects an Antarctic contribution to sea level rise of -0.17m to +0.2m by considering a number of different feedback mechanisms of the Antarctic to global warming.
The impact of ice stream currents, which may have an important impact on the Antarctic mass-balance, are not assessed within the IPCC report. Oppenheimer (1998) considered three different scenarios in which ice streams respond differently to climate change. A slightly negative contribution of the Antarctic is still possible in one of his scenarios, however the most likely scenario would result in a positive sea level rise between 0 and 0.19m.
In general, the sea level rise is also controlled by oceanic circulation and the hydrologic cycle (precipitation minus evaporation) which causes regional differences in sea level rise. While the sea level will rise twice the global mean in the Arctic, the sea level in the Antarctic region will be almost unaffected by the global sea level rise (DKRZ, 2006).
Biota
A warming trend has been documented for the Antarctic Peninsula since the 1940s, and a decreased frequency of extensive winter sea-ice conditions has been associated with this trend (Loeb et al., 1997). The melting and break up of the sea ice in these areas has had a huge effect on the biota living not just within the sea ice itself, but also on the majority of other marine and terrestrial animals that inhabit the Peninsula.
Antarctic marine systems have suffered major perturbation through hunting and fishing over the last two centuries, particularly amongst top predators (Croxall et al. 2002). The consequential changes in these ecosystems remain unknown or inferred, but they potentially complicate the detection of changes attributable to climate warming on the marine environments or on the prey on which seabirds rely (Coxall et al., 2002). For the purpose of this report, the events of past and future human influence are disregarded, and it is assumed that all changes in populations of Antarctic life are directly influenced by climate change up to the year 2105.
The increase of precipitation in areas such as the Ross Ice Shelf will lead to the accumulation of snow and ice, creating non-optimal conditions for algal growth within the ice (Mangoni et al., 2004). Without the biomass of phytoplankton and zooplankton which feed off algal growth, there will be a marked decrease in the production of krill (assuming that the current krill harvesting practices are not negatively influencing productivity and numbers are sustained over time) from lack of food availability.
Krill (Euphausia superba) is a major herbivore that transfers energy within the Antarctic marine ecosystem (Smith et al., 1999) and is closely coupled to sea-ice during various stages of its annual life cycle. With the retreat of sea-ice in Scenario 1, the reproduction and maturation of the species will be limited (Barbraud & Weimerskirch, 2001). The reduction in krill populations may enable other species such as salps, a pelagic tunicate that does not rely on sea-ice, to colonise areas in which krill were previously the predominant species (Loeb et al., 1997). Salps are not a preferred food source for organisms that occupy higher trophic levels in the food web, specifically seals and penguins, and thus negative feedbacks to the ecology of these consumers can be anticipated as a consequence of shifts in phytoplankton community composition (Moline et al., 2004).
This shift of lower level trophic communities will dictate a change in the abundance and distribution of higher animals such as seals, penguins and other sea birds and whales (Barbraud & Weimerskirch, 2001). According to Nicol et al. (2000), phytoplankton, primary producers, Antarctic krill, whales, and seabirds are concentrated where winter sea ice extent is greatest. This leads to a prediction of a southerly movement of animals in Scenario 1, as Southern latitudes will contain the most sea-ice.
Although ocean currents are believed to influence the distribution of high level organisms in relatively minor ways, the role of sea ice extent is more directly linked to this issue due to the populations of krill and other prey items associated with it.
Studies by Smith et al. (1999) indicate that the extent to which penguin populations are distributed throughout Antarctica and the Sub Antarctic Islands is indicative of changes that are occurring. Adelie Penguins have been used to predict subtle changes in environments due to climate change since the 1990’s (Croxall et al., 2002). During the winter, Adelies appear to be dependant on the zone of sea ice within 100km of the pack-ice edge, known as the marginal pack-ice zone where they forage for krill and small fish. In summer, when they depend almost exclusively on krill, the late breakout of ice can prevent them from breeding or seriously affect breeding success. The predicted increase in the average temperatures on the Peninsula will result in Adelie penguin colonies moving further south to experience such conditions.
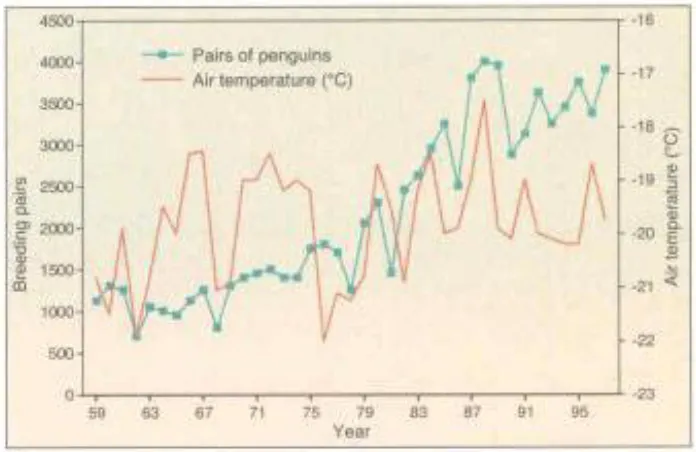
Figure 4: Trends in breeding population of Adelie Penguin in the Ross Sea in relation to air temperature (Fraser et al., 1996)
As the Peninsula warms, Adelie penguins are moving to lower latitude areas such as the Ross Sea region as optimal sea-ice conditions are located further south (refer Figure 4). According to data from models constructed by Smith et al. (1999), this has resulted in improved nesting success of colonies more south than Cape Royds, and has increased food availability within close range of these colonies. Such distribution was seen approximately 6000 years before the present time, during a natural climate fluctuation (Croxall et al., 2002). Studies by Croxall et al. (2002), also predict that these shifts in the distribution of penguin species have been rapid changes rather than gradual and slow shifts. As the Peninsula continues to warm this movement of populations is predicted to continue at a similar rate.
A lack of extensive sea ice has a negative effect on the populations of Emperor penguin in the Ross Sea region (Barbraud & Weimerskirch, 2001), with increased adult mortality because of warmer sea temperatures in areas of foraging. Emperor penguins do not merely rely on the extent of sea ice for food availability, but also a platform on which they can spend 3 to 4 weeks late in the summer season to moult. A lack of sturdy and reliable pack ice on which to undertake this annual moult will severely affect the survivability of adult, fledglings and juveniles alike (Croxall et al., 2002).
The Weddell seal is also very reliant on the sea ice during the breeding season. In order to pup in the spring, female seals must first haul onto the sea ice, so that the pup, which is born with virtually no insulation, can survive long enough to acquire a thick layer of blubber to serve as a protective layer from the cold ocean temperatures. Without this ice, the seals will be forced to go ashore on beaches or migrate further south, which creates problems with access and the maintenance of territory for males.
the whales can be expected to do the same. The response to a reduction in krill abundance is an important variable to the presence of whales in Antarctic waters.
The marine environment is not the only place that has experienced major changes in biological abundance and distribution as a result of climate change in the last century. Terrestrial biota is affected by changes in precipitation (and therefore water availability), UV-A and UV-B radiation levels, exposure of ground for new colonisation and temperatures, especially in the summer months (Convey et al., 2002). The majority of terrestrial animals live in and among the limited flora that also inhabits warmer parts of the Peninsula. There has already been a large increase in the number of flowering plants on the Peninsula and the ice-free coastlines (Fowbert & Smith, 1994) and this is expected to continue.
Models by Convey et al. (2002) predict significant changes to populations of invertebrates, consistent with changes in both habitat structure and food quality. Ozone levels are expected to recover over Antarctica by about 2040, resulting in a decrease in UV exposure (WMO, 2002). The increased water availability from warming and the decrease in UV are believed to positively affect the numbers of terrestrial species. Temperature increases will have a negative influence on population size and distribution, but the extent of this influence in 2105 is unknown.
Scenario 2: Realistic Scenario
Temperature
As discussed in Scenario 1, a mean global warming between 2.5 and 4.1°C is expected over the next 100 years, dependent on the level of greenhouse gases emitted into the atmosphere during that time. Scenario 1 assumes that an effort is made by first world countries to reduce their greenhouse gas emissions. Although the level of greenhouse gases will continue to increase, they will not increase at the same rate as Scenario 1. Considering these possible future developments, and applying the IPCC’s methodology, the predicted mean global temperature increase in this case will be between 3-4°C (refer Scenario II in Figure 5: Predicted Global Temperature Changes for Scenario).
With respect to Antarctica, the warming on the Antarctic Peninsula is predicted to rise in much the same way as in Scenario 1, but at slightly slower levels. As discussed in Scenario 1, the temperature of the Peninsula will continue to rise at rates of 1.5 – 4 times the global mean, so a decrease in the expected global mean temperature will result in slightly lower temperature increase along the Peninsula than predicted in Scenario 1.
No significant change in temperature over East and West Antarctica is predicted.
Precipitation and Snow Cover
It is predicted that the Antarctic Peninsula will continue to get wetter and snowfall will increase over summer and winter within the continent. These increases will be more conservative than the increases predicted for Scenario 1.
Sea Level
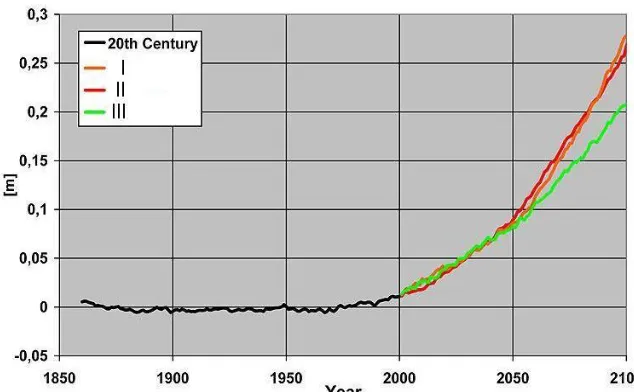
Latest climate simulation results, which are based on the IPCC scenarios and result in similar greenhouse emissions as proposed in Scenario I and Scenario 2, show no significant difference in global sea level rise in both scenarios (DKRZ, 2006).
The regional distribution of sea level rise shows the same characteristics i.e. small up to negative sea level rise in the Antarctic region
Land- and Sea-Ice Extent
The same behavior is expected for the Land- and Sea-Ice extent as for Scenario I. Positive thickening of the interior ice sheets due to an increase of precipitation and a marked ice loss over the Antarctic Peninsula will take place. Due to the complexity of the involved loss processes, it is difficult to estimate the actual difference in mass balance for both scenarios.
Biota
Changes to the biota of terrestrial and marine environments in Scenario 2 are quite similar to the changes outlined in Scenario 1. As previously mentioned, there is a significant decline in sea ice extent on the Peninsula, resulting in changes to ocean primary producers and planktonic distribution.
Scenario 3: Optimistic Scenario
Temperature
As discussed in Scenario 1, a mean global warming between 2.5 and 4.1°C is expected over the next 100 years, dependent on the level of greenhouse gases emitted into the atmosphere during that time. Scenario 3 assumes that a global concerted effort is made to reduce greenhouse gas emissions, to levels lower than the relative 1990 levels as set out in the Kyoto Protocol. Considering these future developments, and applying the IPCC’s methodology, the predicted mean global temperature increase in this case will be between 2-3°C (refer Scenario III in Figure 5: Predicted Global Temperature Changes for Scenario).
With respect to Antarctica, the warming on the Antarctic Peninsula is predicted to rise but at a slower rate to the other two scenarios. As discussed in Scenario 1, the temperature of the Peninsula will continue to rise at rates of 1.5 – 4 times the global mean, so a decrease in the expected global mean temperature will result in a lower temperature increase along the Peninsula.
Figure 5: Predicted Global Temperature Changes for Scenarios Similar to Scenario I, II and III (adapted from DKRZ, 2006)
Precipitation and Snow Cover
Although Scenario 3 assumes a global concerted effort is made to reduce greenhouse gas emissions, global climate change is inevitable. Temperatures and sea levels will continue to be affected for at least the next 100 years because of a time lag in the oceans’ response to atmospheric temperatures (Holmes, 2005).
As an increase in precipitation over the ice sheet is the principal short term response to a warming climate in Antarctica, precipitation is still expected to increase in Scenario 3.
It is predicted that the Antarctic Peninsula will continue to get wetter and snowfall will increase over summer and winter within the continent. These increases will be more conservative than the increases predicted for Scenarios 1 and 2.
Sea Level
Figure 6: Mean Global Sea Level Change for Scenarios Similar to Scenario I, II and III (adapted from DKRZ, 2006)
Land- and Sea-Ice Extent
A reversal of the predicted characteristics in Scenarios I and II is not expected for our scenario III, as global temperatures will still rise due to the long term feedback mechanisms to anthropogenic climate change. An ongoing negative mass balance of the Antarctic Peninsula is likely for the 21st century, although the loss rate might be less. Our understanding of the sudden response of the Antarctic Peninsula is still incomplete and at this stage it is hard to predict if the ice loss which we are experiencing now can be reduced by human effort in terms of scenario III.
Although the Antarctic environment may look similar to the environment predicted by the other scenarios, the future of the WAIS can be strongly determined by the situation in the 21st century. Again, the stability assessment is a complex task and today’s estimates show big uncertainties how much effort is necessary to prevent a possible long term collapse of the WAIS.
Biota
In Scenario 3, the extent to which changes have become evident in the biological ecosystem are somewhat less due to the decreased pace at which changes are taking place. Although there has been some migration towards the south by marine animals and seabirds, the point to which they have ventured is not as far as in the first two scenarios.
Terrestrial organisms are affected by increased temperatures. The slight increase in precipitation will lead to an increase in the abundance of soil microarthropod populations (Convey et al., 2002). This response is consistent with the current view that restricted availability of liquid water is thought to provide a greater constraint on biological activity than low temperature (Block, 1996).
Discussion
Uncertainties in Model Predictions
Climate models project the response of many climate variables – such as increases in global surface temperature and sea level – to various scenarios of greenhouse gas and other human-related emissions. Not all physical processes can be included in these models and this makes it impossible for the models to simulate actual interactions within the Antarctic environmental system.
It is difficult to completely understand the Earth’s physical systems and this contributes to errors within climatic models. An example of this is the West Antarctic ice sheet whose stability is an area of great uncertainty. Coastal thinning rates cannot be entirely explained by melting, ablation and accumulation rates. Dynamical processes (e.g. creep rates) could have a great impact on the stability, in particular the dynamical regime of drainage in West Antarctica.
A number of models used to predict climate changes in the Antarctic environment have been adapted from other regions (such as the Greenland Ice Sheet). The areas these models were created for may not be subject to the same influences as Antarctica and the Southern Ocean, and this could lead to inaccurate conclusions.
However, even though these climate models may contain a number of uncertainties, they are the only means by which predictions on the future of the Antarctic environment can be made. This makes it impossible to prove whether such predictions are valid.
In order to estimate if a model projects a realistic scenario based on the assumptions made, these models must be compared to independent observations. If the model shows the same trends as the observations, this indicates the model is realistic. However, these observations are not always equally distributed throughout the area of interest and can be misleading. For instance, the majority of East Antarctica is not covered by ground based monitoring systems, whereas a great number of monitoring stations exists in the more accessible regions along the coastline, in particular the Ross Sea region and the Antarctic Peninsula.
Monitoring can also be affected by seasonal variations, for example, more data is collected during the summer period in Antarctica because of the greater human presence at this time. It is also important to note that only limited aspects within the Antarctic environment have been monitored over time and a smaller proportion of these recorded over a number of successive years. Possible trends and interactions may not yet be revealed by such monitoring and long-term trends can only be inferred by indirect measurements, such as sedimentary core sampling. Compared to direct measurements, indirect methods are coarse in resolution and have greater uncertainties.
Discussion of Findings
In summary, by 2105 it can be predicted that warmer temperatures will be observed on the Antarctic Peninsula and continental coastal regions, but no significant temperature change is expected over the rest of the continent. As a consequence of this, the Antarctic Peninsula will experience higher precipitation, and snowfall will increase over the East and West regions of the continent. Coastal regions will experience the largest accumulation of snow.
This increased precipitation will lead to a thickening of the ice sheet over most interior parts, while thinning is expected at the coastal areas. Therefore it is unlikely that the West Antarctic ice sheet will break up during the 21st century. Warming in the Antarctic Peninsula will result in a longer melt season supporting the break up of ice shelves and calving of icebergs. A major reduction in sea-ice extension is also expected.
This reduction of sea-ice extent will have a huge effect on the biota living not just within the sea ice itself, but also on the majority of other marine and terrestrial animals that inhabit the Peninsula. There is southward shift in populations of lower trophic levels in relation to sea ice retreat, which has dictated a change for higher level animals such as whales, seals, penguins and other seabirds. Terrestrial animals such as microarthropods have increased in abundance as a result of increased water availability on the outer fringes of the continent. Distribution of flowering plants on the peninsula increases, following the current trend influenced by the availability of optimal conditions.
Although there is no doubt that the global sea level will significantly rise within the next century, the Antarctic coastline will be unaffected according to the scenarios covered by this report.
The main issue with Scenarios 1, 2, and 3 is that they are too broad, resulting in great uncertainty in the predictions made. The IPCC uses a set of 40 scenarios and these cover the possible response of humankind to climate change in greater detail.
Although the scenarios used in this study are broad when compared to the IPCC scenarios, they do include the key climate change points. The most important point to note is that the response of Antarctica to climate change is a long-term process, but rapid changes may occur in certain regions, such as the Antarctic Peninsula. It should also be noted that the rate of climate change may irreversibly determine the long-term future of Antarctica. This rate of change is ultimately dependant on the decisions of policy makers and the actions of human kind.
It can be concluded from the above scenarios that further steps beyond the Kyoto Protocol are necessary to counteract the predicted climate change.
Recommendations
For any climate change predictions to be of value an accurate model is required. Not all of the models used in this study fully portray the uncertainties involved. The development of improved models heavily relies on the collation of accurate environmental data from all regions of the continent.
Conclusions
The scenarios discussed in this report all indicate that the Antarctic environment is vulnerable to climate change, with the only difference between the three scenarios being the rate at which the changes occur.
Although the scenarios are broad compared to the IPCC scenarios, both sets of scenarios predict the same main climate changes. The key point to note is that the response of Antarctica to climate change is a long-term process, even though rapid changes may occur in certain regions like the Antarctic Peninsula.
References
1. Barbraud, C., & Weimerskirch, H., 2001, Emperor Penguins and climate change.
Nature411 pp183-186.
2. Barrett, P.J., 2001, An Antarctic Perspective on Climate Change, New Zealand
Science Review58:1.
3. Block, W., 1996, Cold or drought – the lesser of the two evils for terrestrial arthropods? European Journal of Entomology93 pp 325-339.
4. Carter et al., 2000, Sited in: IPCC, 2001, Scientific Technical Summary. Online report retrieved from World Wide Web, 29/11/05: http://www.ipcc.ch.
5. Convey, P., Pugh, P., Jackson, C., Murray, A., Ruhland, C., Xiong, F., & Day, T., 2002, Response of Antarctic Terrestrial Microrthropods to Long-term Climate Manipulations. Ecology83:11 pp 3130-3140.
6. Croxall, J., Trathan, P., & Murphy, E., 2002, Environmental change and Antarctic seabird populations. Science297: 5586, pp 1510-1515.
7. CSIRO Marine Research, 2006, Southern Ocean and Antarctic Circumpolar Current. Online information retrieved from World Wide Web, 10/01/06:
http://www.marine.csiro.au/LeafletsFolder/10ocean/10.html.
8. DKRZ, 2006, Simulations of Climate Change for IPCC AR4. Online information retrieved from World Wide Web, 10/01/06:
http://www.dkrz.de/dkrz/science/IPCC_AR4/scenarios_AR4_Intro?setlang=en_US
9. Flannery, T., 2005, The Weather Makers, Text Publishers, Australia.
10. Fowbert, J., & Smith, R., 1994, Rapid population increase in native vascular plants in the Argentine Islands, Antarctic Peninsula. Arctic and Alpine Research26 pp 290-296.
11. Fraser W., Trivelpiece, W., Ainley, D., & Trivelpiece, S., 1996, Increases in Antarctic penguin populations: reduced competition with whales or a loss of sea ice due to environmental warming? Polar Biology11 pp 525-531.
12. Garrison D., 1991, Antarctic Sea Ice Biota. American Zoology 31 pp17-33.
13. Harris, C. & Stonehouse, B. (eds), 1991, Antarctica and Global Climatic Change, Belhaven Press, United Kingdom.
14. Holmes, B., 2005, Ocean heat store makes climate change inevitable,
NewScientist.com. Online article retrieved from World Wide Web, 16/01/06:
15. Huybrechts, P., Gregory, J., Janssens I., Wilde M., 2004, Modelling Antarctic and Greenland volume changes during the 20th and 21st centuries forced by GCM time slice integrations. Global and Planetary Change,42: 1-4 pp 83-105.
16. IPCC, 2001, Impacts, Adaptation and Vulnerability Technical Summary. Online report retrieved from World Wide Web, 29/11/05: http://www.ipcc.ch.
17. IPCC, 2001, Scientific Technical Summary. Online report retrieved from World Wide Web, 29/11/05: http://www.ipcc.ch.
18. Kump, L.R, 2002, Reducing uncertainty about Carbon Dioxide as a climate driver,
Nature419 pp 188-90.
19. Landcare Research, 2006, Antarctica Facts and Figures. Online information retreived from World Wide Web, 09/01/06:
www.landcareresearch.co.nz/research/biodiversity/penguins/Ant_facts_figs.asp.
20. Loeb, V., Siegel, V., Holm-Hansen, O., Hewitt, R., Fraser, W., Trivelpiece, W. & Trivelpiece, S., 1997, Effects of sea-ice exent and krill or salp dominance on the Antarctic food web. Nature 37: 897-900.
21. Lowe, I., 2005, Living in the hothouse, Scribe Publishers, Australia.
22. Mangoni O., Modigh, M., Conversano, F., Carrada, G. & Saggiomo, V., 2004, Effects of summer ice coverage on phytoplankton assemblages in the Ross Sea, Antarctica. Deep-sea Research I 51: 1601-1617.
23. Moline, M., Claustre, H., Frazer, T., Schofield, O., Vernet, M., 2004, Alteration of the food web along the Antarctic Peninsula in response to a regional warming trend. Global Change Biology, 10:12 1973.
24. Nicol, S., 2000, Ocean circulation off east Antarctica affects ecosystem structure and sea-ice extent, Nature406 pp 501 – 507.
25. Oppenheimer, M., 1998, Global warming and the stability of the West Antarctic Ice Sheet, Nature393 pp 325-331.
26. Oppenheimer, M., 2004, Polar Ice Sheets, Melting and Sea Level Change, Questions and Answers about Global Climate Change, Princeton University.
27. PhysicalGeography.net, Fundamentals of Physical Geography. Online information retrieved from World Wide Web, 10/01/06:
http://www.physicalgeography.net/fundamentals/8q.html.
28. Sansom, J, 1989, Antarctica surface temperature time series, Journal of Climate 2 pp 1164-72.
30. Smith R., Ainley, D., Baker, K., Domack, E. et al., 1999, Marine ecosystem sensitivity to climate change. Bioscience49:5 pp 393-404.
31. Tynan, C., 1998, Ecological importance of the Southern Boundary of the Antarctic Circumpolar Current. Nature392 pp 708-710.
32. van der Veen, C.J., 2001, Polar ice sheets and global sea level: how well can we predict the future? Global and Planetary Change32:2-3, pp 165-194.
33. Weizmann Institute of Science, Interaction between ocean biota and climate. Online information retrieved from World Wide Web, 10/01/06:
http://www.weizmann.ac.il/ESER/People/Hezi/biota_climate_interaction.html.
34. Wilson, C.A. and Mitchell, J.F.B., 1987, “A doubled CO2 sensitivity experiment with a
GCM including a simple ocean”, Journal of Geophysical Research 92 pp 13315-43.
35. World Meteorological Organization (WMO), 2002, Scientific Assessment of Ozone
Depletion: 2002. Online report retrieved from World Wide Web, 16/01/06: