Physiological Effects of Chitosan Coating on Wheat
Growth and Activities of Protective Enzyme with Drought
Tolerance
Defang Zeng*, Xinrong Luo
School of Resource and Environmental Engineering, Wuhan University of Technology, Hubei Key Laboratory of Mineral Resources Processing and Environment, Wuhan, China.
Email: *df5152@163.com
Received March 17th,2012; revised April 20th, 2012; accepted May 3rd, 2012
ABSTRACT
Seedling period is an important stage of plant growth. This research was mainly to analysis the influence of chitosan on wheat seedling growth and physiological mechanisms under drought stress. The results showed that the group coated with chitosan significantly improved the growth index such as germination rate, wet weight, root length, root active, and impacted physiological indices such as superoxide dismutase (SOD), peroxidase (POD) and catalase (CAT)), the con- tent of malwondialdehyde (MDA) and chlorophyll compared with CK under drought stress. Activities of POD, CAT and SOD increased and then decreased, the content of MDA increased under drought stress. But variation rates of the group coated with chitosan were slower than that of CK, which indicates that chitosan can significantly improve anti- oxidant enzymes activity to clear timely active oxygen and reduce the content of MDA so as to alleviate the degree of damage in the drought stress and make seedlings grow better. The results also showed that chitosan improved chloro- phyll content than that of CK, which demonstrated that chlorophyll content significantly influenced the photosynthetic efficiency of the mutant and added wheat above ground biomass and the field experiment results showed that chitosan increased yield 13.6% than that of CK.
Keywords: Biologicalstress; Chitosan; Drought Stress; Protective Enzyme; Physiological Features
1. Introduction
Abiotic stress is the major cause of crop loss worldwide [1,2]. Drought is one of the greatest abiotic stress to agriculture, inhibiting plant growth and reducing produc- tivity [3,4]. Wheat is the most widely planted in the main crop zone, about 70% of which are droughty, or semiarid areas, the demand for crop supply has increased corre- spondingly [5,6]. So it is urgent to improve wheat yields even under the unfavorable conditions. Depending on di- fferent statuses of soil water, biochemical changes to va- rious extents, occurred in wheat grains. Polysaccharide was a more effective way to improve the capacity of drought resistance [7,9]. The existing results [10-13] showed that certain concentration of polysaccharide can enhance the capacity of cold, salt and drought resistance for crops. Chitosan and its derivatives from aquatic pro- ducts such as waste shrimp, crab shells were mainly in- exhaustible marine resources. For its non-toxic, non- pollution and biodegradation, in recent years they have been widely researched and applicated as efficient green
pesticides and plant growth regulator in agricultural fields [14,15]. Therefore, it has become a hot issue to elucidate the possible responses and adaptation of plants to drought.
The present study aimed to investigate whether the agent can improve the ability of fighting drought for plants, so as to provide theoretical reference for the deve- lopment and application of chitosan for crops. Thronght the study, chitosan mainly through raising the activities of POD, CAT and SOD, and other biological resistance such as seed germination and germination potential, leaf length, root length, chlorophyll concentration, so as to improve drought resistance and increase wheat yield.
2. Materials and Methods
2.1. Materials
2.1.1. Main Experimental Apparatus
and humidity incubator WS-01 (Hubei Huangshi Heng- feng Medical Instrument Co., Ltd., Hubei, China), elec- tronic balance (FA2004, ShanghaiYuefeng Instrument Appearance, Ltd., Shanghai, China), warm up hygrometer STH950 (Summit, USA), biological microscope BX41- 12HO2 (Olympus Corp., Japan) and petri dishes (90 cm dia., Shanghai Yuejin Medical Treatment Instrument Plant, Shanghai, China), 722 type uvvis spectrophoto- meter (Beijing at general chromatography instrument Co., LTD); TDL-5 A desktop centrifuge (Shanghai anting scientific instruments plant); SPAD-502, Minolta, Japan.
2.1.2. Main Experimental Reagents
Glacial acetic acid and no water ethanol, 95% ethanol, quartz sand, calcium carbonate powder are domestic ana- lysis pure, wheat seeds (Hubei provincial seed group com- pany).
Chitosan was dissolved at 0.2% C, 0.4% C, 0.6% C, 0.8% C and 1% C (w/v) into aqueous solutions of acetic acid at 1% C (w/v). The pH of solution was adjusted to 6.0 using 1% NaOH.
2.2. Experimental Design
The wheat seeds coated at 1:50 (w/w) with chitosan and designed a control group (CK) were subjected to soil water treatments of 75%, Until all seeds sprouted in 7 days after they were sown, relative water content was controlled at 30% for 10 days, then changed at 75%. All kinds of growth indexes in seedlings were measured un- der drought stress every two days. The date of fertilizer applications and management were the same for all treat- ments. The trial design was a completely randomized plot design with three replications.
2.3. Collection and Measurement of Parameters
The first outspread leaf from top was cut and wiped with a wet pled. Plant roots were sampled with a shovel in 0 to 60 cm soil depth below the wheat stem and separated from the soil by washing over a sieve. All samples were immediately frozen under liquid N, and then stored at super-low refrigerated conditions (–20˚C) for enzyme (SOD, POD, CAT), MDA and chlorophyll further analy-sis.
2.3.1 Germination Rate
According to the seed test procedures methods of inter- national seed association (ISTA), germinating energy (GE), germination percentage (GP) and germination in- dex (GI) were as follow:
GE % C E 100%
GP % D E 100%
GI %
F G 100%where C is the number of germinated seeds on the third day, D is the number of germinated seeds on the seventh day, E is the number of total seeds investigated, F is the number of germinated seeds one day; and G is the days of seeds germination.
1 2
Percentage of moisture % W W W1
where W1 is fresh weight of seedling; W2 is dry weight of seedling investigated.
Root activity was determined by TTC (chlorinated three phenyl four nitrogen method). The following for-mula was used to calculate vitality of root:
1 1
Vitality of root mg g h TTC reduction amount mg
root weight g time h
2.3.2. Malonaldehyde (MDA)
The MDA content was determined [16] (TBA) as de-scribed by Heath and Packer. The absorbances at 450 nm, 532 nm and 600 nm were determined with an ultraviolet spectrophotometer. The MDA contents were calculated using the following formula:
532 600
450MDA 6.45 D D 0.56D
D532, D600 and D450 were the absorbance valve in 532 nm, 600 nm and 450 nm of extraction.
2.3.3. Assay of Protective Enzyme
In the different dry conditions, measurements of SOD, POD, and CAT activities were performed every 2days. Roots were cut in different direction of each pot (contain- ing two seedlings) with borer (2 cm), repeated in all the pots of each treatment. SOD, POD and CAT were deter- mined by the method described by Giannopolitis and Ries [17].
2.3.4. Assay of Chlorophyll
Chlorophyll was determined using a chlorophyll meter (SPAD-502, Minolta, Japan). Leaves for each genotype in both well-watered and drought-stress conditions were measured every 2 days after drought stress (30%) and the following 3rd day after well-water treatment (75%). The method for chlorophyll analysis was described by Arnon [18].
2.3.5. Field Trial
test, the method of seed treatment was the same as that in the laboratory experiment, the wheat seeds were coated with chitosan in the proportion of 1:50 (w/w). The experi- ment was conducted at Hubei Provincial Seed Group Company. The experiments were designed as a rando- mized block, and each treatment was replicated three times.
2.4. Statistical Analysis
All data presented were the mean values of six replicates and were analyzed by Duncan’s multiple new range test using SAS software. The small letters and capital letters mean significance of difference under p < 0.05 level.
3. Results and Discussion
3.1. Effect of T on Wheat Seed Germination and Seedling Growth
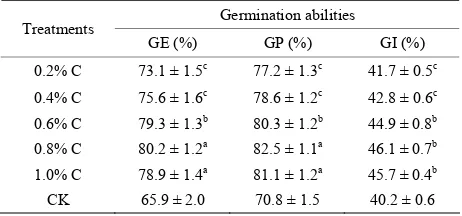
As can been seen in the Table 1, the influences of the different concentrations on wheat germination abilities were different. Along with the increasing concentration, the effect was more obvious, and when in 0.8% C, ger- mination abilities were the best, then dropped. growth parameters of T were significantly higher than those of CK.
Through the experiments, the results showed 0.8% C was the best one to germination abilities. The next steps were based on 0.8% C named after T.
The results of T on wheat seed germination and seed- ling growth can be showed in Table 2. As can be seen, Seeding height, fresh weight, percentage of moisture, taproot length and vitality are regarded as the major in- dexes to reflect crop condition with varying degrees. The longer the root, the bigger surface plants absorb moisture and nutrients improving the root activity, which can gua- rantee supplying nutrients for seedling growth and make seedlings thrive. The results indicated chitosan effect- tively developed and raised seed germination rate in some arid or semiarid condition. From Table 2, seeding height, root length, and fresh weight greatly improved compared to CK, especially in some arid or semiarid condition, it was significantly higher.
3.2. In Dry Conditions, the Influence of T on MDA
The influence of T on MDA can be showed in Figure 1, MDA contents of wheat seedlings increased along with the increase of stress time and the stress intensity streng- then. but the increasing speed with chitosan was slower obviously than that of CK in the drought stress condition. When soil moisture back from 30% to 70%, the content of MDA began to reduce, but the speed of T was faster
than that of CK. Cell membrane system is considered be sensitive areas under the stress environment, MDA is one of the membranous peroxide product, how many the content of which can represent the degree of damage of the cell membrane. The experimental results showed that in the drought stress, MDA content of seedling treated with T had significant reduction than that of CK, which is good for quenching active oxygen, maintaining normal function of biomolecules, protecting biological mem- brane system and alleviating damage in drought stress. It also found that chitosan has timeliness to relieve drought damage for wheat seedlings.
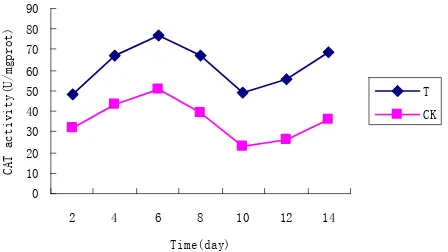
3.3. Effects of T on Enzyme Related Index
The influence of T on enzyme related index can be showed from Figures 2-4. Compared with CK, T im- proved obviously the activities of POD, CAT and SOD in the drought stress condition. The activities of wheat seedlings decreased along with the increase of stress time and the stress intensity strengthen. When soil moisture back from 30% to 70%, the activities of POD, CAT and SOD began to increase, but the speed of T was faster than that of CK. SOD, CAT and POD are the protective enzyme system to resist the damage of free radicals and play an important role in defense mechanism in adversity stress.
[image:3.595.308.539.606.714.2]In a certain extent, the enzyme activities reflect plant resistance. SOD catalyzes super oxygen free radicals to form H2O2 with low activity; then is converted into H20 and O2 without oxidation activity by POD or CAT. Co- ordination function of the three clears the reactive oxy- gen species, reduce the level of membrane lipid peroxi- dation, so as to improve the adaptability of resistance in the adversity stress [19,20]. The experimental studies found that T can significantly improve antioxidant en- zymes activity of SOD, POD and CAT, strengthen the ability of clearing active oxygen and alleviate the degree of damage in the drought stress.
Table 1. Effects of different treatments on germination abilities.
Germination abilities Treatments
GE (%) GP (%) GI (%)
0.2% C 73.1 ± 1.5c 77.2 ± 1.3c 41.7 ± 0.5c 0.4% C 75.6 ± 1.6c 78.6 ± 1.2c 42.8 ± 0.6c 0.6% C 79.3 ± 1.3b 80.3 ± 1.2b 44.9 ± 0.8b 0.8% C 80.2 ± 1.2a 82.5 ± 1.1a 46.1 ± 0.7b 1.0% C 78.9 ± 1.4a 81.1 ± 1.2a 45.7 ± 0.4b CK 65.9 ± 2.0 70.8 ± 1.5 40.2 ± 0.6
Table 2. Effect of T on wheat seedling growth.
Treatments Percentage of moisture (%) Seeding height (cm) Fresh weight (mg) Taproot length (cm) Vitality of root (mg·g−1·h−1) T 86.1 ± 0.4b 14.23 ± 0.8b 568 ± 1.7a 5.32 ± 0.5a 0.42 ± 0.06a
CK 83.1 ± 0.6 13.85 ± 1.0 502 ± 1.3 4.16 ± 0.3 0.29 ± 0.09
3.4. Effects of T on Chlorophyll
0 2 4 6 8 10
2 4 6 8 10 12 14
Time(day)
MD
A
co
nt
en
t(
nm
ol
/m
gp
ro
t)
T CK
[image:4.595.64.283.306.413.2]The influence of chitosan on chlorophyll content can be showed in Figure 5, the graph of chlorophyll content both CK and chitosan indicated a gradual decline, but the decreasing speed with chitosan was slower than CK dur- ing the period of drought stress. When soil moisture back from 30% to 70%, chlorophyll content began to increase, but the speed of T was faster than that of CK Chlorophyll is the material basis of photosynthesis, the content of which directly influences the photosynthetic production. This shows that chitosan can obviously increasesd pho- tosynthetic capacity of seedlings, and accumulation of organic matter, which is beneficial to the growth of the young plants under drought stress condition.
Figure 1. Effect of T on MDA content under drought stress.
0 5 10 15 20 25 30 35 40
2 4 6 8 10 12 14
Time(day)
P
OD activity
(U/mgprot) T
CK
3.5. The Comparative Result of Field Trials
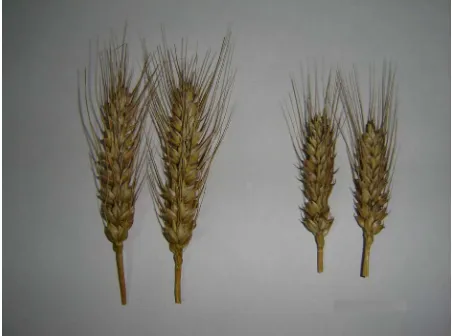
Results of field trial showed that T noticeably improved obviously the main performance indices such as tillers per plant, spikes per plant,1000 grain weight and yield (Table 3), Figure 6 also showed that ears of wheat treated by chitosan were longer ,tillers were more, kernel werefuller when comparing with CK. Tillers per plant was improved by about 2.0 grain, spikes per plant was improved by about 6.1 - 11.7 grain, 1000 grain weight increased 2.1 - 5 g, yield per ha was in- creased by 13.6%. It had indicated that the germination energy and germi-nation rate in the laboratory were consistent with the trend of increasing yield in field experiment. The results show that T can effectively increase tillers per plant, spikes per plant, 1000 grain weight and yield of wheat. Figure 2. Effect of T on POD activity under drought stress.
0 10 20 30 40 50 60 70 80 90
2 4 6 8 10 12 14
Time(day)
CAT activ
ity(U/mgprot)
T CK
3.6. Discussion
[image:4.595.62.286.445.571.2]The content of leaf water reflects the water status of plant, which is subjected to soil moisture and metabolism. Chi- tosan coating can improve the content leaf water of seed- lings. The experimental results showed that chitosan sig- nificantly or very significantly increased the concen- tration of chlorophyll compared with CK under drought stress, which illustrates chitosan can enhance the photo- synthesis performance and the accumulation of organic matter on wheat seedlings. Under the drought condition, a well developed root system absorbs more water to keep the moisture stable. Chitosan coating can reduce the in- hibition of roots and stem growth under drought stress, which shows chitosan effectively promotes the develop- Figure 3. Effect of T on CAT activity under drought stress.
0 50 100 150 200
2 4 6 8 10 12 14
Time(day)
SO
D
ac
ti
vi
ty
(U
/m
gp
ro
t)
T CK
[image:4.595.71.276.605.719.2]Table 3. Effects of T on wheat yield in the field trials.
Treatments No. of tiller (No./plant) No. of spike (No./plant) 1000 grain weight (g) Yield (103 kg/ha)
T 5.2 ± 1.2c 48.1 ± 5.5a 46.3 ± 0.3c 469.3 ± 0.025a
CK 3.8 ± 1.6 36.4 ± 5.7 42.2 ± 0.5 413.4 ± 0.024
Values are expressed as mean ± standard error. Means within a column designated with different letters are significance different at p < 0.05.
many kinds of defense reactions [21]. The experimental results showed that during the period of drought stress, chitosan significantly or very significantly reduce the content of MAD, increased the activity of COD, POD, and CAT compared with CK under drought stress. Others [22] researched influences of chitosan on rape resistance, the tests showed that chitosan could raised up the active- ties of those protection enzymes and hence to strengthen the ability of drought tolerance of plants. The ability of crops to resist drought was connected to the activities of protective enzymes SOD, POD, and CAT and their de- fensive function were closely correlated to the accumula- tion of MDA, interacting as both cause and effect [23]. Chitosan can increase the activities of COD, POD, and CAT, strengthen clearing ability of reactive oxygen spe- cies and slow down the damage degree of the plasma membrane, consequently reducing the accumulation of MDA; But in CK group, the activities of COD, POD, and CAT cannot clear the reactive oxygen in time, and their protective function was lost and the membrane injury further worsened, accumulating large MDA, which in reverse inhibited the activities of the enzymes.
0 0.1 0.2 0.3 0.4 0.5 0.6 0.7
2 4 6 8 10 12 14
Time(day)
Ch
lor
op
hyl
l
c
on
ten
t(
mg/
g)
[image:5.595.74.276.184.294.2]T CK
Figure 5. Chlorophyll content in the leaves of wheat seed-lings under drought stress.
Through the above research results and the experi- mental results, chitosan is considered to protect mem- brane system, reduce the damage of drought stress and strengthen drought resistance of plant. But it is not clear. Some studies [24-26] showed that chitosan can induce tobacco epidermal cells to produce NO and H2O2, which can induce beans to close stomatals. Stomatal closure is benefit to improve the water use efficiency, increase the transpiration resistance of leaves and resist the drought stress on plants. Lee [27] found that chitosan has the similar function with abscisic acid (ABA) as an impor- tant plant hormone, and plays an important role in plant resistance to adverse environment. The study also found that chitosan can decrease water transpiration of chilli leaves and stem, to saving water in high temperature and dry period [28]. It is not clear about the mechanism of chitosan on drought resistance needing to be studied fur- ther.
Figure 6. Contrast section photos of ears of wheat coated with C and CK. The two on the left were treated by chito- san, the two on the right were CK.
ment of root system and strengthens the capability of water absorption, so as to enhance drought resistance of wheat seedlings.
Plant produces the super oxide of free radicals and re- active oxygen species in metabolic processes, and under normal physiological conditions of plant, there is a ba- lance between production and elimination of active oxy- gen free radical. So plant does not exist any damage But in the drought stress, when a large number of active oxygen free radicals that harm the structure and function of plant cells can not be cleared timely, the balance will be destroyed, leading to the accumulation of MAD, one of the ultimate products as a result of lipid peroxidation damage by free radicals. Chitosan can recognize and transmit the signal in plant. when identified, they induced
[image:5.595.59.285.340.508.2]higher, and the content of MDA lower than that of CK. T based on chitosan was helpful to improve the seed ger- mination, seedling growth and enhances the stress resis- tance of seedlings. Further more, chitosan increased wheat yields up 13.6% than that of CK. So it had an im- portant value of application and promotion in main pro- duction zone of corn and can bring us obvious economic and environmental benefits.
4. Acknowledgements
We express the appreciation to Wuhan Science and Tech- nology Bureau of China for financial support (No. 201120922303). A special acknowledgement is given to Wuhan University of Technology for experimental con- ditions and technical support.
REFERENCES
[1] H. S. Saini and M. E. Westgate, “Reproductive Develop- ment in Grain Crops during Drought,” Advances in Agron- omy, Vol. 68, 1999, pp. 59-96.
[2] L. M. Xiong, K. S. Schumaker and J.-K. Zhu, “Cell Sig-naling during Cold, Drought, and Salt Stress,” The Plant Cell, Vol. 14, Suppl. 1, 2002, pp. S165-S183.
[3] Y.-Y. Zhang, Y. Li, T. Gao, et al., “Arabidopsis SDIRI
Enhance Drought Tolerance in Crop Plant,” Bioscience, Biotechnology, and Biochemistry, Vol. 72, No. 8, 2008, pp. 2251-2254. doi:10.1271/bbb.80286
[4] H. Campos, M. Cooper, J. E. Habben, et al., “Improving
Drought Tolerance in Maize: A View from Industry,”
Field Crops Research, Vol. 90, No. 1, 2004, pp. 19-34.
doi:10.1016/j.fcr.2004.07.003
[5] J. S. Boyer, “Plant Productivity and Environment,” Sci-ence, Vol. 218, No. 4571, pp. 443-448.
[6] S. R. S. Sabry, L. T. Smith and G. M. Smith, “Osmo- regulation in Spring Wheat under Drought and Salinity Stress,” Journal of Genetics and Breeding, Vol. 49, 1995,
pp. 55-60.
[7] M. M. Ludlow and R. C. Muchow, “A Critical Evaluation of Traits for Improving Crop Yields in Water-Limited Environments,” Advances in Agronomy, Vol. 43, 1990, pp.
107-152. doi:10.1016/S0065-2113(08)60477-0
[8] W. K. Ngetich, “Effects of Different Applied Nitrogen Rate on Yield and Plant Survival during Periods of Water Stress,” Tea, Vol. 20, 2000, pp. 61-65.
[9] S. Bautista-Banos, A. N. Hemandez-Lauzardo and M. G. Velazquez-del Valle, “Chitosan as a Potential Natural,”
Crop Protection, Vol. 2, 2006, pp. 456-459.
[10] S. L. Ruan and Q. Z. Xue, “The Influence of Chitosan on Hybrid Rice Seed and Seedling Salt Resistance,” Journal of Crop Production, Vol. 28, No. 6, 2002, pp. 803-808.
[11] G. X. Xue, F. Y. Gao, P. M. Li and Q. Zou, “Effect of Low Temperature Chitosan Processing of Cucumber Seed- lings Physiological and Biochemical Characteristics In- fluence,” Journal of Plant Physiology and Molecular
Bi-ology, Vol. 30, No. 4, 2004, pp. 444-448.
[12] W. X. Liu, X. M. Huang and X. J. Yang, “The Relief Effect of Chitosan on Mango Leaves from the Body of Osmotic Stress,” Journal of Drought Region Agric Resea,
Vol. 37, No. 4, 2004, pp. 195-197.
[13] Y. J. Shu, X. Q. Shi and Z. X. Zhan, “The Effect of Chi-tosan on Germination of Seeds and Seedlings of Cucum- ber Cold Resistance,” Seeds, Vol. 26, No. 1, 2007, pp.
22-25.
[14] P. P. Ma, “The Application of Chitin and Its Derivatives in Agricultural Production,” Journal of Plant Physiol, Vol.
26, No. 5, 2001, pp. 475-478.
[15] L. R. Ma, J. Guo and P. Liu, “The Synthesis, Charac- terization and Application of Chitosan Phosphorus De- rivatives,” Chemistry & Industry, Vol. 5, 2010, pp. 352-
358.
[16] R. L. Heath and L. Packer, “Photoperoxidation in Isolated Chloroplasts: I. Kinetics and Stoichiometry of Fatty Acid Peroxidation,” Archives of Biochemistry and Biophysics,
Vol. 125, No. 1, 1968, pp. 189-198. doi:10.1016/0003-9861(68)90654-1
[17] C. N. Giannopolitis and S. Ries, “Superoxide Dismutases: I. Occurrence in Higher Plants,” Plant Physiology, Vol.
59, No. 2, 1997, pp. 309-314.
[18] D. I. Arnon, “Copper Enzymes in Isolated Chloroplasts Polyphenoloxidase in Beta Vulgaris,” Plant Physiology,
Vol. 24, No. 1, 1949, pp. 1-15. doi:10.1104/pp.24.1.1 [19] J. M. McCord and I. Fridovich, “Superoxide Dismutase:
An Enzymatic Function for Erythrocuprein (Hemocu- prein),” The Journal of Biological Chemistry, Vol. 44, 1969, pp. 6049-6055.
[20] B. Loggini, A. Scartazza and E. Brugnoli, “Antioxidative Defense System, Pigment Composition and Photosyn- thetic Effciency in Two Wheat Cultivars Subjected to Drought,” Plant Physiology, Vol. 119, No. 3, 1999, pp.
1091-1100.
[21] U. Conrath, A. Domard and H. Kauss, “Chitosan-Elicited Synthesis of Callose and of Coumarin Derivatives in Pars- ley Cell Suspension Cultures,” Plant Cell Reports, Vol. 8,
No. 3, 1989, pp. 152-155.
[22] X. K. Zhang, Z. L. Tang, L. Zhan, et al., “Influence of
Chitosan on Induction Rapeseed Resistance,” Agricul- tural Science in China, Vol. 35, No. 3, 2002, pp. 287-290.
[23] T. D. Ge, F. G. Sui, L. P. Bai, et al., “Effects of Water Stress on the Protective Enzyme Activities and Lipid Per- oxidation in Roots and Leaves of Summer Maize,” Agri-cultural Sciences in China, Vol. 5, No. 4, 2006, pp. 291-
298. doi:10.1016/S1671-2927(06)60052-7
[24] M. Walker-Smmon and C. A. Ryan, “Proteinase Inhibitor Synthesis in Tomato Leaves,” Plant Physiology,Vol. 76,
No. 3, 1984, pp. 787-790.
[25] X. M. Zhao, X. P. She, Y. G. Du, et al., “Induction of Antiviral Resistance and stimulary Effect by Oligochito-san in Tobacco,” Pesticide Biochemistry and Physiology,
Vol. 87, No. 1, 2007, pp. 78-84. doi:10.1016/j.pestbp.2006.06.006
Relation-ship of Nitric Oxide and Hydrogen Peroxide in Light/ Dark-Regulated Stomatal Movement in Viciafaba,” Acta Botanica Sinica, Vol. 46, No. 11, 2004, pp. 1292- 1300. [27] S. Lee, H. Choi, S. Suh, et al., “Oligogalaturonic Acid
and Chitosan Reduce Stomatal Aperture by Inducing the Evolution of Reactive Oxygen Species from Guard Cells
of Tomato and Commelina Communis,” Plant Physiology, Vol. 121, 1999, pp. 147-152.
[28] M. Bittelli, M. Flury, G. S. Campbell, et al., “Reduction
of Transpiration through Foliar Application of Chitosan,”
Agricultural and Forest Meteorology, Vol. 107, No. 3,