A thesis submitted in
partial fulfilment of
the requirements for the
Degree of
Master of Science in Zoology
by
RICHARD F. MALONEY -?
University of Canterbury
THES\S
n ••• the birds never seemed to realise their danger ... we may infer what havoc the
introduction of any new beast of prey must cause in a country, before the instincts of the indigenous inhabitants have become adapted to the stranger's craft or power."
Charles Darwin, Voyage of the Beagle, 1845
n •••
if
only the bird knew its powers, it wouldn't fall such easy prey to stoats ... but he has no idea of attack or defence."/
Abstract. ... 1
CHAPTER 1: General Introduction ... 2
Study animal. ... : ... 10
Study site ... 10
General Methods ... 12
CHAPTER 2: Enemy recognition and response in robins Introduction ... 17
Methods ... 19
Results ... 22
Discussion ... 30
CHAPTER 3: Enhancement of robin nest-defence behaviours by training Introduction ... 33
Methods ... 34
Results ... 40
Discussion ... 60
CHAPTER 4: Cultural transfer of nest-defence behaviours between generations Introduction ... 63
Methods ... 65
Results ... 66
Discussion ... 71
CHAPTER 5: Variation in nest-defence response due to context factors Introduction ... 72
Methods ... 73
Results ... 74
Discussion ... 77
CHAPTER 6: General Discussion ... 78
Acknowledgements ... 82
Literature Cited ... 84
LIST OF FIGURES
F~re ~~
1.1 Theoretical models of enemy recognition and response in 6 birds. A) The Predatory Imminence Continuum (PIC) model,
after Fanselow & Lester (1988). B) A simple model of
enemy recognition and response, after McLean & Rhodes (1991).
1.2 Location of Motuara Island (M), Allports Island (A) in 11 Marlborough Sounds, and Kowhai Bush (K), Kaikoura, in
South Island, New Zealand.
2.1 The stoat mounts and boxes used as enemy stimuli in this study. 20 2.2 Mean (±se) response intensity score per trial by robins 24
towards stoat and box on Motuara Island (N =30) and on the mainland (N = 14).
2.3 Mean (±se) number of flights, wing flicks and hops per 26 trial by robins presented with the stoat and box, on Motuara
Island (N=30) and on the mainland (N=14).
2.4 Mean (±se) time between feeds of the chicks per trial by 27 robins presented with the stoat and box, on Motuara Island
(N =30) and on the mainland (N
=
14).2.5 Frequency of stoat and box stimulus presentations during which 28 robins gave A) wing droop displays, B) frontal spot displays,
C) bill wiped, D) raised crown feathers, or E) alarm called or gave body displays, on Motuara Island (N =30) and on the mainland (N=14).
2.6 Mean (±se) closest approach distance by robins to the stoat and 29 box per trial, on Motuara Island (N =30) and on the
mainland (N = 14).
3.1 Training regimes used in this study, showing the mobbing bird 35 mount, the stoat, and the speaker (partially hidden by litter
directly behind the bird mount).
3.2 The three principal mounts used in this study. Mounts are A) 37 robin in wing droop mobbing display, B) stoat model with robin
in its mouth, C) blackbird in mobbing posture.
3.3 Mean (±se) response intensity score per trial by robins presented 41 with the stoat at their nests one day after being trained,
by robins presented with the stoat at their nests one day after being trained (N = 20 per regime).
3.5 Mean (±se) time in view of the stoat per trial by robins 45 presented with the stoat at their nests one day after being
trained (N =20 per regime).
3.6 Mean (±se) total time off the nest and total time off the 46 nest after seeing the stoat for trials where robins were
presented with the stoat at their nests one day after being trained (N =20 per regime).
3.7 Frequency of trials in which robins gave body displays or 47 alarm called when presented with the stoat at their nests one
day after being trained (N =20 per regime).
3.8 Mean (±se) time on and off the nest before (natural) and 48 immediately after (post-trial) the stoat presentation, for
trials where robins were presented with the stoat at their nests one day after being trained (N =20 per regime).
3.9 Mean (±se) closest approach distance by robins to the stoat, 49 for trials where robins were presented with the stoat at their
nests one day after being trained (N =20 per regime).
3.10 Mean (±se) number of flights, wing flicks and hops per trial by 51 robins during training (N =20 per regime).
3.11 Frequency of trials in which male and female robins gave body 52 displays or alarm called during training (N =20 per regime).
3.12 Mean (±se) closest approach distance per trial of male and 53 female robins to the stoat during training (N =20 per regime).
3.13 Mean (±se) time in view of the stoat per trial, of male and 54 female robins during training (N
=
20 per regime).3.14 Mean (±se) number of flights, wing flicks and hops per trial 56 by robins during training (N =20 per regime).
3.15 Mean (±se) time in view (A) and mean (±se) distance (B) from 57 the stoat by robins during training (N =20 per regime).
3.16 Frequency of trials in which robins gave body displays or 58 alarm called during training (N =20 per regime).
4.2 Body movement responses of fledgling and adult robins to 69 the stoat presented at their nests.
LIST OF TABLES
Table Page
1.1 Definition of measurements of behaviours, times and 13 distance used throughout this study.
1.2 Response intensity score for robin behaviours, times 16 and distance measures.
2.1 Total number of stoat and box trials completed and 22 the number of trials that (i) males and females, (ii)
only males and, (iii) only females were present; on Motuara Island and at Kowhai Bush.
2.2 Statistical comparisons of the response of robins towards 25 the stoat (S) and the box (B) on Motuara Island (M) and
at Kowhai Bush (K).
3.1 Description of the training regimes used and the stimulus 39 presented at the nest on Day 3.
3.2 Differences among training regimes in response of robins to 42 the stoat presented outside the nest the day after training.
3.3 Statistical results for differences in response of male and 50 female robins during training events.
3.4 Differences among training regimes during training using 55 the average male and female response values.
3.5 Correlation coefficients for the response of robins during 59 training events with response of females one day after
training.
4.1 Response of robins TRAINED or UNTRAINED as 70
fledglings and tested one year later as breeding adults, compared to mean (± se) responses of adult robins trained (ROBMOB, N =20) or untrained (NOTRAIN, N =20).
5.1 Stimulus type, locality and nest-contents at the time of 75 stimulus presentation, and the previous training of robins.
5.2 Regression and correlation Rand p-values for each of the 76 eight nest- and robin-related variables with intensity
Appendix 1
2
3
4
5
6
Techniques used to find robins in this study.
Techniques used to catch and band robins in this study.
Colour-band combinations, the sex and age of robins and the stimulus presentation and training each bird received.
Statistical results and means, for Motuara Island and Kowhai Bush robin body movements during stoat and box trials.
Comparisons were between (A) one bird present at a trial with the mean response where two birds were present; (B) trials where the stimulus was presented first compared to second; (C) males and females where two birds were present in a trial.
Unpublished report to the Department of Conservation on the visit to Allports and Motuara Islands, 1989.
Unpublished report to the Department of Conservation on the visit to Motuara and Long Islands, 1990.
Page 93
94
95
98
100
1
ABSTRACT
The ability of robins, Petroica australis, to recognise and learn about a
mammalian predator (stoat, Mustela erminea) was studied during the 1989 and 1990 robin breeding seasons, on Motuara Island (no stoats present) and at Kowhai Bush, Kaikoura (stoats present).
I quantified the natural nest-defence responses of robins towards the stoat and a non-threatening control (a bOx) in both study areas. In the mainland population, all behaviours measured were given at greater rates by robins faced with the stoat compared to the box. In contrast, island robins responded about equally to the stoat and box, and at a level that was similar to the responses of mainland robins towards the box. These results suggest that mainland robins have learned to recognise and respond to stoats as enemies, and that the low nest-defence responses of the inexperienced robins may be typical of the responses of New Zealand endemic birds prior to the arrival of mammalian predators.
I trained robins on Motuara Island to respond to a stoat as an enemy using an artificial training technique, and tested their response one day later. All robins trained using conspecific training regimes gave nest-defence responses to the stoat at a level significantly higher than robins either not trained, or trained using an interspecific regime. Training using robin mounts and alarm calls, or just robin alarm calls resulted in the highest learned response, whereas training using distress calls resulted in an intermediate learned response. These results indicate that artificial training of birds in field situations may be an effective way to improve enemy recognition ability and enhance nest-defence responses.
I attempted to test the ability of robins to transfer nest-defence behaviours between generations by cultural transmission, but survival of robins was very low between seasons and insufficient data were collected to answer this question.
CHAPTER 1
GENERAL INTRODUCTION
In many species of animal, parents use a variety of techniques to protect their young from predators and thereby increase the offsprings' chance of survival (Edmunds 1974, Morse 1980, Alcock 1984). Protection may include behaviours of the parent which prevent detection (eg. crypsis) or capture of offspring (eg.
distracting, mobbing or attacking a predator). Such behaviours will be more
effective if the parent is able to recognise the predator, as less time and energy will be wasted by the parent responding to non-threatening animals, or giving
inappropriate responses to threatening animals. Many studies have found evidence that animals are able to recognise predators (eg. in birds, Altmann 1956, Armstrong 1954, Caldwell & Rubinoff 1983, Curio 1975, Klump & Shalter 1984, Nice &
Pelkwyk 1941, Smith et al. 1984; in mammals, Hauser 1988, Hirsch & Bones 1980, Robinson 1980, Seyfarth & Cheney 1990), and it is likely that the ability to
recognise predators is a general phenomena among the higher vertebrates.
In some species, effective nest-defence responses are given to a novel predator on the first encounter, indicating that the ability to recognise predators may be genetically inherited (Curio 1975, Hobson et al. 1988, Mueller & Parker 1980, Owings & Coss 1977, Riechert & Hedrick 1990), whereas in others, recognition of predators may be learned (Coleman 1987, Conover 1987, Curio et al. 1978a, 1978b,
Hauser 1988, Klopfer 1957, Knight 1984, Pugesek 1983, Regelmann & Curio 1983, Thornhill 1989, Vieth et al. 1980). It may be that inheritance of predator
recognition involves a mix of genetic and cultural processes, where an animal is genetically predisposed to learn defence responses. This association between genetic and cultural heritability ("gene-culture transmission", Lumsden et al. 1981),
has recently been modelled by Findlay (1991). Findlay (1991) derives a general theorem of natural selection based on genetic and cultural transmission and
suggests that traditional, purely genetic models (eg. Fisher 1930) are a special case of gene-culture transmission.
3
behavioural strategies of many animals. In birds one such strategy, nest-defence behaviour, is particularly well-developed and appears to function as a response to protect a parents' nest and nest-contents against predation, although alternative functional hypotheses have been suggested (eg. as an advertisement of male quality, Regelmann & Curio 1986, see Curio 1978 for hypotheses).
I define nest-defence behaviour as "any behaviour that decreases the probability of a predator harming the nest or its contents while increasing the probability of harm to the parent". This definition is broader than that of Montgomerie &
Weatherhead (1988, p.190) and includes harm to the nest itself, since effective defence of the nest structure may have significant time and energy cost savings. Non-costly nest-defence behaviours (eg. choosing a cryptic nest-site) are not included in this definition; a parent may perform non-costly behaviours without necessarily recognising, or having direct contact with the predator.
Nest-defence behaviours are risky to perform, with an increased chance of injury when attacking or distracting a predator (Brunton 1986, Curio & Regelmann 1986, Denson 1979, England 1986, Hammerstrom 1957, Myers 1978, Pettingill 1976, Poiani & Yorke 1989, Walker 1983, but see Hennessy 1986). However, evidence of risk of injury to the parent during defence does not necessarily show that nest-defence has benefits in terms of increased offspring survival. This link is now clearly established, with a correlation between strong nest-defence responses and increased nest success having been found for many birds (eg. Andersson & Wiklund 1978, Andersson et al. 1980, Blancher & Robertson 1982, Buitron 1983, Byrkjedal 1987, Gottfried 1979, Greig-Smith 1980, Knight & Temple 1986a, Murphy 1983, Nichols et al. 1984, Pettifor 1990, Temrin & Jakobsson 1988, and see review in Montgomerie & Weatherhead 1988); although some studies have found no such correlation (eg. Smith et al. 1984).
Recognition of and response to predators by birds is clearly a complex
behavioural process, with species having differing abilities at distinguishing among predator types, and also having different (and dynamic) responses (eg. Chandler &
optimality~based theory, Trivers 1972; see Montgomerie & Weatherhead 1988, Redondo 1989 for reviews of theoretical models and evidence). In this theory, the pattern of nest~defence responses over a breeding cycle is predicted to be
dependent on the parents future gain in reproductive fitness, which is most often measured as the time to offspring independence. Therefore, the intensity of
defence by the parent increases as offspring grow older, as the expectation of future benefit to the parent increases while the cost of defence remains relatively constant. The pattern may also vary as future costs of raising offspring decrease, or as the difference between the cost of raising the current brood increases relative to future broods.
Evidence in support of the parental investment hypothesis is limited, with the pattern of nest-defence intensity not consistently fitting the predicted pattern in many birds (see McLean & Rhodes 1991), although in some studies the theoretical predictions about pattern of nest-defence intensity were supported (see Redondo 1989). Methodological problems with stimulus (ie. potential enemy or
non-threatening object) presentation techniques, where the same stimulus is presented several times at one nest causing reinforced or habituated responses, may have contributed to differences in response intensity and pattern in some studies (Knight & Temple 1986b).
Studies that did not find evidence to support parental investment theory often suggest that the pattern of nest-defence response was hidden by variation in response intensity due to the context of the predator-defender interaction (eg. Hobson et al. 1988). Context-variables known to influence the intensity of
nest-defence include variability resulting -from differences inherent to the bird, nest or predator. These variables are reviewed by Montgomerie & Weatherhead 1988 and Redondo 1989 (and see Chapter 5).
5
danger of being injured during the encounter.
There are several general models which illustrate possible pathways through
which the information received from the stimulus is processed (eg. Dorner 1982,
Klix 1982, Ltier 1982, Markl 1985, Smith 1977, Toates 1983). These models
generally follow a similar pattern of information-processing where, first, an image is
perceived by sensory receptors, then processed, stored, and possibly matched to
previously stored images. Next, decisions on suitable responses (which may be
innately programmed) are made and the response is actioned. Finally, the modified
situation brought about by the response is monitored (eg. see Smith 1977). Most
variation among the theoretical models is in the degree of innate compared to
learned input in the image processing, and in the presence of possible feed-back
loops or guides which modify the recognition and response decision-making process
along the information-processing pathway (eg. see Dawkins & Krebs 1978).
Two recent theoretical models provide outlines of possible cognitive pathways
that prey may use in behavioural interactions with predators.
First, in the Predatory Imminence Continuum model (PIC, Fig 1.1a), the
intensity and type of defence response given by the prey is viewed as being
positively related to the distance (physical and psychological) from an approaching
predator (Fanselow & Lester 1988). "Prey", as described in Fig 1.1a, applies to the parent bird as the actor, but for nesting birds that are protecting offspring the
model may be broadened to incorporate relationships such as between parents (the
defenders) and young (the direct beneficiary of the parent's behaviour). In the PIC
model the parent "prefers" to remain at a point where it is safest from predation,
and at this point it displays "non-adversively motivated behaviours" (eg. normal
feeding activities). Before the prey has encountered the predator, the parent may
also adopt what Fanselow & Lester term "pre-encounter defensive behaviours".
These are actions that enable the parent to avoid future contact with the predator
(eg. nesting in concealed or inaccessible sites). After encountering the predator,
the parent must adopt new strategies which are designed to return the parent to its
preferred motivation state. The strategies illustrated by Fanselow & Lester were,
for example, freeze, hide or run responses of prey, which reduced the risk of
B Z ("") ::0 rn >-(f) Z G) -u ::0 rn 0 >-~ 0 ::0 -< §E 3: Z rn :z: (") rn
NO PREDATORY POTENTIAL
Prefered activity -<---, Pattern of nonadverslvely
motivated behaviours
1
1
PREDATORY POTENTIAL PRE-ENCOUNTER DEFENSIVE BEHAVIOUR
1
1
PREDATOR DETECTED POST-ENCOUNTER DEFENSIVE BEHAVIOUR
1
1
PREDATOR Circa-strike
MAKES CONTACT defensive behaviour
1
1
PREDATOR Point of no return MAKES KILL
STIMULUS
~
PERCEPTUAL REPRESENT A TION
~
STORED REPRESENT A TION
~
SEMANTIC ASSOCIATION
~
THREAT APPRAISAL
~
GENERATE POSSIBLE RESPONSES
~
RISK ASSESSMENT
~ ~ , , ) I I I ,) Recuperative behaviour .-- .-- .-- .-- .-- _ . . . /
RESPONSE SELECTION MOTIVATION
~
RESPONSE
Figure 1.1: Theoretical models of enemy recognition and response in birds. A) The Predatory Imminence Continuum (PIC) model, after Fanselow & Lester (1988). B) A simple model of enemy recognition and response, after McLean &
[image:13.595.61.511.73.686.2]Nest-defence behaviours (which may include attacking or distracting the predator) may be considered appropriate strategies at this stage if the offspring in the nest are at imminent risk of injury, and given that running and hiding are not options for altricial young.
The PIC model provides an important theoretical base for developing predictions about the response of birds towards an enemy stimulus. The model predicts that defence responses are designed to allow a bird to return as quickly as possible (or with minimal injury) to a preferred motivational state. Thus level and type of response are directly determined by the imminence of attack from the predator.
7
The second theoretical model, the cognitive model of enemy recognition (McLean & Rhodes 1991, Fig 1.lb), provides more detail on a decision-making pathway that may be used to generate appropriate and modifiable prey responses towards an enemy stimulus. In this model, the stimulus (predator) is perceived (eg. visually, audibly) and this image is matched with stored images in a recognition process. Importantly, this model also includes both assessment of, and feedback from, the predator, acknowledging that intensity of response towards a predator may be context-specific and involves a dynamic process of action, observation, assessment and reaction. In birds where recognition is innate, the stored representation in Fig 1.lb is genetically inherited, whereas in species where
recognition is learned, the stored representation may require development and fine-tuning, gained through experience with the predator.
Most studies of recognition and response of birds to enemies have been
attempt to do so (eg. Coss & Owings 1978, Curio 1975, Hobson et al. 1988).
Birds endemic to remote island groups may be more suitable subjects for measuring the nest-defence responses given towards novel enemies. In an island group such as New Zealand, there has been a long historical isolation of many endemic birds from one important enemy group, the predatory mammals (Atkinson 1985, Holdaway 1989, King 1984). These birds almost certainly have no past
experience with any of the predatory mammals and therefore a mammalian predator is a novel stimulus at the taxon level. Mammalian predators have been introduced to some parts of New Zealand in the past 1000 years, with the most recent introductions being about 100 years ago (Atkinson 1973, 1985, King 1984). Thus, in New Zealand there are sympatric populations of conspecific birds that I predict may have a similar level of genetic recognition ability of predators, but have different abilities in recognising and responding to predators, due to differences in the birds recent experiences with mammalian predators.
This prediction has been quantitatively tested once previously. McLean & Maloney (1989, in prep) compared the behavioural responses of naive island and experienced mainland populations of endemic tits, Petroica macrocephala, towards avian enemies. They found that the experienced population responded to the avian enemies more intensely than did the naive population, whose response to the
enemies was weak and confused. McLean & Maloney concluded that the
difference in response intensity between the populations was most likely due to the recent experiences of the mainland tits with avian enemies. However, no study has quantitatively tested whether naive or experienced populations of New Zealand endemic birds can recognise or respond appropriately towards mammalian predators.
Similarly, no study has examined the importance of learning in determining recognition and response abilities of New Zealand birds towards mammalian predators. If wild populations of endemic New Zealand birds can learn to
recognise and respond effectively to predators, then by providing naive birds with artificial experiences of nest-defence responses, it should be possible to teach them appropriate enemy recognition and response abilities.
9
recognise a mammalian predator as an enemy, then I predict that these learned defence behaviours may be transferred between generations by cultural rather than genetic means.
Aims
In this thesis I aim to test the predictions that:
1) Endemic New Zealand birds that have experience with mammalian predators respond more intensely to a mammalian predator than naive bird populations. 2) Artificial training will enhance nest-defence responses of birds towards mammalian predators.
3) The transfer of learned nest-defence responses may be achieved by cultural transmission.
Specifically, in Chapter 2, I examine the role of genetic and experience
components of enemy recognition used by an endemic New Zealand bird, the robin,
Petroica australis, in its nest-defence responses against a predator, the stoat, Mustela enmnea.
In Chapter 3, I test the ability of robins to learn nest-defence response behaviours by experiencing appropriate but artificial mobbing events, between a conspecific and a stoat.
In Chapter 4, I examine the possible role of cultural transmission in the transfer of enemy recognition and nest-defence response skills between robin generations.
STUDY ANIMAL, STUDY SITES AND GENERAL METHODS
Study animal
The South Island robin is a medium sized (30-40g) insectivorous passerine, patchily distributed at moderate to low densities throughout South Island but in higher densities (up to 2.8pr/ha) on a few offshore islands. Robins form highly stable life-long pair bonds, are strongly territorial year round and lay one to four clutches per year. The cup-shaped nest is sited 0.lm-15m above ground level, typically in primary tree forks, fern crowns, large tree-trunk cavities or in the canopy. Only the female builds the nest and incubates the eggs, while the male provisions her. Both birds feed chicks and fledglings (Flack 1975, 1985, Fleming 1950,Oliver 1930, Powles land 1980, unpubl. data).
Study sites
This study was conducted on two islands in Marlborough Sounds (AIlports Island, 174°03'E, 41°14'S; Motuara Island 174°16'E, 41°06'S) and at one South Island mainland site (Kowhai Bush, 173°37'E, 420
23'8; Fig 1.2). Robins occur naturally at Kowhai Bush, but the island populations were established after 1973, when two pairs were transferred from Inner Chetwode Island (174004'E, 40054'S) to Motuara
Island, and from Kowhai Bush to AIlports Island (Flack 1974, 1977, Flack & Lloyd 1978). AIl study sites are floristically very similar. Forest composition and
structure is relatively simple with kanuka, Kunzea ericoides, being the dominant tree
species (Flack & Lloyd 1978, Hunt & Gill 1979, Walls 1983, unpubl. data). The avian fauna of the island sites is dominated by two species. These are robins and bellbirds, Anthomis melanura, on Motuara Island and robins on AIlports
Island. There is a greater diversity of native and introduced passerines at Kowhai Bush (Hunt & Gill 1979, Walls 1983, unpubl. data).
The most noticeable difference between sites is in the diversity of mammalian predators in each area. The only carnivorous mammals present on the islands (mice, Mus musculus, on AIlports Island and kiore, Rattus exulans, on Motuara
N
+
South Island
New Zealand
MOTUARA AND ALLPORTS ISLANDS
.
"(
.
.
' ,,
... ... \ \ ,
... " .... , (
'--~ t ( " . ' ... ""',
Mountains:
~ - ' -' , \ ' , :
•. ,.. .. t, .
... \ 1_", : .... I •
.
.
. Farm flats
Pacific ocean
. ,
KOWHAI BUSH
o
Scale 10kmFigure 1.2: Location of Motuara Island (M), Allports Island (A) in Marlborough _. Sounds, and Kowhai Bush (K), Kaikoura, in South Island, New Zealand.
[image:18.595.63.524.41.636.2]Kiore are the only mammal present on Chetwode Islands, the source island group for robins on Motuara Island. As far as is known, none of the other
predatory mammals have ever established on these islands (R. Taylor pers. comm.). In comparison, Kowhai Bush has all of New Zealand's introduced predatory
mammals except kiore; being stoats, ferrets, Mustela Jura, weasels, M. nivalis, mice, Norway and ship rats (Rattus narvegicus and R. rattus, respectively) feral cats, Felis catus and hedgehogs, Erinaceus eurapaeus (Moors 1979, 1983).
Predation rates on robin nests are low on Motuara Island (26% average over 1973-75, 18% in 1989, 8% in 1990), low on Allports Island (13% average 1973-75, 4% in 1989) but are high at Kowhai Bush (55% average over 1971-76, all
percentages from Flack & Lloyd 1978, unpubl. data).
General methods
Experiments at nests involved placing the stimulus (the stoat or the box) 1-I.5m from active robin nests. All robins were individually identifiable at the time of the experiment, either behaviourally, by mate or territory fidelity, or with individually-coded coloured leg bands. Appendices 1 and 2 describe the methods used for 1) finding nests and, 2) banding robins, and Appendix 3 details a list of banded robins and the experimental test each robin received.
Experiment design and data collection
To improve observer reliability in identifying and quantifying differences in robin behaviour, I spent 18 days at the beginning of this study on Allports Island, where I identified and became familiar with behavioural responses of robins
towards the stimulus, finalized test procedures, and practiced and standardized test methods. None of these robins were used in further experiments.
Table 1.1: Definition of measurements of behaviours, times and distance used throughout this study, and the source of previously described behaviours.
Behaviour or action of robin Body movements
Description of behaviour
flights Movements > one body length hops ,Movements < one body length wing flicks Rapid opening and closing of
closing of both wings when perched Calls
Body displays head
feather displays wing droop display
Number and type of alarm and distress calls
(a) display of frontal spot
(b) display of raised head feathers
Full distraction <#splay
Distances from >2m to nearest O.5m stimulus (m) <2m to nearest O.lm Time Intervals (secs)
time in view of Preset to 5 min maximum stimulus
natural times
test times
post-test times
Time between approaches to the nest prior to tests
Time between approaches to the nest during tests
Time between approaches to the nest after tests finished
Source
Hay 1975
Flack 1976 &
Powlesland 1980
Powlesland 1980
Natural approaches to the nest
I recorded behaviours and times (see Table 1.1) of parents returning to their nests prior to starting all tests. These data were used as a measure of baseline response levels and were compared to nest-approach data recorded during
experimental trials. At least three natural approaches were observed for incubating females and four to nine approaches were recorded at nests containing chicks. Natural approach data were collected immediately after finding the nest, in the intervening days between when a nest was found and the first trial, or immediately prior to a sequence of trials.
I considered that a 'nest approach' began from when the robin ceased foraging and headed towards the nest. If I could not see a bird until it was flying towards the nest, then I considered that the approach began from where I first sighted the bird.
On all occasions that I made observations near robin nests, I sat 5-15m from the nest tree and I minimised my movement and disturbance of litter.
Presentation of stimuli
The stimuli (the stoat and box) were presented at nests of pairs of robins with chicks (Chapter 2) and the stoat was presented at nests of female robins with eggs (Chapters 3 & 4), using the following method:
(i) A string was thrown over a branch higher than the nest position, 1-1.5m from the nest rim and tied to form a continuous loop. The loop was positioned so that the stoat or the box attached across it faced the nest rim.
(ii) The stoat or box was attached to the strings and raised into view when the parents were away feeding, except when the nest was obscured from view (eg. high in the canopy). In this case the stoat or the box was attached to the strings at ground level and covered while the parent was still at the nest.
15 immediately attracted the bird's attention.
Response intensity score
Each behavioural variable was analysed separately, and I also developed a score measuring overall intensity of nest-defence response at each nest, using a subjective 0-2 scale. Eight of the behaviour, time and distance variables (Table 1.1) were scored using ranking criteria based on level of risk to the actor, degree of
dissimilarity from normal feeding movements and behaviours, and comparison with observed responses of robins to real mammalian predators (Flack 1976, Hay 1975, Powlesland 1980, Soper 1972, unpubl. data).
Level of risk was assumed to increase greatly as an actor: (i) approached the stimulus, (ii) went to the nest while in view of the stimulus, or (iii) behaved in a manner which increased an actors conspicuousness (eg. alarm calling, some body displays, see Curio & Regelmann 1986). Therefore, trials where these actions occurred scored more highly than did trials where a bird exhibited actions more similar to feeding and general activity movements.
Table 1.2: Response intensity score for. robin behaviours, times and distance measures. Descriptions of behaviours as for Table 1.1. See text for details of the criteria used for ranking behaviours.
Behaviour or action of robin Number of: -flights -wing flicks -hops
Goes to nest Minimum approach distance Alarm calls Head feather displays Wing droop display Intensity Score
o
s average for
natural approach
within first 1 minute >lm No No No 1
> 1 but s2 times natural
approach
after 1 minute but before test was over (Smin)
O.S-lm Once Once Once 2 >2 times natural approach
after test was over (>Smin)
<O.Sm
>1
>1
17
CHAPTER 2
Enemy recognition and response in robins
New Zealand has been free of many of the world's major predator groups for most of its geological history. The absence of ground-hunting predators such as mammals and snakes allowed many birds (the dominant vertebrate taxon) to occupy niches filled elsewhere by mammals (eg. Holdaway 1989, King 1984). The first terrestrial predatory mammals to arrive were the kiore, Rattus exulans, and kuri,
Canis familiaris, brought by early Polynesian colonists about 1000 years ago.
Although kuri probably did not range far from human habitation, it is thought that kiore quickly spread throughout New Zealand (Atkinson 1985, Holdaway 1989).
From Polynesian colonization to the time Europeans arrived in New Zealand in 1770, approximately 36 (22%) species of bird became extinct. Europeans
introduced two other rat species (the Norway rat, R. nOlvegicus, and the ship rat, R.
rattus), the feral cat, Felis catus, and three mustelids (stoats, Mustela erminea,
weasels, M nivalis, and ferrets, M Juro). In association with massive habitat destruction, these introductions added to the decline of the New Zealand avifauna (10 additional species became extinct, Holdaway 1989).
Predation prior to the arrival of mammals was by aerial predators, and in the absence of mammalian enemies many endemic New Zealand birds developed flightless and ground-living habits (see Pomeroy 1990 for an hypothesised function of flight to escape predators). With these characteristics and with probably weak behavioural defences, many species were unable to cope with the invasion of predatory mammals (Holdaway 1989, McDowall 1969, Williams 1962).
that endemic species were not more susceptible to predation than were introduced species. However, Moors did not control for selection due to bird-predator
interactions since the mammal introductions and, therefore, this study does not necessarily measure the susceptibility of endemic species to predation at the time of the mammalian introductions.
Today, several populations of endemic birds continue to live in isolation from mammalian predators (eg. on remote offshore islands such as the Snares Islands). Thus, the responses of completely naive birds towards mammalian predators can still be quantified and, in some instances, compared with responses given by conspecific populations coexisting with mammalian predators. However, no study has recorded the behaviour of endemic New Zealand birds towards any of the introduced mammalian predators prior to contact with that predator, although behavioural responses of naive and experienced tits, Petroica macrocephala, towards two avian enemies, the little owl, Athene noctua, and long-tailed cuckoo, Eudynamys taitensis, has been studied (McLean & Maloney 1989, & in prep). McLean & Maloney (1989) found that naive tits on the isolated Snares Islands responded in a weak and confused manner towards potentially threatening owl and cuckoo mounts compared to a non-threatening control stimulus, whereas experienced tit
populations in mainland New Zealand responded strongly and directed nest-defence behaviours only towards the enemy stimuli.
That study provided important background information on the possible behavioural effects of temporal or spatial separation of birds from their enemies. Because of the New Zealand avifauna's long historical isolation from mammalian predators, I predict that birds would not have recognised mammalian predators as a threat during the initial period of contact. The aim of this chapter is to provide the first quantitative test of this prediction.
Specifically, I examine enemy recognition and nest-defence response in
mammal-naive and mammal-experienced populations of an endemic New Zealand passerine, the robin, Petroica australis, towards an introduced mammalian predator, the stoat.
As a second aim I examine within population differences in nest-defence
19
METHODS
General methods
A taxidermic mount of a mammalian predator (a stoat) and a non-predatory stoat-sized control (a cardboard box) were used in all tests of robin nest-defence responses, during the 1989-90 and 1990-91 robin breeding seasons on Motuara Island and at Kowhai Bush, K~ikoura. Each test consisted of two trials at one nest. A trial involved the presentation of a stimulus (the stoat or the box) at a nest, with the order of stimulus presentation randomly chosen for the first test and alternated thereafter.
The stoat mount was used to elicit robin nest-defence responses. Mounts of animals are frequently used in place of live predators and they represent a realistic and constant stimulus in all presentations (see Curio 1975). The box was used as a control for the stoat by providing a measure of response to any object placed near the nest.
Two observers carried out the tests using different stoats and boxes as robin breeding times overlapped between the study sites. I completed all 30 Motuara Island trials and eight of the Kowhai Bush trials. The remaining six Kowhai Bush trials were completed by Dr LG. McLean following specific guidelines set by me. Dr McLean had observed similar trials on Allports and Motuara Islands in 1989 and was familiar with robin behaviour and my experimental procedure. All presentation strings (Chapter 1) were positioned by me.
Construction of stimuli
21
Experimental procedure
Tests were carried out on robins at nests with 5-20 day old chicks, at any time of the day. Observations and trials at the same nest on different days were made during the same part of the day, with the interval between trials as near to 24 hours as possible. Robins used in this experiment had not been used in any other
experiment.
Tests were conducted as follows:
Day One: Four to nine natural approaches to the nest of the test pair were recorded before attachment strings were placed in position (see Chapter 1). Day Two: To allow the birds to become used to my presence, I quietly observed 1-3
feeding approaches to the nest by the test pair. When both birds were out of sight, I attached the first stimulus (the stoat or the box) to the strings and positioned it by the nest (as described in Chapter 1). A timed 5 min trial period began when either parent returned to the area and reacted to the
presence of the stimulus (reaction to the stimulus was deemed to have occurred if the robin abruptly veered off its nest-approach flight path, or stopped and orientated towards the stimulus). For the duration of each trial period the movements and behaviours (Table 1.1) of the birds were spoken into a hand-held cassette tape-recorder (Sanyo MI00lA). The stimulus was then removed and behaviours and times during the post-trial approach to the nest were noted. Day Three: The second stimulus was presented in the same manner as on Day Two
and robin nest-defence responses were recorded.
Comparisons
I used the overall intensity score and individual behaviour, times and distance measures (Table 1.1) to compare robin nest-defence responses towards the stoat and the box. Because of differences between each trial in the number and sex of robins present and because presentation order of stimuli was alternated, I
( a) and pooled da ta for (b) and (c).
Comparisons were then made between trials in:
1) response towards enemy and control stimuli within each study area and; 2) response towards enemy and control stimuli between study areas.
Analyses
Wilcoxon Sign Rank tests were used for paired data comparisons within each study area, Mann-Whitney U tests for unpaired comparisons between study areas and Chi-square tests for analysis of data on body displays and calls. Where one datum of a paired measurement was missing, that pair was excluded from the analysis.
RESULTS
Nest-defence responses of robins were measured at 30 nests on Motuara Island and 14 nests at Kowhai Bush. The number and sex of robins present at each trial is given in Table 2.1.
Table 2.1: Total number of stoat and box trials completed and the number of trials that (i) males and females, (ii) only males and, (iii) only females were present; at Kowhai Bush and on Motuara Island.
Location and d'&!? Only Only Total
trial type both d' !f number
present present present of trials
Kowhai Bush
Stoat Trials 11 0 3 14
Box Trials 8 2 4 14
Motuara Island
Stoat Trials 16 7 7 30
[image:29.595.76.515.505.750.2]Ujp,l,.""..,. ... ",<;! in response of robins due to number of birds present, sex of
stimuli presentation order
Responses to each stimulus when two birds were present were not significantly different from two times the response level when one bird was present (Appendix 4a). Therefore, in all further analyses, I use the average response towards each stimulus for comparisons between trials where more than one bird was present.
There were no significant differences in response toward the stoat or box due to the sex of the robin present at each trial or due to the order of stimulus
presentation, either on Motuara Island or at Kowhai Bush (Appendix 4b & c). Sex of the responding bird and order of presentation of the stimuli are not considered in further data analyses.
Analyses of the response of robins towards enemy and control stimuli Results of all statistical tests are presented in Table 2.2.
intensity score
The average response intensity scores of robins to the stoat and the box in each study area are shown in Fig 2.2.
The response intensity scores for robins on Motuara Island (M) given towards the stoat (S) compared to the box (B) were not significantly different (ie. MS=MB). Nor was the response intensity of robins at Kowhai Bush (K) towards the box significantly different from either trial on Motuara Island (ie. KB=MB=MS). However, the response score given by robins at Kowhai Bush towards the stoat was significantly higher than Kowhai Bush box trials and Motuara Island stoat and box trials (ie. KS>KB=MB=MS).
Separate analysis of behavioural variables
12
**
.--.
0
Box<D
lSI Stoat
en
10
-H
IX
...-<D 8
L-0
() 6
en
>-4
+-'
en
C
<D 2
of-"
c
0
Island Mainland
[image:31.595.92.504.73.342.2]Table 2.2: Statistical comparisons of the response of robins towards the stoat (S) and the box (B) on Motuara Island (M) and at Kowhai Bush (K).
Stoat v Box#
MS KS
Variable v v
measured MB KB
Intensity
score NS 0.002
Flights NS 0.047
Wing flicks NS 0.003
Hops NS 0.003
Closest
approach NS NS
Total time
between NS 0.019
feeds
Time off nest after seeing
stimulus NS 0.037
Time to
post-trial feed NS NS
Body displays+ X2 df
18.7 3
# = Wilcoxon Sign Rank tests ## = Mann-Whitney U tests + = Chi-square test
Motuara Island v Kowhai Bush##
MS MB MS MB
v v v v
KB KB KS
<0.001 NS NS <0.001
0.012 NS NS 0.003
0.009 NS NS 0.003
0.008 NS NS 0.001
NS NS 0.039 NS
0.011 NS NS NS
0.005 0.023 NS 0.023
NS NS NS
p Difference
<0.001 KS>MS=MB=KB
[image:32.594.67.519.106.623.2]36
30
24
«l L..
... 18
...
L-<D 12
...a
::::s c
6
c
(\J
<D
~ 0
6
12
*
Flights Hops
Behavi ur
Wing flicks
*
*
OBox iSIStoat
Mainland
Island
Figure 2.3: Mean (± se) number of flights, wing flicks and hops per trial by robins presented with the stoat and box, on Motuara Island (N ==30) and on the mainland
[image:33.597.121.481.58.479.2]*
1000
900
800
D
BoxtsJ
Stoat700
600
500
..-400
0<D Mainland
(/)
300
...ro
200
l -+-'
...
100
<D
0
+-'
100
C
ro
200
<D
:2
300
Island400
500
600
700
[image:34.596.68.523.48.535.2]A
B
C
D
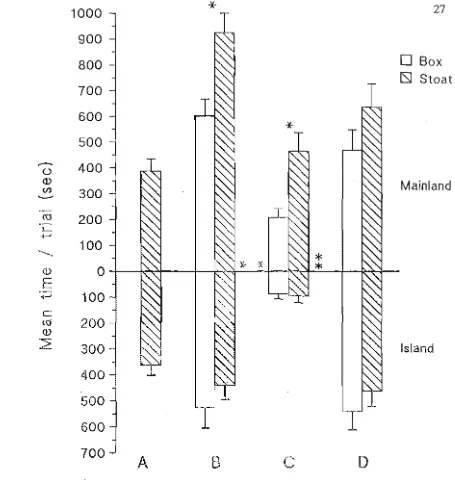
Figure Mean (± se) time between feeds of the chicks per trial by robins presented with the stoat and box, on Motuara Island (N =30) and on the mainland (N = 14). Times are A) natural time between feeds (pre-stimulus presentation); B) total time. between feeds during a stimulus presentation; C) time from when a robin sights the stimulus to when the chicks are fed (a subset of B); and D) time to the first feed of the chicks after the stimulus was removed (post-stimulus
60
50
0 Box
40
0 Stoat30
(/)
-(U
Mainland
L
20
+-'
-..-0
Q)
10
0>
ro
+-'
0
C
Q)
U
L
ID
10
Q..
Island
20
30
40
A
B
C
D
E
Behaviour
[image:35.595.94.525.96.560.2]29
0 Box160
lSI Stoat(/)
::J
::J
140
+-'
E
120
(/)
Q) +-'
(/) (/)
100
0 0
0 +-'
80
c ..c
60
co 0
Q) co
:2
040
L
0..
20
0..co
0
~ f
*
Island Mainland
Figure 2.6: Mean (± se) closest approach distance by robins to the stoat and box per trial, on Motuara Island (N = 30) and on the mainland (N = 14). * shows p < 0.05
[image:36.595.118.474.61.324.2]There were no significant differences in the response of robins towards the stoat compared to the box on Motuara Island for any of the behaviour, time or distance variables measured (ie. MS=MB). At Kowhai Bush, robins gave significantly more flights, hops and wing flicks (Fig 2.3), and took longer between successive feeds of chicks for the stoat compared to the box trials (ie. KS> KB, Fig 2.4). The increased time between feeds was because robins spent relatively more time away from the nest after sighting the stoat and was not a result of differences in foraging times prior to seeing the stoat.
Comparisons between study areas show that robins responding to the stoat at Kowhai Bush flew, wing flicked and hopped significantly more (Fig 2.3), took a longer total time between successive chick feeds and took longer to feed the chicks after sighting the stoat (Fig 2.4), than robins responding to either the stoat or the box on Motuara Island (ie. KS>MS=MB). However, none of the other variables (as described in Table 1.1) were significantly different between study areas for stoat trials (Fig 2.5 & 2.6), nor were between-area comparisons for any of the variables significant for box trials (ie. KB
=
MB=
MS).DISCUSSION
Differences in responses of robins due to the number of birds present, sex of birds, and stimulus presentation order
Robins responded to an enemy stimulus near the nest at a level which did not depend on the presence or absence of the mate, the sex of the bird present, or whether the robin had seen a non-threatening box in the same position the previous day.
31
For a stable pair-bonded, monogamous and monochromatic species such as the robin (Powles land 1980, unpubl. data), there may be advantages in sharing
responsibility for nest-defence against predators. I suggest that both parents being able to defend their nest from predators will accrue advantages, first, in offspring protection by increasing the probability that either parent is in the nest area, and second, in foraging efficiency where both birds may spend longer foraging for food away from the nest area. Equal contribution to nest-defence may well be typical of other monogamous and strongly territorial birds (eg. Taylor 1991, in the rifleman,
Acanthisitta chloris, and the grey warbler, Gerygone igata). The intensity of nest-defence by each robin does not change when the partner arrives possibly because both birds are already responding maximally towards that particular predator stimulus.
Responses of robins towards enemy and non-threatening stimuli
Robins at Kowhai Bush appeared to recognise the stoat near the nest as an enemy and responded with appropriate nest-defence behaviours. In comparison, Motuara Island robins did not appear to recognise the stoat and responded in a weak and confused manner. All of the behavioural variables support this
conclusion, whether analysed individually, or collectively as an intensity score. On Motuara Island low intensity behaviours such as body movements were given by robins equally to both stimuli, whereas body displays and alarm calling (ie. presumed high motivation nest-defence behaviours) were rarely and often
inappropriately given. For example, wing-droop distraction displays were given to the box in twice as many trials as to the stoat and even the strongest nest-defence response usually concluded with the robin returning to the nest while the stimulus was still in position.
The high levels of robin nest-defence responses recorded in the Kowhai Bush population are likely to be the result of experience with stoats, with predation by stoats causing selection pressure for effective nest-defence behaviours in Kowhai Bush robins. Robins on Motuara Island have no experience of stoats, and so there has been no selection for strong nest-defence behaviours.
33
CHAPTER 3
Enhancement of robin nest·defence behaviours by training
Although some studies have shown that animals may possess an innate ability to recognise predators (eg. Coss & Owings 1978, Curio 1975, Hirsch & Bolles 1980, Hobson et al. 1988, Mueller & Parker 1980, Riechert & Hedrick 1990), several other studies have found that a learning period is necessary for an animal to develop and hone recognition skills (eg. Coleman 1987, Conover 1987, Regelmann & Curio 1983, Thornhill 1989, see Chapter 1).
Birds that require experience with predators to develop effective anti-predator behavioural responses are at greater risk of injury than those who have genetic recognition and response abilities (Bolles 1970). However, some birds do not have the opportunity to experience appropriate defence~responses or have lost
genetically-based abilities to respond appropriately to predators (McLean &
Maloney 1989, in prep). These birds are particularly vulnerable to introductions of unrecognised predator groups.
The New Zealand avifauna evolved in an environment free from mammalian predators and was severely reduced when humans and other mammals arrived (Holdaway 1989, McDowall 1969, and see Chapter 2). One hundred years after the last of the major predatory mammal introductions three groups of birds are still naive about mammalian predators. The first are populations that live on offshore islands which are free from some or all mammals (eg. birds on the Snares and Rangatira Islands); the second are naive juvenile birds who have not yet learned anti-predator responses by experience; and the third are birds raised in captivity in the absence of predators, then released into the wild as part of captive-rearing and release management programmes (eg. takahe, Notornis mantelli, black stilt,
Himantopus novaezealandiae, North Island weka, Gallirallus australis).
flush, depending on the type of predator chasing them. However, Ellis et al. did not detail how the information was transferred between individuals in the covey and successful training may have relied as much on increasing the bird's flying ability as teaching them appropriate responses. There has been no application of a training technique to field situations, where naive birds are taught how to respond to a potential predator by watching the responses of other individuals, before contact with the predator is made.
The aim of this chapter is to test whether an artificial training technique can be used to enhance nest-defence behaviours in a field situation. Specifically, a
population of robins are trained to give nest-defence responses towards a previously unknown predator, the stoat.
METHODS General methods
Robins were trained to recognise and respond to an enemy near the nest by giving them an experience of an appropriate mobbing event (ie. an attack or distraction display by one or more individuals). A mobbing training event involved the stimulus of a conspecific giving a vocal and visual mobbing display towards a moving enemy (the stoat). Training occurred on Day 2 of the experiment. On the following day (Day 3) the stoat was presented I-105m from each robin nest and nest-defence responses of the female were recorded using variables described in Table 1.l.
All training was undertaken on Motuara Island during the 1989 and 1990
breeding seasons, on robins at the incubation stage. None of these robins had been used in any other experiments.
Training procedure
Day One: Natural nest-approach data w~re recorded and attachment strings
35
Day Two: Training mounts and speakers were set up on the ground as illustrated in Fig 3.1.
[image:42.607.117.504.133.706.2]All training was conducted in a central area within the territory, and more than 10m from the nest. When the female left the nest to feed, the mounts were uncovered and the training event was run for 5 min. The criterion for beginning training was that the female be in line of sight of the training arena. To increase inter-nest consistency in starting conditions I did two things. First, I fed the male a small number of Tenebrio larvae. With the larvae the male called the female off the nest and often fed her within sight of the training arena;· Second, if the male fed the female nearby but out-of-sight of the arena, I played a short 5-10 second burst of alarm calls through the speaker, which always attracted both birds into the training arena. During a 5 min training event I recorded responses of robins into a hand-held cassette recorder, after which the mounts were removed.
Day Three: Nest-defence responses of robins toward the stoat were recorded by placing the stoat by each nest on the strings positioned on Day 1. The behaviours, times and distance (Table 1.1) of the female returning to the nest were recorded.
Construction of mounts and playback recordings
A description of construction of the stoat mount is given in Chapter 2. The bird mounts used during training were:
(i) Mobbing robin mount (Fig 3.2a). A female robin found freshly dead on Allports Island in October 1989 was taxidermically mounted with wings and tail spread and positioned on a 270mm long x 25mm diameter branch.
(ii) Robin in the stoat's mouth (Fig 3.2b). Two robins found dead on Allports and Motuara Islands were soaked in 70% alcohol for one week then air dried. The second robin was a replacement used in training events in November 1990.
A) 37
B)
C)
[image:44.599.70.491.65.733.2]I recorded robin IIrapid alarmll
calls (equivalent to IIfast loud chucksll
of Hay 1975, p.18) from a male on Allports Island in September 1989, using a Uher (Report 4000L) reel-to-reel tape recorder, microphone and parabola. The rapid alarm call was possibly given in response to a weka seen nearby, but this call is apparently used very generally in response to threatening stimuli, including harrier hawks, Circus approximans, weka, predatory mammals, people and possibly
conspecifics (Flack 1979, Hay 1975, Powlesland 1980, pers. obs.). I recorded robin distress calls (Hay 1975, p.26) into a hand-held cassette recorder (Sanyo model MI00IA) from a near-independent juvenile on Motuara Island in October 1990. Blackbird alarm calls were recorded by S.L. Dean at Kowhai Bush in 1988.
All tapes were edited to provide a continuous sequence of calls 5 mins in length.
Training regimes used
One of five training regimes was randomly assigned to each pair after their nest was found. The layout of mounts in the training arena and description of each of the five training regimes are described in Fig 3.1 and Table 3.1. Regime designs were based on preliminary training attempts on Allports Island (Chapter 1). Robins in Regime ROBMOB experienced IIfull trainingll
, ie. both audible and visual
mobbing stimuli. Regime BKBMOB (blackbird and blackbird alarm call) was a control for any situation where a bird mobs a stoat with alarm calls. Regime ALARM was a control for the response of robins to an audible alarm stimuli without visual cues provided by the mobbing robin mount. In Regime DISTRES the focus was shifted away from a mobbing event and onto a robin in distress held in the stoats mouth, and Regime NOTRAIN measured the baseline response of untrained robins towards the stoat placed 1-1.5m from the nest.
Comparisons
39 Table 3.1: Description of the training regimes used and the stimulus presented at the nest on Day 3.
Bird Mount Enemy Calls Played Enemy
Stimulus Through Stimulus
Speaker Presented
on Day 3 Regime
ROBMOB
Robin in Stoat with Robin alarm Stoat
mobbing dead robin
posture in mouth
BKBMOB
Blackbird Stoat with Blackbird Stoat
in mobbing dead robin alarm
posture in mouth
ALARM
None Stoat with Robin alarm Stoat
dead robin in mouth DISTRES
None Stoat with Robin Stoat
dead robin distress in mouth
NOTRAIN
None None None Stoat
Comparisons were made:
1) between training regimes, in the response of female robins towards the stoat at the nest on Day 3;
2) within training regimes, in differences in response between sexes during each training event on Day 2;
3) between training regimes, in the average response given by robins towards the stoat during each training event on Day 2, and;
of the female of the same pair during the stoat presentation on Day 3. Analyses
Overall intensity score and individual body movement behaviours (wing flicks, flights and hops), times and distances were compared between training regimes using Kruskal-Wallis tests. If this overall comparison was significant (at p<0.05), planned comparisons were made between all possible pairs of regimes using Wilcoxon Sign Rank tests. For these pair-wise comparisons a conservative critical p-value of 0.01 was used because ·of the large number of comparisons made. Where a datum was missing the pair of data points were dropped from the analyses.
Because of very low and similar rates of alarm-calling given by male and female robins in each training event and by female robins on Day 3, this behaviour was not analysed. For the same reason other uncommon feather and displacement displays (bill-wiping, wing-drooping, raising head feathers or frontal spot) were pooled into a single category, "body displays" within each regime. Comparisons of body displays between training regimes were made using Chi-square tests.
The behaviours, times and distance categories given at training events on Day 2 were compared with the response intensity scores of female robins given towards the stoat on Day 3 using Spearman Rank Correlations, with a critical p-value of 0.05.
RESULTS
A total of 100 pairs of incubating robins were used for training experiments, with nests divided evenly between the five training regimes. Twenty two tests were completed in 1989 and the remainder were completed in 1990.
Comparison of nest-defence responses of females among training regimes one day after training
41
8
Training regime
(l)
D
ROBMOB1
-6
0
o
ALARM0
(I)
[81
DISTRES>- 4
IS]
BKBMOB+-'
(I) • NOTRAIN
c
(l) +-' 2
c
0
Training
regime
[image:48.594.94.517.138.413.2]Table 3.2: Differences among training regimes in response of robins to stoat presented outside the nest the day after training. Pair-wise comparisons were between NOTRAIN (N), ROB MOB (R), DISTRES (D), ALARM (A) and BKBMOB (B) training regimes.
Training Regime Significant
Variable Pairwise
Measured KW value# p-value Comparisons# #
Flights 18.66 <0.001 R=A=D>B
Wing flicks 20.03 <0.001 R=A>N=B
Hops 16.82 0.002 R=A>N=B
Closest
approach 9.44 0.051 R>B
Time in view
of the stoat 17.20 0.002 A>N=B
Total time
off during NS
test
Time off after
seeing stoat 11.41 0.022 NS
Time on nest
post trial NS
Time off nest
post trial NS
Body displays+
X2 df
P Difference
10.2 4 0.037 R=D>B=N
# = Kruskal Wallis tests between training regimes
## = Wilcoxon Sign Rank tests for pairwise comparisons, p<O.Ol
43
Female robins trained using regimes involving conspecific mounts and calls (ROBMOB, ALARM and DISTRES) responded at a significantly higher intensity to the stoat near the nest than did untrained robins (NOTRAIN), or females trained without robin mounts and calls. (BKBMOB). Thus, training using
conspecific mounts and calls had a positive influence on the subsequent recognition test conducted 24 hrs later.
When nest-defence responses of females towards the stoat were analysed separately, there were significant differences among the training regimes in most of the behaviours, times and distances measured, with ROBMOB, ALARM and DISTRES trained females responding to the stoat at a co