Original Article
Strain elastography features in invasive breast cancer:
relationship between stiffness and pathological factors
Ye Jin, Fenghua Li, Jing Du, Yifen Guo
Department of Ultrasound, Ren Ji Hospital, School of Medicine, Shanghai Jiao Tong University, Shanghai, China
Received March 5, 2017; Accepted August 12, 2017; Epub September 15, 2017; Published September 30, 2017
Abstract: Our study aimed to investigate the relationship between stiffness and pathological factors in invasive breast cancer. We evaluated stiffness by strain elastography indicators of elasticity score and hardness percentage (HP) in tumors that histologically confirmed as invasive breast cancers. The relationship between stiffness and path -ological factors including histologic type, histologic grade and molecular subtypes were analyzed, and the most influ -ential factor was further determined by logistic regression analysis. Of 291 invasive breast cancers, 230 (79.0%) tu-mors were stiff according to elasticity score evaluation, and the average value of HP was (82.32±15.72)%. Based on the elasticity score result, the cutoff value of HP for hard tumors was 80.0% (sensitivity 90.1%, specificity 100.0%), lesions with inconsistent evaluation results by two indicators were almost grade III tumors (19/21). Differences in stiffness could be found in histologic grades (both P<0.001) and molecular subtypes (score P=0.003, HP P<0.001) but were not obvious in histological types (score P=0.034, HP P=0.131). Grade I or grade II (low grade) type tumors and luminal A type tumors were harder, while histologic grade was the only independent factor for tumor stiffness. The grade III group, which had a mean value of HP (65.68±18.02)%, was significantly softer than the low grade group (P<0.001). The cutoff value of HP for low grade tumors was 80.59% (sensitivity 88.2%, specificity 84.4%). Our study revealed a close relationship between tumor stiffness and the histologic grade of invasive breast cancer. Strain elastography may have potential applications to provide prognostic information for patients with breast can-cer noninvasively.
Keywords: Elastography, stiffness, hardness percentage, breast cancer
Introduction
At present, strain elastography (SE) has become a valuable supplemental tool in breast diagno-sis. SE has been performed successfully in the differentiation of benign and malignant breast lesions, and it could help to increase the speci-ficity and accuracy of conventional ultrasound in assessing breast lesions [1, 2]. The basic principle of SE is the elasticity coefficient, which varies between different breast tissues in ascending order: adipose tissue, fibrosis, non-invasive ductal carcinoma and non-invasive ductal carcinoma (IDC) [3]. Malignant lesions are stiff-er than benign ones. As outlined, breast can-cers are histologically heterogeneous, patho-logical factors are important to breast tumors in classification, treatment and prognosis [4]. Basic research had revealed that tumor stiff-ness was associated with tumor progression [5], quantity of extracellular matrix collagens
histologic grade. However, the results above were inconsistent, and the independent patho-logical factor for tumor stiffness remains to be determined.
Therefore, the aim of our study was to investi -gated the relationship between tumor stiffness and pathological factors, including histologic type, histologic grade and molecular subtype Two indicators were used to evaluate tumor stiffness. One was the widely recognized evalu-ation indicator of elasticity score, which is a visual assessment based on the degree and distribution of strain in and surrounding the lesion; the other indicator was hardness per-centage (HP), which could offer perper-centage value for the hardest part of the tumor, and it.was also reported a valuable evaluation indi-cator [11, 12].
Material and methods
Subjects
From February 2015 to June 2016, patients scheduled for surgery all underwent routine sonographic evaluation before the operation, and 352 patients with 356 lesions were histo -logically confirmed as invasive breast cancer after the operation. According to our research exclusion criteria, 30 patients who had received breast cancer-related treatments or had under-gone biopsy for breast masses before examina-tion, 2 patients with cancer of the accessory mamma at the axilla, and 33 lesions without
quality SE images (mostly too large) were excluded. The remaining 291 lesions in 287 women (age range, 24-85 years; mean age, 54.5±11.9 years) were enrolled in our study. This retrospective study was approved by the ethics committee of our hospital.
SE examinations
All SE examinations were performed by one radiologist who had 7 years of experience in breast ultrasound. Our study was performed using the MyLabTM Twice system (Esaote S.p.A., Genova, Italy) with a linear transducer (LA523, 4-13 MHz). The SE mode was started when op-timal B-mode images were selected. According to the WFUMB Guidelines [13], the transducer was placed perpendicularly on the lesion with slight pressure and was kept still to acquire stable images. All images were stored in the machine.
Image analysis
Images were reviewed by two radiologists who were both blinded to patients’ clinical data, and all evaluation results were made by consensus. The elasticity score was evaluated according to a five-point classification [14]. Score 1 was given when the whole lesion presented green, which indicated strain over the whole lesion; score 2 was given when the lesion presented as mostly green with a little blue, which indi-cated strain over most of the lesion with few areas spared; score 3 was given when the lesion presented as half green and half blue, which indicated strain in half of the lesion; score 4 was given when the lesion was predom-inantly blue, which indicated no strain or a little strain in the whole lesion; and score 5 was given when the whole lesion presented blue, which indicated no strain over the whole lesion or surrounding tissue. HP was analyzed by Elaxto software on the machine. When we traced the lesion on dual grayscale images, HP was auto calculated. In this study, the hardness level of HP was set at 20%, as the color scale of the machine had 5 colors ranging from blue, teal, green, yellow to red. Thus, all blue areas could be counted, which corresponded to the hardest areas in the tumor.
Histopathologic analysis
[image:2.612.92.287.71.275.2]All pathologic analyses were performed after operation. Histologic types were determined by
the World Health Organization classification [15], and histologic grades were assessed by the Elston and Ellis grading system for IDC [16]. Immunohistochemical staining was performed to identify the expression of estrogen receptor
[image:3.612.90.403.71.270.2]ticity score between histological groups. The differences in continuous variable of HPs am- ong pathologic subgroups were evaluated by the Mann-Whitney U-test or Kruskal-Wallis test. If statistical significance was found, the ANOVA
Figure 2. Images from a 42-year-old woman with grade III invasive ductal carcino-ma. A. It is an irregular and markedly hypoechoic lesion, and seems hard with score 4 on elastography. B. The hardness percentage was only 66.71%.
Table 1. Stiffness of invasive breast cancer according to pathological factors
Pathological
factors N
Elasticity score HP
2 or 3
n (%) 4 or 5 n (%) P value (%)Mean P
Histologic type 0.034 0.131
Ductal 267 51 (19.1) 216 (80.9) 82.54±15.64 Papillary 7 2 (28.6) 5 (71.4) 87.04±7.94 Mucinous 10 4 (40.0) 6 (60.0) 79.06±7.53 Lobular 5 3 (60.0) 2 (40.0) 66.12±25.78
Medullary 1 1 (100.0) 0 51.16
Tubular 1 0 1 (100.0) 91.86
Histologic grade <0.001 <0.001
Grade I 12 2 (16.7) 10 (83.3) 88.58±13.79 Grade II 191 16 (8.4) 175 (91.6) 87.80±9.90 Grade III 64 33 (51.6) 31 (48.4) 65.68±18.02
Molecular subtype 0.003 <0.001
luminal A 51 1 (2.0) 50 (98.0) 90.69±6.69 Luminal B1 126 28 (22.2) 98 (77.8) 81.86±17.22 Luminal B2 39 9 (23.1) 30 (76.9) 82.25±16.26 HER2 39 11 (28.2) 28 (71.8) 79.39±14.53
TN 36 12 (33.3) 24 (66.7) 75.58±15.68
Note: Luminal B1 = luminal B without HER2 overexpression. Luminal B2 = luminal B with HER2 overexpression.
(ER), progesterone rec- eptor (PR), human epi-dermal growth factor receptor 2 (HER2) and Ki67. The ER and PR status were considered positive when nuclear staining was present in >10% [17]. The expres -sion of HER2 was con-sidered positive when the result of tumor cell membrane staining was 3+ or 2+ with amplifi-cation, which was fur-ther assessed by fluo -rescent in situ hybridi- zation (FISH) analysis [18]. Molecular subtyp- es were defined by the St. Gallen criteria [19] : luminal A (ER and/or PR positive, HER2 negati- ve, and Ki-67 LI <14%), luminal B without HER2 overexpression (luminal B HER2-, ER and/or PR positive, HER2 negative and Ki-67 LI ≥14%), luminal B with HER2 ov- erexpression (luminal B HER2+, ER or/and PR positive and HER2 posi-tive), HER2 (ER and PR negative and HER2 pos-itive) and triple negative (TN) (ER, PR and HER-2 negative).
Statistical analysis
[image:3.612.92.400.356.619.2]elas-test was further used to assess the inter-group differences compared to each other. Finally, a logistic regression analysis was used to deter-mine which pathologic factors were indepen-dently associated with tumor stiffness, and cut-off values of stiffness were made by ROC. All statistical analyses were performed with SPSS software (SPSS for Windows, Version 20.0; SPSS, Chicago, IL, USA), and P values less than 0.05 were considered statistically significant.
stiffness value of HP (65.68±18.02)% was sig -nificantly softer than the grade I or/and grade II (low grade, Figure 4) groups (P<0.001), and statistical significance was not found between the grade I and grade II group (P=0.502). Ap- proximately 51.6% (33/64) of grade III IDCs were soft according to elasticity score evalua-tion, and there was no tumor with a score of 5 in this group. Among molecular subtypes, the Luminal A tumors (Figure 4) had the highest
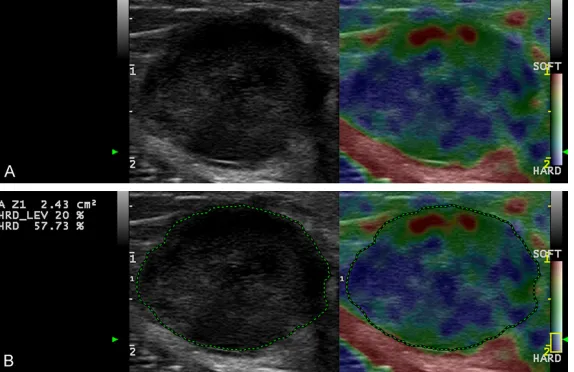
Figure 3. Images from a 34-year-old woman with a triple-negative, grade III invasive ductal carcinoma. A. The lesion is a hypoechoic round mass with a circumscribed margin and posterior acoustic enhancement. The elastogra -phy image depicts a green to blue colored lesion with a score of 3. B. The hardness percentage was 57.73%.
Results
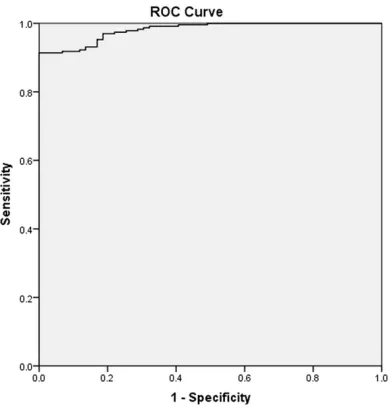
[image:4.612.91.378.72.258.2]Of 291 invasive breast can-cers, 230 (79.0%) tumors we- re hard, 61 (21.0%) tumors were soft by elasticity sco- re evaluation, no tumor was evaluated as score 1, and the average value of HP was (82.32±15.72)%. If using the elasticity score as a standard, the cutoff value of HP for hard tumors was 80.0% (sensitivi- ty 90.1%, specificity 100.0%). Figure 1 shows the ROC curv-er. Besides, we found the in- consistent stiffness evalua-tion results by two methods were almost (19/21) grade III tumors (Figure 2).
[image:4.612.90.377.338.533.2]When tumors were classified by histological factors, the SE appearances are shown in
Table 1. There were 267 IDCs and 24 tumors of special types, and differences in stiff-ness according to histologic types were compared in sub-groups with numbers over 5 (medullary and tubular types with only 1 tumor were not included), statistical signifi -cance was not found by HP (P=0.131), but the elasticity score showed a moderate cor-relation with histologic type (P=0.034). We found signi- ficant stiffness differences in histologic grades (both P< 0.001) and molecular sub-types (elasticity score P= 0.003, HP P<0.001). Of 267 IDCs, the grade III (high grade,
Figure 3) group with a mean
average stiffness value of HP (90.69±6.69)% than the other subtypes, especially compared with the Her2 (P=0.006) or TN tumors (P< 0.001, Figure 3). Almost all luminal A tumors were hard according to elasticity score evalua-tion. Only 1 tumor was soft with a score of 3, and the histological type was mucinous car- cinoma.
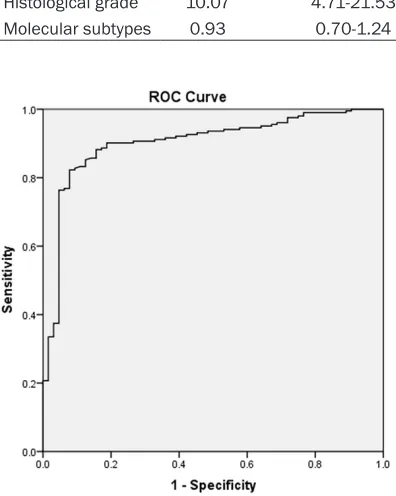
Regression analysis in Table 2 indicated that histologic grade was the only independent pathologic determinant of tumor stiffness (P<0.001), and the influence of molecular sub -type on tumor stiffness values was not sta- tistically significant (P=0.625). The cutoff value of HP for low-grade IDC was 80.59% with a sensitivity of 88.2% and specificity of 84.4% ( Figure 5).
Discussion
Recently, SE has become widely available and has shown great diagnostic performance in breast cancer. Our results show that most inva-sive breast cancers, including 60% mucinous carcinoma and 66.7% TN type tumors, which
desmoplastic reaction or short doubling time, which could make it stiffer than a benign lesion [20]. When taking histological factors into account, we found differences in stiffness with histologic grades and molecular subtypes. The result was consistent with previous studies [8, 21]. High stiffness was noted in low grade IDC and Luminal A tumors This may be because tumors with a lower invasive behavior usually grow slowly and have enough time to develop a desmoplastic reaction [22], which plays an important role in changing tumor stiffness by the components of fibrosis and extracellular matrix protein [23, 24]. Respectively, high-grade IDC and TN in our study were less stiff, and they were recognized as more aggressive tumors with higher cellularity and grew rapidly, which would lead to more internal necrosis and less fibrosis [25]. Our results made sense con -sidering findings by Chamming et al. [26], who reported that stiffness showed a positive cor-relation with the fibrosis and a negative correla -tion with tumor cells and necrosis. However, regression analysis indicated that histologic grade was the only independent factor for tumor stiffness, and molecular subtype may be a dependent factor influencing elasticity, stiff -ness measurement couldn’t be used to deter-mine molecular subtype, which was in line with Chang et al. [27]. Furthermore, we found tumors with HP over 80.59% or hard tumors evaluated by elasticity score, were probably low grade tumors. The ability to predict the grade of inva -sive breast cancer by SE may have clinical sig-nificance in making a preliminary prognostic evaluation. The stiffer of the tumor is, the great -er of the chance to be related to low-grade car-cinoma, with a relative good prognosis.
Though our study found no statistically signifi -cant stiffness difference between histologic types, there was a tendency that ductal and papillary carcinomas were relatively hard. What’s more, tubular carcinoma in our study also presented with high stiffness, it was recog-nized as a hard tumor with abundant of fibrous in stroma by basic research [28]. While, it was
Figure 5. ROC curve for HP method in differentiating low from high grade of invasive ductal carcinomas.
[image:5.612.91.289.116.364.2]usually mimicked a benign appear-ance on conventional ultrasound, exhibited high stiffness. SE may therefore more easily identify inva-sive breast cancer by tumor stiff-ness. It was said that malignant breast lesion usually had an obvious
Table 2. Influence of pathologic factors on the stiffness of invasive breast cancer
not analyzed, more samples may be needed to validate this observation. Nevertheless, our observation suggests that hard tumors may have good prognosis, because those types were all well differentiated tumors.
In addition, we selected two indicators, the elasticity score and HP, to evaluate tumor stiff-ness. The elasticity score is convenient, but it is a subjective evaluation and offers only a visual assessment of stiffness. Tumors with a highly heterogeneous appearance on SE made the evaluation between score 4 and score 3 diffi -cult [29]. Thus, its combination with HP may facilitate a more accurate, objective evaluation. Meanwhile, we found that the inconsistent stiff-ness evaluation results by two methods also made sense for aggressive tumors, especially high-grade IDC. According to the principal HP over 80.0% for hard tumors, we found tumors with opposite stiffness evaluation results by elasticity score were almost grade III IDC (90.5%). They usually had an indistinct edge, and the hard part on the color map showed chunks of blue, which made the eye-based elasticity score overrate stiffness. The hard part may be a complicated combination of increased cellularity, microvessel density and fibrosis [30], HER2 was also reported to corre -late with a high intracellular sensitivity to stiff-ness, and the effect was matrix stiffness-dependent [31]. The soft part of the tumor may be the necrotic area, which did not present spe-cial characteristics on conventional ultrasound. This finding may have a potential application to identify grade III IDC in clinical practice. When a tumor appears hard at first, but the low value of HP suggests that the mass is not as hard as it appears, a high-grade tumor should be sus-pected. This was particularly useful because high-grade tumors have been found to be less characteristic on conventional ultrasound. SE may thus be complementary in identifying breast cancer.
There were several limitations in this study. First, though many series of histological types were included, the numbers of special types were too small. A larger cohort may be needed to obtain a more stable statistical model. Second, the intraobserver variation was not analyzed, but two stiffness evaluation methods were used to control the influence of measure -ment error. Moreover, another limitation was that we analyzed different breast cancers
con-sidering stiffness features alone, which might be insufficient. Though it was not the aim of our study, SE combined with conventional ultra-sound may do more to help predict the patho-logical characteristics of breast cancer, which requires further research.
In conclusion, tumor stiffness was related to histological factors, but histologic grade was the only independent factor for tumor stiffness. SE may have the potential ability to discrimi-nate tumor grade and predict clinical outcome non-invasively for patients with breast cancer.
Disclosure of conflict of interest
None.
Address correspondence to: Fenghua Li, Ren Ji Hospital, No.1630 Dong Fang Road, Shanghai, China. Tel: +86-021-68383396; E-mail: [email protected]
References
[1] Cho N, Jang M, Lyou CY, Park JS, Choi HY and Moon WK. Distinguishing benign from malig-nant masses at breast US: combined US elas-tography and color doppler US--influence on radiologist accuracy. Radiology 2012; 262: 80-90.
[2] Yi A, Cho N, Chang JM, Koo HR, La Yun B and Moon WK. Sonoelastography for 1,786 non-palpable breast masses: diagnostic value in the decision to biopsy. Eur Radiol 2012; 22: 1033-1040.
[3] Krouskop TA, Wheeler TM, Kallel F, Garra BS and Hall T. Elastic moduli of breast and pros -tate tissues under compression. Ultrason Im-aging 1998; 20: 260-274.
[4] Brenton JD, Carey LA, Ahmed AA and Caldas C. Molecular classification and molecular fore -casting of breast cancer: ready for clinical ap-plication? J Clin Oncol 2005; 23: 7350-7360. [5] Levental KR, Yu H, Kass L, Lakins JN, Egeblad
M, Erler JT, Fong SF, Csiszar K, Giaccia A, Weninger W, Yamauchi M, Gasser DL and Weaver VM. Matrix crosslinking forces tumor progression by enhancing integrin signaling. Cell 2009; 139: 891-906.
[6] Mouw JK, Yui Y, Damiano L, Bainer RO, Lakins JN, Acerbi I and Ou G. Tissue mechanics modu -late microRNA-dependent PTEN expression to regulate malignant progression. 2014; 20: 360-367.
-histochemical Subtypes of Breast Cancers: prognostic value of Comb-Push ultrasound shear elastography for differentiating luminal subtypes. PLoS One 2016; 11: e0165003. [8] Fleury Ede F, Assuncao-Queiros Mdo C and
Roveda D Jr. Breast carcinomas: variations in sonoelastographic appearance. Breast Cancer (Dove Med Press) 2014; 6: 135-143.
[9] Hayashi M, Yamamoto Y, Sueta A, Tomiguchi M, Yamamoto-Ibusuki M, Kawasoe T, Hamada A and Iwase H. associations between elastog-raphy findings and clinicopathological factors in breast cancer. Medicine (Baltimore) 2015; 94: e2290.
[10] Grajo JR and Barr RG. Strain elastography for prediction of breast cancer tumor grades. J Ul-trasound Med 2014; 33: 129-134.
[11] Zhang X, Xiao Y, Zeng J, Qiu W, Qian M, Wang C, Zheng R and Zheng H. Computer-assisted as-sessment of ultrasound real-time elastogra-phy: initial experience in 145 breast lesions. Eur J Radiol 2014; 83: e1-7.
[12] Cesario V, Accogli E, Domanico A, Di Lascio FM, Napoleone L, Gasbarrini A and Arienti V. Percu -taneous real-time sonoelastography as a non-invasive tool for the characterization of solid focal liver lesions: a prospective study. Dig Liv-er Dis 2016; 48: 182-188.
[13] Barr RG, Nakashima K, Amy D, Cosgrove D, Farrokh A, Schafer F, Bamber JC, Castera L, Choi BI, Chou YH, Dietrich CF, Ding H, Ferraioli G, Filice C, Friedrich-Rust M, Hall TJ, Nightin -gale KR, Palmeri ML, Shiina T, Suzuki S, Sporea I, Wilson S and Kudo M. WFUMB guidelines and recommendations for clinical use of ultra-sound elastography: Part 2: breast. Ultraultra-sound Med Biol 2015; 41: 1148-1160.
[14] Itoh A, Ueno E, Tohno E, Kamma H, Takahashi H, Shiina T, Yamakawa M and Matsumura T. Breast disease: clinical application of US elas-tography for diagnosis. Radiology 2006; 239: 341-350.
[15] Bocker W. [WHO classification of breast tu -mors and tu-mors of the female genital org- ans: pathology and genetics]. Verh Dtsch Ges Pathol 2002; 86: 116-119.
[16] Elston CW and Ellis IO. Pathological prognostic factors in breast cancer. I. The value of histo -logical grade in breast cancer: experience from a large study with long-term follow-up. Histopa-thology 2002; 41: 154-161.
[17] Hammond ME, Hayes DF, Wolff AC, Mangu PB and Temin S. American society of clinical on -cology/college of american pathologists gui- deline recommendations for immunohistoch- emical testing of estrogen and progesterone receptors in breast cancer. J Oncol Pract 2010; 6: 195-197.
[18] Lim TH, Lim AS, Thike AA, Tien SL and Tan PH. Implications of the updated 2013 American society of clinical oncology/college of Ameri-can pathologists guideline recommendations on human epidermal growth factor receptor 2 gene testing using immunohistochemistry and fluorescence in situ hybridization for breast cancer. Arch Pathol Lab Med 2016; 140: 140-147.
[19] Goldhirsch A, Wood WC, Coates AS, Gelber RD, Thurlimann B and Senn HJ. Strategies for sub -types--dealing with the diversity of breast can-cer: highlights of the St. Gallen international expert consensus on the primary therapy of early breast cancer 2011. Ann Oncol 2011; 22: 1736-1747.
[20] Wang Y, Ikeda DM, Narasimhan B, Longacre TA, Bleicher RJ, Pal S, Jackman RJ and Jeffrey SS. Estrogen receptor-negative invasive breast cancer: imaging features of tumors with and without human epidermal growth factor recep-tor type 2 overexpression. Radiology 2008; 246: 367-375.
[21] Tamaki K, Ishida T, Miyashita M, Amari M, Ohu -chi N, Tamaki N and Sasano H. Correlation be -tween mammographic findings and corresp-onding histopathology: potential predictors for biological characteristics of breast diseases. Cancer Sci 2011; 102: 2179-2185.
[22] Irshad A, Leddy R, Pisano E, Baker N, Lewis M, Ackerman S and Campbell A. Assessing the role of ultrasound in predicting the biological behavior of breast cancer. AJR Am J Roentgen-ol 2013; 200: 284-290.
[23] Boisserie-Lacroix M, Bullier B, Hurtevent-Labrot G, Ferron S, Lippa N and Mac Grogan G. Correlation between imaging and prognostic factors: molecular classification of breast can -cers. Diagn Interv Imaging 2014; 95: 227-233. [24] Hao Y, Guo X, Ma B, Zhu L and Liu L.
Relation-ship between ultrasound elastography and myofibroblast distribution in breast cancer and its clinical significance. Sci Rep 2016; 6: 19584.
[25] Ko ES, Lee BH, Kim HA, Noh WC, Kim MS and Lee SA. Triple-negative breast cancer: correla -tion between imaging and pathological find -ings. Eur Radiol 2010; 20: 1111-1117. [26] Chamming’s F, Latorre-Ossa H, Le Frere-Belda
MA, Fitoussi V, Quibel T, Assayag F, Marangoni E, Autret G, Balvay D, Pidial L, Gennisson JL, Tanter M, Cuenod CA, Clement O and Fournier LS. Shear wave elastography of tumour growth in a human breast cancer model with patho-logical correlation. Eur Radiol 2013; 23: 2079-2086.
elastography correlated with subtypes of bre- ast cancer. Eur Radiol 2013; 23: 2450-2458. [28] Tourasse C, Coulon A and Denier JF.
Radio-histological correlations of subtle sonography images. Diagn Interv Imaging 2014; 95: 181-195.
[29] Duma MM, Chiorean AR, Feier DS, Florea M, Chiorean M, Rusu GM, Dudea SM and Sfrangeu SA. The added value of color parameters in analyzing elastographic images of ultrasound detected breast focal lesions. Clujul Med 2015; 88: 50-57.
[30] Juge L, Doan BT, Seguin J, Albuquerque M, Lar -rat B, Mignet N, Chabot GG, Scherman D, Para-dis V, Vilgrain V, Van Beers BE and Sinkus R. Colon tumor growth and antivascular treat-ment in mice: completreat-mentary assesstreat-ment with MR elastography and diffusion-weighted MR imaging. Radiology 2012; 264: 436-444. [31] Butcher DT, Alliston T and Weaver VM. A tense