UWB at SemEval-2016 Task 7: Novel Method for Automatic Sentiment
Intensity Determination
Ladislav Lenc, Pavel Kr´al and V´aclav Rajtmajer Dept. of Computer Science & Engineering
Faculty of Applied Sciences University of West Bohemia
Plzeˇn, Czech Republic
{llenc,pkral,rajtmajv}@kiv.zcu.cz
Abstract
We present a novel method for determining sentiment intensity. The main goal is to as-sign a phrase a score from 0 to 1 which indi-cates the strength of its association with pos-itive sentiment. The proposed model uses a rich set of features with Gaussian pro-cesses regression model that computes the fi-nal score. The system was evaluated on the data from 7th task of SemEval 2016. Our regression model trained on the development data reached Kendall rank correlation of 0.659 on general English phrases and 0.414 on En-glish Twitter test data.
1 Introduction
A great part of today’s communication takes place on the Internet. Many companies make their busi-ness on the Web, it is possible to read newspa-pers through this media, etc. All these topics are tightly connected with forums, reviews and com-ments where users express their opinions and feel-ings. This great amount of short messages is a very rich source of information. For example companies can survey how people appreciate their goods or ser-vices. Social media such as Twitter or Facebook can also provide large amount of data for opinion and sentiment analysis.
Sentiment analysis can be seen as a part of ion mining that gives the affective part of an opin-ion (Kim and Hovy, 2004). The short texts are usu-ally assigned either positive or negative sentiment (i.e. sentiment polarity). It can be done for exam-ple by text categorization techniques. The minimum
cuts are used for this task in (Pang and Lee, 2004). Another sentiment analysis approach based on La-tent Dirichlet Allocation (LDA) is proposed in (Li et al., 2010).
Many researchers evaluate their approaches on movie or product reviews. Lately, with the boom of social networks, there are also applications that analyze sentiment on Twitter (Wang et al., 2011).
An important progress was made thanks to the Se-mEval workshop (Rosenthal et al., 2015) in a ment analysis task. The task of determining senti-ment intensity was introduced as a part of SemEval 2015 task 10. The goal of this task is to associate a word (or a short phrase) with a score that indi-cates its sentiment level. A score of 1 means that the phrase is fully positive whereas 0 is assigned to negative ones. This approach allows much more fine-grained sentiment evaluation. This year, senti-ment intensity determination is the objective of the task 7 (Kiritchenko et al., 2016) and aims at three separate datasets: General English phrases, English Twitter and Arabic Twitter.
An interesting method that uses no linguistic re-sources and is based on word embeddings was pro-posed in (Astudillo et al., 2015). The system reached Kendall rank correlation of 0.625 on the SemEval 2015 test data. Another successful system (Zhang et al., 2015) used sentiment lexicons and a regression model to determine the sentiment intensity.
The proposed system computes a rich set of fea-tures which are further used to train a regression model that computes the final sentiment intensity score. Four different types of features are proposed:
• lexicon based features;
List hp p n hn int inv dim Words 171 772 782 554 83 15 31
Table 1:Numbers of words in the JRC sentiment lexicon
• word2vec embeddings (Mikolov et al., 2013) based features;
• classifier based features; • other features.
The paper is organized as follows. Section 2 de-scribes the proposed system. Section 3 summarizes the experiments conducted with individual features and presents further the final results on the test data. Section 4 then concludes the paper and lists some perspectives for the future research.
2 Proposed System
The first part of this section is focused on the pro-posed features while the second one deals with the regression model.
The first group of the features used in the pro-posed system is built upon the sentiment lexicons.
2.1 Sentiment Lexicons 2.1.1 AFINN
AFINN 111 (Nielsen, 2011) contains 2,477 En-glish words or 2-word phrases. All entries are asso-ciated with an integer value in the interval from -5 to 5.
Therefore, we have normalized these numbers to the interval[0; 1].
2.1.2 JRC
This lexicon was created by using the approach proposed in (Steinberger et al., 2012). It contains four lists of words grouped according to their senti-ment (hp - highly positive, p= positive, n= nega-tive,hn= highly negative) and additional lists of in-tensifiers (int), inverters (inv) and diminishers (dim). Table 1 summarizes the numbers of words in these lists.
We have joined the four lists and associated all entries with vales 0, 0.25, 0.75 or 1 corresponding to its presence in thehn,n,porhplist respectively.
2.1.3 SentiWordNet
SentiWordNet (SWN) is a large lexicon for sentiment analysis and opinion mining
applica-tions (Esuli and Sebastiani, 2006). We used the ver-sion 3.0 (Baccianella et al., 2010) which contains the results of automatic annotation of synsets from the WordNet dictionary. Each synset is annotated with three scores:positivity,negativityand objectiv-ity. The sum of these three values is always equal to 1. Each word can have several entries for different meanings and for different Parts Of Speech (POS) tags.
To obtain one sentiment intensity value, we com-pute a score according to the Equation 1.
1 P
P
X
p=1 M
X
m=1 1
m(P osp,m−N egp,m) (1)
whereP is the number of POS tags that the word has entries for andMis the number of meanings that
the word can have. P osp, mandN egp, m are the
positivity and negativity word values with the given POSp and meaning m. The objectivity value was
not used in this computation.
2.2 Features
We list below the features that we used to build our regression model. The features that are built upon the dictionaries (i.e. Direct search, W2V search and Rule based W2V search) are computed for each of the above described dictionaries.
1. Direct search: We search an intensity value of a particular word in the dictionary (if present, the result is its value, if not, the result is the neutral value0.5). For multi-word phrases, we compute the arithmetic mean of all word values in the phrase.
2. W2V search: This approach is motivated by the assumption that semantically close words have often also similar sentiment (e.g. “nice” and “fine”). Of course, some exceptions can occur (e.g. “good” and “bad”), however we would like to minimize their impact by averag-ing a significant number of other close words. Word2vec is used to identify N semantically
accord-ing to the Equation 2.
score= 1 KN
K
X
k=1 N
X
n=1
int(wordk,n) (2)
where K is the number of words in the an-alyzed phrase, N is the number of most
similar words identified by word2vec and
int(wordk,n)denotes the intensity value of n-thmost similar word to thek-th. The intensity value is provided by a particular dictionary (de-scribed above).
3. Rule based (rb) W2V search: This feature computing approach is an extension of the pre-vious one with two significant differences:
• It first searches each word in the lists of
diminishers, inverters and intensifiers. If the target word is not contained in these lists, we use word2vec and the dictionaries to compute the intensity (similarly as in the previous case).
• The obtained value is further fine-tuned
using three rules:
– If the phrase contains a diminisher and is positive (intensity>0.5), it is
mul-tiplied by a constant lesser than 1 (if negative, by a constant greater than 1)1.
– If the phrase contains an intensifier and is positive, it is multiplied by a constant greater than 1 (if negative by constant lesser than 1)1.
– If the phrase contains an inverter, its value is subtracted from 1.
4. Classifier output: We use the 5-level Stan-ford sentiment classifier proposed by Socher in (Socher et al., 2013). The classifier returns the probabilities of five labels. We compute the final sentiment intensity using a weighted sum of the probabilities with the following weights: -1,-0.5, 0, 0.5, 1 (1 for very positive phrases). This approach gives a value from the interval from -1 to 1 and it is thus normalized to the in-terval from 0 to 1.
1Constant values were set experimentally on the
develop-ment data to 0.85 and 1.15 respectively.
5. Other (simple) features
• Word count: number of words in a phrase
• Diminisher: binary feature, 1 represents a presence of a diminisher (e.g. word “less”)
• Inverter: binary feature, 1 represents a presence of an inverter (e.g. word “not”)
• Intensifier: binary feature, 1 represents a presence of an intensifier (e.g. word “more”)2
2.3 Regression Model
To combine the above described features and to obtain the final result we use a regression model. Because of our experience with the Weka pack-age (Hall et al., 2009) we chose this tool for im-plementation. We did a comparison of several re-gression models that are implemented in this pack-age and based on the experiments performed on the SemEval development data we chose Gaussian pro-cesses (Rasmussen, 2006) as a good candidate for creating the regression model.
3 Experimental Results
First, the development data containing 200 anno-tated words and phrases were provided for each sub-task. The general English test dataset contains 2,799 words and phrases and the English Twitter dataset contains 1,069 phrases. All of the presented exper-iments are done on the general English test dataset. The testing gold data were not provided. Therefore, we have tuned our system on the development data as briefly presented below.
3.1 Results on General English Test Dataset 3.1.1 Performance of the Individual Features
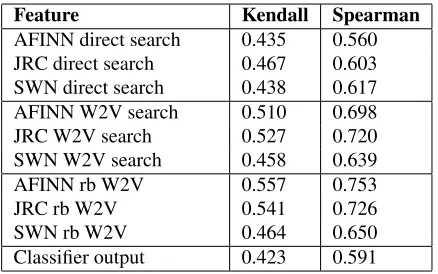
We first use all proposed features (excluding bi-nary and word count features) separately to check their individual performance. Table 2 shows the re-sults of this experiment.
We have set the parameter N = 16 in the
W2V search feature computing approach because this value gave the best results on the development data.
2The three last features are based on the lists provided by
Feature Kendall Spearman AFINN direct search 0.435 0.560 JRC direct search 0.467 0.603 SWN direct search 0.438 0.617 AFINN W2V search 0.510 0.698 JRC W2V search 0.527 0.720 SWN W2V search 0.458 0.639 AFINN rb W2V 0.557 0.753
JRC rb W2V 0.541 0.726
SWN rb W2V 0.464 0.650
[image:4.612.77.296.56.193.2]Classifier output 0.423 0.591
Table 2:Performance of the individual features on general En-glish test dataset
Feature set Kendall Spearman
without SWN 0.659 0.854
without binary 0.630 0.831 all features 0.632 0.834
Table 3:Results of the regression model with the different fea-ture sets on general English test dataset
We can conclude that the superior feature is AFINN rb W2V followed byJRC rb W2V andJRC W2V search. The other features have somewhat worse results but still might be usable in the final system.
3.1.2 Results of the Regression Model
Table 3 presents the results of the final regression model on general English test dataset. This model was trained on the development data. The bold-faced numbers indicate the results submitted to the SemEval.Without SWNmeans that we have used all the features except the three features based on the SWN dictionary.Without binarymeans that we have used all the features except the three binary features and the word count feature. Based on this experi-ment, we have decided not to use the SWN features in the submission because of its slightly lower per-formance on the development data. We have mea-sured the performance on the development data us-ing a ten fold cross-validation.
3.1.3 Comparison with the Top Three Teams
Table 4 shows the final results of the top three teams for the SemEval 2016 task 7 (general English subtask). This table shows that the performance of our system is close to the first one particularly when measured by Spearman correlation.
Team Kendall Spearman
ECNU 0.704 0.863
UWB (presented) 0.659 0.854
[image:4.612.313.535.58.107.2]LSIS 0.350 0.508
Table 4: Comparison of the top three teams competing in Se-mEval 2016 task 7 general English subtask
Team Kendall Spearman
ECNU 0.523 0.674
LSIS 0.422 0.591
UWB (presented) 0.414 0.578
Table 5: Comparison of the top three teams competing in Se-mEval 2016 task 7 English Twitter subtask
3.2 Results on English Twitter
To show the robustness of our approach, we have evaluated the proposed model also on the English Twitter test data from the SemEval task 7. We did not use any tuning of the method for the rather spe-cific data from Twitter. We just trained the model on the English Twitter development data and tested it on the test data. Table 5 shows the results of three best performing systems submitted to SemEval 2016 task 7, English Twitter subtask. The comparison shows that the performance is not far away from the two better systems.
4 Conclusion and Perspectives
We proposed a novel method for sentiment inten-sity determination. The method uses a rich set of features based on three sentiment lexicons, output of a sentiment classifier and binary features based on lists of modifiers. We first evaluated the fea-tures separately on the test data. Then we utilized a Gaussian processes regression model which com-bines the proposed features and computes the final sentiment intensity. The final system was submit-ted to the task 7 of the SemEval 2016 competition. The regression model trained on the SemEval de-velopment data reached Kendall rank correlation of 0.659 on general English phrases and 0.414 on En-glish Twitter test data.
Acknowledgments
This work has been partly supported by the project LO1506 of the Czech Ministry of Education, Youth and Sports and by Grant No. SGS-2016-018 Data and Software Engineering for Advanced Applica-tions.
References
Ramon F Astudillo, Silvio Amir, Wang Ling, Bruno Mar-tins, M´ario Silva, Isabel Trancoso, and Rua Alves Redol. 2015. Inesc-id: Sentiment analysis without hand-coded features or liguistic resources using em-bedding subspaces. SemEval-2015, page 652. Stefano Baccianella, Andrea Esuli, and Fabrizio
Sebas-tiani. 2010. Sentiwordnet 3.0: An enhanced lexical resource for sentiment analysis and opinion mining. In
LREC, volume 10, pages 2200–2204.
Andrea Esuli and Fabrizio Sebastiani. 2006. Sentiword-net: A publicly available lexical resource for opinion mining. In Proceedings of LREC, volume 6, pages 417–422. Citeseer.
Mark Hall, Eibe Frank, Geoffrey Holmes, Bernhard Pfahringer, Peter Reutemann, and Ian H Witten. 2009. The weka data mining software: an update. ACM SIGKDD explorations newsletter, 11(1):10–18. Soo-Min Kim and Eduard Hovy. 2004. Determining the
sentiment of opinions. InProceedings of the 20th in-ternational conference on Computational Linguistics, page 1367. Association for Computational Linguistics. Svetlana Kiritchenko, Saif M. Mohammad, and Moham-mad Salameh. 2016. Semeval-2016 task 7: Determin-ing sentiment intensity of english and arabic phrases. In Proceedings of the International Workshop on Se-mantic Evaluation, SemEval ’16, San Diego, Califor-nia, June.
Fangtao Li, Minlie Huang, and Xiaoyan Zhu. 2010. Sen-timent analysis with global topics and local depen-dency. InAAAI, volume 10, pages 1371–1376. Tomas Mikolov, Kai Chen, Greg Corrado, and Jeffrey
Dean. 2013. Efficient estimation of word representa-tions in vector space. arXiv preprint arXiv:1301.3781. F. ˚A. Nielsen. 2011. Afinn, mar.
Bo Pang and Lillian Lee. 2004. A sentimental education: Sentiment analysis using subjectivity summarization based on minimum cuts. InProceedings of the 42nd annual meeting on Association for Computational Lin-guistics, page 271. Association for Computational Lin-guistics.
Carl Edward Rasmussen. 2006. Gaussian processes for machine learning.
Sara Rosenthal, Preslav Nakov, Svetlana Kiritchenko, Saif M Mohammad, Alan Ritter, and Veselin Stoy-anov. 2015. Semeval-2015 task 10: Sentiment analy-sis in twitter.Proceedings of SemEval-2015.
Richard Socher, Alex Perelygin, Jean Y Wu, Jason Chuang, Christopher D Manning, Andrew Y Ng, and Christopher Potts. 2013. Recursive deep models for semantic compositionality over a sentiment treebank. In Proceedings of the conference on empirical meth-ods in natural language processing (EMNLP), volume 1631, page 1642. Citeseer.
Josef Steinberger, Mohamed Ebrahim, Maud Ehrmann, Ali Hurriyetoglu, Mijail Kabadjov, Polina Lenkova, Ralf Steinberger, Hristo Tanev, Silvia V´azquez, and Vanni Zavarella. 2012. Creating sentiment dictio-naries via triangulation. Decision Support Systems, 53(4):689–694.
Xiaolong Wang, Furu Wei, Xiaohua Liu, Ming Zhou, and Ming Zhang. 2011. Topic sentiment analysis in twitter: a graph-based hashtag sentiment classification approach. InProceedings of the 20th ACM interna-tional conference on Information and knowledge man-agement, pages 1031–1040. ACM.
Zhihua Zhang, Guoshun Wu, and Man Lan. 2015. Ecnu: Multi-level sentiment analysis on twitter using tradi-tional linguistic features and word embedding features.