Automatic Translation for Software with Safe Velocity
Dag Schmidtke
Microsoft E+D Global, Ireland
[email protected]
Declan Groves
Microsoft E+D Global, Ireland
[email protected]
Abstract
We report on a model for machine transla-tion (MT) of software, without review, for the Microsoft Office product range. We have deployed an automated localisation workflow, known as Automated Transla-tion (AT) for software, which identifies re-source strings as suitable and safe for MT without post-editing. The model makes use of string profiling, user impact assess-ment, MT quality estimation, and cus-tomer feedback mechanisms. This allows us to introduce automatic translation at a safe velocity, with a minimal risk to cus-tomer satisfaction. Quality constraints limit the volume of MT in relation to hu-man translation, with published low-qual-ity MT limited to not exceed 10% of total word count. The AT for software model has been deployed into production for most of the Office product range, for 37 languages. It allows us to MT and publish without review over 20% of the word count for some languages and products. To date, we have processed more than 1 million words with this model, and so far have not seen any measurable negative impact on customer satisfaction.
1
Introduction
The use of machine translation (MT) for localisation in Microsoft started in the late 1990s. We have two main use-cases: post-editing, and raw-MT publishing (publishing MT directly without review).
© 2019 The authors. This article is licensed under a
Crea-tive Commons 4.0 licence, no derivaCrea-tive works, attribution, CCBY-ND.Initially raw-MT publishing, in combination with use of translation memories (a process referred to internally as ‘recycling’), was limited to help content for technical audiences, but over the past five years it has become the dominant localisation model for both technical and end-user support documentation for Office. We now consider it proven for all support content types. Our content localisation workflow makes extensive use of customer listening and feedback systems, and recycling, to profile and balance the use of MT versus human translation optimally, while minimising impact on customer satisfaction (Schmidtke, 2016). More than 75% of all translation volume for Office content is now routed through a recycling and MT workflow (a process which we refer to internally as ‘AT’ or ‘Automatic Translation’), for up to 36 languages.
For software localisation, the translation of strings in the product UI, we have been using post-editing since 2012. The introduction of raw-MT into the software localisation process has however proven to be more complex than it was for content. The risks are greater, both with respect to potentially causing functional bugs in the product, and with respect to low quality translations negatively impacting the customer experience. This could, in the worst-case, lead to the loss of customers (Poor, 2018).
2
The Microsoft Office Software
Locali-sation System
Microsoft Office spans a number of products ranging from Office 365 Subscription, with Word, Excel, PowerPoint, Outlook, etc., to server prod-ucts like SharePoint, the Skype/Teams family, and a variety of other apps. There are about 50 sepa-rate products and services, released across a num-ber of platforms, including Win32/64, Mac/IOS, web and Android. Office 365 Subscription ships monthly, some products have more frequent re-leases.
The Office international team is responsible for localising the Office products into over 100 lan-guages and maintaining a continuous release ca-dence on par with the English language product. To accomplish this, we rely on an internal tools solution called Office Resource Fabric (ORF), which includes resource management (a resource here being any piece of text that is to be localised), localisation workflow, translation editor, and product build capabilities. The system supports large-scale continuous flow translation with vali-dation functionality. ORF is an Azure-hosted so-lution which supports direct extranet connectivity for translators worldwide.
We use a proprietary recycling component, which supports traditional TM as well as contex-tual match capabilities. Contexcontex-tual matches make use of metadata relating to resource, project and product information. This recycling component handles intricacies of different file formats, inter-nal mark-up and placeholders, and it is also the in-tegration point for MT. We have dedicated pre- and post-processing for software resources, and configurable support for calling Microsoft’s Cus-tom Translator1 domain-tuned neural MT models,
trained on TM data specific to Office.
We deal with large volumes on a continual ba-sis, on average approx. 2 million fully paid for words are translated across all languages per month. Total word counts processed and recycled are substantially higher; about 2 million resources are processed per month. The typical human trans-lation turnaround time is 48 hours.
3
AT for Software Model - Safe Velocity
The principal challenge in integrating a raw-MT workflow into the Office software localisation system is how we maintain safe velocity, that is how we apply MT optimally with minimal
1 https://www.microsoft.com/en-us/translator/
negative impact on customer experience and satisfaction (CSAT).
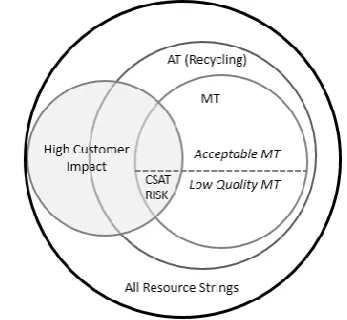
[image:2.595.326.500.250.410.2]As we strive to increase the volume of MT, some machine translated strings will invariably be of lower quality. Additionally, for all the strings we translate, some will be more important and vis-ible to the users than others and therefore will have a higher negative business impact if mis-translated. As we increase the use of MT, we need to minimise the intersection between low quality MT and high business impact strings, as this poses the greatest risk for negative CSAT impact (Figure 1).
Figure 1: Safe velocity model for AT for software The safe velocity approach we have adopted breaks down into three components: Confidence in Translation Quality: configuring the model to maximise the use of high quality TMs and apply MT to strings that are likely to translate well;
Business Impact: how visible and impactful the string would be to the user, and therefore an indi-cation of the impact of a poorly localised string; and Listening and Response: our ability to relia-bly and quickly detect, gather and respond to user feedback in relation to the customer experience of the localised product.
quality, both between languages, and between dif-ferent strings within the same language.
3.1 Confidence in Quality
For content localisation, lower MT quality in a specific language can be offset against increased reliance on recycling at an article level (Schmidtke, 2016). We cannot however directly balance recycling and MT within a single software resource string.
The translation unit for software is a resource string, and most of these are short (less than 5 words in length). However, we can use string length to inform raw-MT application.
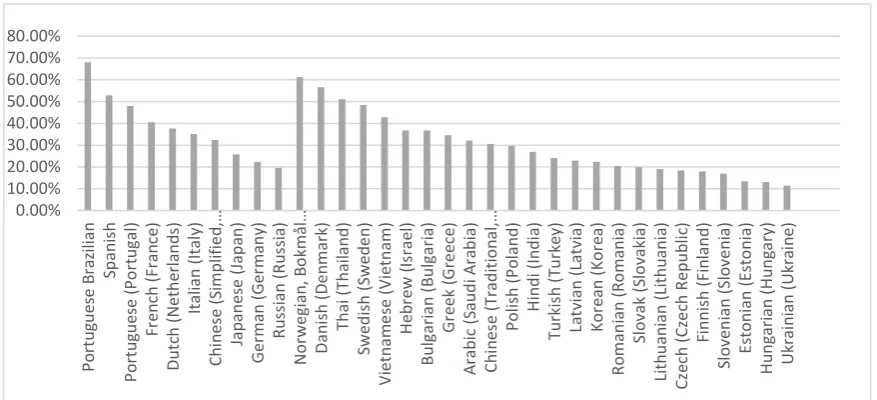
While most resource strings are short, most word count volume is concentrated in longer strings. For example, restricting raw-MT applica-tion to resource strings 10 words or longer leaves about 60% of word count in scope for raw-MT while short strings, which are more prevalent in ribbons, menus and dialogs (i.e. more visible), re-main human translated. Also, in line with other work on the use of MT in commercial settings, we have found that MT quality declines for very short strings (Levin et al., 2017). We have good data on MT quality by language, as we have large vol-umes of post-edited Office software strings and can calculate average TER scores per language (Snover et al., 2006). We have found that these scores correlate well with human judgements of MT acceptability, so we use TER as our primary automated MT eval metric. Our historical TER data when analysing post-edit triples (triples com-prise the source, MT and post-edited resource) is shown in Figure 2.
This data allows us to assess the impact MT will have on perceived language quality by our
customers. For some languages, like Brazilian-Portuguese, the quality of MT is quite high, whereas for others, the quality is more challeng-ing. We therefore need to tailor our MT model on a per-language basis.
Our main focus for quality management to date has been to build and deploy custom neural mod-els with Microsoft Custom Translator, which have given us a notable lift in translation quality over SMT, and also to deploy Quality Estimation, as further described in section 4 below.
3.2 Business Impact
For content articles, we have used page view statistics to identify where human translation should be prioritised. For software, resource us-age statistics would be very valuable, but unfor-tunately this data is only available to a limited extent. We have, however, used resource loading statistics to confirm our intuition that shorter strings do get loaded, and therefore seen, more often. This is another reason why managing raw-MT scope by string length is helpful.
[image:3.595.87.526.70.270.2]In addition, we use specific filters (known as AT exclusion rules) to remove known identifia-ble high business impact (HBI) strings from MT scope. These are strings where a low-quality translation would have a significant negative user impact, such as strings pertaining to important le-gal and licensing information. We also exclude marketing strings such as ‘What’s New’ that typ-ically require transcreation, adaptation, or more idiomatic rather than literal translation. We can filter out individual strings, specific resource files or larger projects with high proportions of HBI strings. 0.00% 10.00% 20.00% 30.00% 40.00% 50.00% 60.00% 70.00% 80.00% Po rt u gu es e B raz ili an Sp an is h Po rt u gu es e ( Po rt u gal) Fr en ch ( Fran ce ) Du tc h ( N eth erl an d s) Itali an ( Ital y) Ch in es e ( Si mp lifie d ,… Jap an es e ( Jap an ) G e rman ( G er ma n y) R u ss ian ( R u ss ia) N o rw eg ian , B o kmå l… Dan is h ( De n mark) Th ai (T h ail an d ) Sw ed is h ( Sw ed e n ) V ie tn am e se ( V ie tn am) H eb re w ( Is rae l) Bul gari an ( Bul gari a) G re ek (Gr e ec e) A rab ic ( Sau d i A ra b ia) Ch in es e ( Trad iti o n al,… Po lis h ( Po lan d ) H in d i ( In d ia) Tu rk is h ( Tu rk ey) La tv ian ( Latvia) Ko re an ( Ko re a) R o man ian ( R o man ia) Sl o vak ( Sl o vakia) Li th u an ian ( Li th u an ia ) Cz ec h ( Cz e ch R ep u b lic ) Fi n n is h ( Fi n lan d ) Sl o ve n ian ( Sl o ve n ia) Es to n ian ( Es to n ia ) H u n gari an ( H u n gary) Uk rai n ian ( Uk ra in e)
3.3 Customer Feedback
The risk introduced by shipping low quality MT can be mitigated by paying careful attention to customer feedback. Users ultimately provide the most important measure of localisation quality and success of the localisation effort. If we can de-tect and respond to customer feedback quickly, we can minimise the negative impact of a bad trans-lation.
We use two primary feedback mechanisms to measure the impact of MT and user perceptions of linguistic quality in general. The first is a Mi-crosoft-specific language quality metric called Net Language Quality Score (NLQS), similar to Net Promotor Score (NPS), which allows us to track overall language quality satisfaction. The second is customer verbatim feedback, that is the ability of customers to report on specific issues, through different mechanisms such as ‘Send a Smile’2.
An ideal scenario for customer feedback is if we could get feedback early enough, and of suffi-cient volume, so that we can reliably measure the actual user impact of MT and also address any is-sues before reaching a large audience. If users also provide suggestions for improvement, validated by a user community, we come close to a self-reg-ulating system. Preferably users should also be able to comment and suggest improvements to translations directly in the product user interface.
We have considered how we might be able to expand Office customer feedback mechanisms in this direction. This is however a hard challenge, especially given the broad range of products and platforms in Office, and we have only made lim-ited progress in this area thus far.
4
Quality Estimation for MT
With the challenges of limited customer feedback mechanisms and the variable nature of MT quality, we need a reliable and automated way of ensuring that the MT that we do publish directly into the product does not fall below an agreed acceptable translation quality level. TER allows us to monitor MT quality after the fact for post-edited strings, but this information is not available to the model at runtime. Sentence-level quality estimation (QE), therefore, presents itself as an interesting solution.
2
https://www.microsoft.com/en-us/microsoft- 365/blog/2012/08/03/got-feedback-send-a-smile-or-a-frown/
QE has a long history in MT research (Ueffing and Ney, 2007, Specia et al., 2009, 2010, 2015; Callison-Burch et al., 2012; Luong et al., 2014;). More recently, there have been encouraging ex-amples of successful use of QE in commercial scenarios (e.g. Martin et al, 2017, Astudillo et al., 2018). We began investigating QE in 2016, spe-cifically for the AT for software use-case. For our particular scenario we are less interested in the discrete quality of the MT string but more so in the ability to use QE as a binary decision mecha-nism to determine whether an MT string is ‘good enough’ to be published without human review. In this way QE can act as a filter to help us manage the volume of acceptable vs low quality MT we choose to allow through the system by calibrating based on the precision of the model.
Despite recent advances in neural-based ap-proaches to QE (Patel and M, 2016; Kim et al., 2017; Martins et al., 2017; Jhaveri et al., 2018), our QE implementation was based initially on the QuEst++ framework (Specia et al., 2015) which we have significantly augmented, including ex-tending the feature set and developing a sophisti-cated pre-processing, training and deployment pipeline. Our automated pipeline includes data ex-traction, normalisation, feature exex-traction, data sampling, model training, tuning and publishing the model as a service in Azure. The choice of a feature-based approach provides us with the abil-ity to efficiently scale to support many languages and to provide an efficient QE service that has negligible impact on our overall workflow effi-ciency.
For training our QE models, we used large vol-umes of historical post-edited MT. When selecting our training data, we ensure a balanced distribu-tion of MT quality ranges (based on TER scores) in order to avoid overfitting, resulting in training sets of approx. 75k samples per language. We used cross-validation for parameter tuning and evalu-ated on a held-out test set of between 20-30K strings (depending on language). This held out test set contains a distribution of TER scores that re-flect what we are likely to see in production for the language, thus giving us the most accurate pre-diction of the performance of the deployed mod-els.
acceptable MT, with a precision that exceeded the average TER acceptance rate in post-editing, for at least 5 languages. Based on these findings we continued scaling to more languages. QE also gives us substantially greater confidence in avoid-ing very low-quality MT stravoid-ings (TER >0.7). A snapshot of area under the curve (AUC) and root mean square error (RMSE) results for 10 QE lan-guages is provided in Table 1.
Language AUC RMSE
Portuguese Brazilian 0.6763 0.3031
Spanish 0.6659 0.2935
Japanese 0.7065 0.2774
French 0.6976 0.2825
Dutch 0.6984 0.2974
German 0.7116 0.2729
Italian 0.6931 0.3122
[image:5.595.308.517.395.523.2]Chinese (Simplified) 0.7008 0.2997
Table 1: AUC and RMSE scores for QE models, when TER of 0.3 is set as the decision boundary of acceptable vs un-acceptable MT
4.1 QE Model Calibration for Safe Velocity
We use QE within our AT for software work-flow by choosing a QE pass threshold on a per-language basis, based on a balanced approach be-tween the model’s precision and throughput (the volume of words the QE model will pass) as cal-culated over the held-out evaluation set. Our goal, in line with our safe velocity approach, is to max-imise the overall volume of raw MT that we pub-lish, therefore we take into account a model ‘error tolerance’ when selecting the optimal QE thresh-old. We choose a value that will maximise the vol-ume of acceptable MT the model will pass while also passing a certain percentage of low quality MT. This error tolerance is chosen by considering what percentage of translation errors we typically see with our human/post-edited translations based on historical linguistic reviews. Based on this analysis we have set 10%, on average, to be the volume of words of low-quality MT that we are comfortable with releasing, on a per language ba-sis.
5
The AT for Software String Lifecycle
The AT for software workflow brings all the elements of our model together.
3 100% matches constitute perfect TM matches; 99%
are matches that differ only in punctuation or capitalisation.
5.1 Translation Workflow
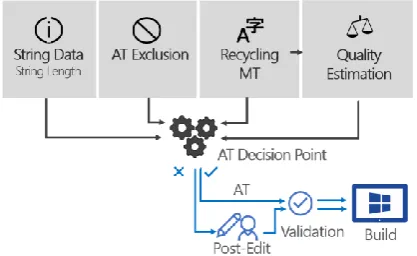
All new or updated strings first go through re-cycling and custom domain MT. A QE score is generated based on the QE model deployed and configured for the specific language and product.
Next, at the AT decision point, rules determine if the string translation fits the criteria to be pub-lished as AT:
1. Context match recycling
2. Long 100% match and no AT exclusion 3. Long 99% match and no AT exclusion 4. QE Pass & over length threshold & no AT
exclusion
For long 100% and long 99% matches3, recycled
strings with a word count of 10 words or longer do not need a review for correctness in context. AT Exclusion is as described in Section 3.2. QE Pass means that the QE score is over the threshold calibrated as per Section 4.1. If the string passes the rule checks, it will be set to AT, and by-pass post-editing. It is still subject to validation, includ-ing placeholder and markup checks, and geopolit-ical sensitive string checks. See Figure 3 for a high-level overview of the workflow.
Figure 3. ORF AT for Software decision point workflow
5.2 User Validation and Feedback Channels
Office builds go through several stages of user validation. First are daily ‘dogfood’ builds, for Microsoft-internal staff. A second stage consists of insiders, users that are signed up to see new builds early. If builds pass insider stages, they progress to general release. For the main Office 365 product, this takes about a month. Feedback channels are open through these rings of validation, and any issues, functional or linguistic, can be reported.
Once the build is fully deployed to the general public, we monitor feedback channels via our
internal feedback classification system (Bentley and Batra, 2016), which also tracks feedback for international releases. In addition, we organise regular surveys to gather targeted linguistic qual-ity feedback.
Through these mechanisms, we can detect and react to user reports on linguistic quality issues. However, such feedback remains rare in relation to the overall volume of customer feedback.
6
Results: AT for Software in Production
We enabled the AT for software workflow in May 2018, and we have now enabled 90% of the Office product line. Our workflow is highly configurable; we started out with conservative settings, to validate the model and feedback channels. The QE models have proven to be reliable, even as we have moved from statistical to neural MT. This is likely down to the general nature of our software strings which remain similar over time and that the output of our neural MT systems, although offering significant improvements for a number of languages (Hassan et al., 2018), are not so different from SMT as to impact the ability for QE to provide accurate predictions of translation quality.
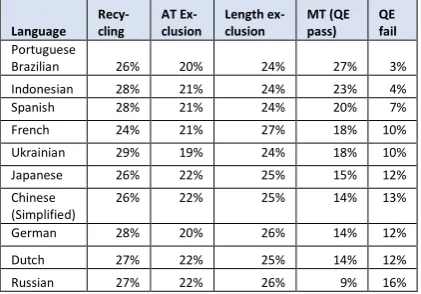
We use word count volumes as a key measure of success in terms of business value. The transla-tion volume in scope for MT in our system, when allowing for recycling, and taking length-based and AT exclusion into account, is in the order of 30-40% of total translation word count.
The volume of MT we ship without post-edit-ing is regulated by QE. It varies between 10% and 30%, depending on the language. Table 2 shows data for selected languages from May 2019. In this table we show recycling, exclusion, MT volume (QE Pass), and QE fail, which is the portion not passed by QE, e.g. when the QE score does reach the calibrated threshold. The volume of MT varies between 27% for Brazilian and 9% for Russian. This reflects the variation in MT quality in line with our historical data as shown in Figure 1, and the calibration chosen for QE, to ensure low qual-ity MT is kept to at, or, below 10%.
So far, we have received very few negative lin-guistic feedback comments related to the MT ef-fort, and our overall customer satisfaction metrics have not been negatively impacted.
The total MT wordcount for May 2019 was over 250,000 words, across 37 languages enabled for AT for software, and so far we have machine
4 https://www.adaptcentre.ie
translated and shipped over 1 million words with this model.
Language Recy-cling
AT Ex-clusion
Length ex-clusion
MT (QE pass)
QE fail Portuguese
Brazilian 26% 20% 24% 27% 3% Indonesian 28% 21% 24% 23% 4%
Spanish 28% 21% 24% 20% 7%
French 24% 21% 27% 18% 10%
Ukrainian 29% 19% 24% 18% 10%
Japanese 26% 22% 25% 15% 12%
Chinese (Simplified)
26% 22% 25% 14% 13%
German 28% 20% 26% 14% 12%
Dutch 27% 22% 25% 14% 12%
[image:6.595.305.516.104.251.2]Russian 27% 22% 26% 9% 16%
Table 2: Translation numbers for May 2019.
7
Future Work
In terms of future work, we are planning to improve the QE component by moving to neural QE. Preliminary investigations have shown that neural QE models can lead to average AUC improvements of between 10-20%, relative depending on language. As the overall model matures and is proven in production, we plan to increase the MT scope, by adjusting length thresholds and also reviewing the percentage of low-quality MT allowed. We also hope to revisit and grow customer listening and feedback by
leveraging advanced crowd engagement
solutions. As Microsoft Custom Translator continues to improve, we expect to further increase raw-MT volumes.
Challenges remain in specific areas of transla-tion, such as terminology and branding, but there has been some promising work recently in this area (Chatterjee et al., 2017; Hasler et al., 2018). We plan to investigate improved term translation solutions, including contextual disambiguation. Additionally, we are partnering with ADAPT4 in
relation to understanding MT impact on software usability via telemetry (Guerberof 2018).
Acknowledgements
References
Michael Bentley, and Soumya Batra. 2016. Giving Voice to Office Customers: Best Practices in How Office Handles Verbatim Text Feedback. In 2016 IEEE International Conference on Big Data (Big Data), pp. 3826-3832. IEEE, 2016.
Chris Callison-Burch, Philipp Koehn, Christof Monz, Matt Post, Radu Soricut, and Lucia Specia. 2012. Findings of the 2012 workshop on Statistical Ma-chine Translation. In Proc. WMT 2012.
Rajen Chatterjee, Matteo Negri, Marco Turchi, Mar-cello Federico, Lucia Specia, and Frederic Blain. 2017. Guiding neural machine translation decoding with external knowledge. In Proceedings of the Sec-ond Conference on Machine Translation, Volume 1: Research Papers, pages 157–168, Copenhagen, Denmark. Association for Computational Linguis-tics.
Ana Guerberof, 2018, Correlations between localisa-tion quality and usability on machine and human translated user interface strings: a study using eye-tracking and telemetry, poster presented at the 12th annual Irish Human Computer Interaction confer-ence 2018, Limerick, Ireland.
Eva Hasler, Adrià De Gispert, Gonzalo Iglesias, and Bill Byrne. 2018. Neural Machine Translation De-coding with Terminology Constraints. 2018. In Pro-ceedings of the 2018 Conference of the North Amer-ican Chapter of the Association for Computational Linguistics: Human Language Technologies, Vol-ume 2 (Short Papers), pages 506-512. New Orleans. Hany Hassan, Anthony Aue, Chang Chen, Vishal Chowdhary, Jonathan Clark, Christian Federmann, Xuedong Huang, Marcin Junczys-Dowmunt, Will Lewis, Mu Li, Shujie Liu, Tie-Yan Liu, Renqian Luo, Arul Menezes, Tao Qin, Frank Seide, Xu Tan, Fei Tian, Lijun Wu, Shuangzhi Wu, Yingce Xia, Dongdong Zhang, Xhirui Zhang, and Ming Zhou. 2018. Achieving Human Parity on Automatic Chi-nese to English News Translation. Computing Re-search Repository, arXiv:1803.05567.
Nisarg Jhaveri, Manish Gupta, and Vasudeva Varman. 2018. Translation quality estimation for indian lan-guages. In Proceedings of the 21st International Conference of the European Association for Ma-chine Translation (EAMT), pages 159-168. Ali-cante, Spain.
Hyun Kim, Jong-Hyeok Lee, and Seung-Hoon Na. 2017. Predictor-estimator using multilevel task learning with stack propagation for neural quality estimation. In Proceedings of the Second Confer-ence on Machine Translation (WMT), pages 562– 568, September.
Pavel Levin, Nishikant Dhanuka, and Maxmim Kha-lilov. 2017. Machine Translation at Booking.com:
Journey and Lessons Learned. In Proceedings of the 20th International Conference of the European As-sociation for Machine Translation (EAMT), pages 80–85. Prague, Czech Republic.
Ngoc-Quang Luong, Laurent Besacier, and Benjamin Lecouteux. 2014. LIG system for word level QE task at WMT14. pages 335–341. Baltimore, USA. André F.T. Martins, Marcin Junczys-Dowmunt, Fabio
N. Kepler, Ramn Astudillo, Chris Hokamp, and Ro-man Grundkiewicz. 2017. Pushing the limits of translation quality estimation. Transactions of the Association for Computational Linguistics, 5:205– 218.
Raj Nath Patel and Sasikumar M. 2016. Translation quality estimation using recurrent neural network. In Proceedings of the First Conference on Machine Translation (WMT), pages 819–824. Berlin, Ger-many.
Mirko Plitt, and F, Masselot. 2010. A Productivity Test of Statistical Machine Translation Post-Editing in a Typical Localisation Context. The Prague Bulletin of Mathematical Linguistics, 93:7–16.
Glen Poor. 2018. Use more Machine Translation and Keep Your Customers Happy. Commercial Keynote at AMTA 2018, Boston
Dag Schmidtke. 2016. Large scale Machine Transla-tion publishing, with acceptable quality, for Mi-crosoft Support content. Paper presented at AMTA 2016 Workshop on Interacting with Machine Trans-lation (MT 2016). Austin.
Dag Schmidtke. 2018. MT Tresholding: Achieving a defined quality bar with a mix of human and ma-chine translation. Paper presented at AMTA 2016 Users Track, Austin.
Matthew Snover, Bonnie Dorr, Richard Schwartz, Linea Micciulla, and John Makhoul. 2006. A study of translation edit rate with targeted human annota-tion. In Proceedings of AMTA, pages 223– 231, Boston, MA. Association for Machine Translation in the Americas.
Lucia Specia, Marco Turchi, Nicola Cancedda, Marc Dymetman and Nello Cristianini 2009. Estimat-ingthe Sentence-Level Quality of Machine Transla-tion Systems. In Proceedings of the 13th Annual Conference of the EAMT, pages 28-35. Barcelona, May 2009
Lucia Specia, Dhwaj Raj, and Marco Turchi. 2010. Ma-chine translation evaluation versus quality estima-tion. Machine Translation, 24(1):39–50.