A land evaluation model for irrigated crops using
multi-criteria analysis.
ABUSHNAF, Farag.
Available from Sheffield Hallam University Research Archive (SHURA) at:
http://shura.shu.ac.uk/19197/
This document is the author deposited version. You are advised to consult the
publisher's version if you wish to cite from it.
Published version
ABUSHNAF, Farag. (2014). A land evaluation model for irrigated crops using
multi-criteria analysis. Doctoral, Sheffield Hallam University (United Kingdom)..
Copyright and re-use policy
See
http://shura.shu.ac.uk/information.html
i Learning ana information Services 1 Adsetts Centre, City Campus
Sheffield SI 1WD
1 0 2 0 4 0 93 2 0
ProQuest Number: 10694077
All rights reserved INFORMATION TO ALL USERS
The quality of this reproduction is dependent upon the quality of the copy submitted. In the unlikely event that the author did not send a com plete manuscript and there are missing pages, these will be noted. Also, if material had to be removed,
a note will indicate the deletion.
uest
ProQuest 10694077
Published by ProQuest LLC(2017). Copyright of the Dissertation is held by the Author.
All rights reserved.
This work is protected against unauthorized copying under Title 17, United States C ode Microform Edition © ProQuest LLC.
ProQuest LLC.
789 East Eisenhower Parkway P.O. Box 1346
A Land Evaluation Model for Irrigated Crops using
Multi-Criteria Analysis
Thesis submitted in partial fulfilment of requirements of Sheffield
Hallam University for the degree of
Doctor of Philosophy
By
Farag Abushnaf
Abstract
A Land Evaluation Model for Irrigated Crops using Multi-Criteria Analysis
Acknowledgements
I am most thankful to Almighty Allah for giving me the patience and making it possible for me to produce this work. I am grateful to many people for their help and assistance both directly and indirectly.
I would like to thank my supervisors Dr Kevin Spence and Prof Ian Rotherham for their encouragement guidance and their valuable comments they have given me in all aspects of this research. Thanks also go out to all office staff in unit 9 for their assistance.
A special thanks to my brothers Jamal, Ramadan Jetlawi and, Aboalsalam Algomati for their support and encouragement throughout the period of my study.
I would also like to thank my sisters, my wife Reem, my daughter Sara, my son Ahmed for their prayers, understanding and tolerance during the course of the study.
Abbreviations and Acronyms
AHP Analytical Hierarchy Process
AIJ Aggregate Individual Judgment
AIP Aggregate Individual Priority
ALC Agricultural Land Classification
ALES American Land Evaluation System
ARC Agricultural research centre
CIA Central Intelligence Agency
CLI Canada Land Inventory
CR Consistency Ratio
ESRI Earth Systems Research Institute
FAO Food and Agriculture Organisation
FAOSTAT Food and Agriculture Organisation Statistics
FCC Fertility Capability Classification of Sanchez
GIS Geographic Information Systems
GMRP Great Man-Made River Project
GWA Groundwater Authority
GAHP Group of Analytical Hierarchy Process
LCs Land Characteristics
LCAS Land Capability for Agriculture in Scotland
LCC Land Capability Classification
LUCIE Land-use Capability Investigation and Evaluation
LUTs Land Utilisation Types
LQs Land Qualities
MCDA Multi-Criteria Decision Analysis
MCDM Multi-Criteria Decision Making
MCE Multi-Criteria Evaluation
PCM Pairwise Comparison Matrix
ICARDA International Centre for Agricultural Research in the Dry Areas
UNESCO United Nations Education Scientific and Cultural Organisation
UN-Habitat United Nations Habitat
UNICEF United Nations Children’s Fund
USBR United States Bureau for reclamation
USD A United States Development Agency
WLC Weighted Linear Combination
Table of Contents
ABSTRACT...i
Dedication...ii
Acknowledgements...iii
ABBREVIATIONS AND ACRONYMS... iv
TABLE OF CONTENTS... v
LIST OF FIGURES... xi
LIST OF TABLES... xiv
CHAPTER O N E ... 1
INTRODUCTION... 1
1.1 Research Problem...1
1.2 Land Suitability Evaluation in the Study A rea... 3
1.3 Research Questions...5
1.4 Research Aim and Objectives... 5
1.5 Thesis Structure...6
CHAPTER T W O ... 8
RESEARCH CONTEXT...8
2.1 Introduction...8
2.2 Physical Landscape... 8
2.2.1 Climatic Conditions... 11
2.2.2 Population... 14
2.3 Soil Resources... 15
2.3.1 Soil Erosion...17
2.4 Water Resources and Management...18
2.4.1 Water Demand and Supply... 19
2.5 Libyan Economy... 23
2.6 Agricultural Production... 24
2.7 Summary...25
CHAPTER THREE...27
3.1 Introduction...27
3.2 Land Evaluation: Definition and Explanation... 27
3.3 The Need for Land Evaluation... 30
3.4 Land Evaluation and Land Use Planning...31
3.5 Terminology, Types and Logic of Land Evaluation...33
3.5.1 Land Capability and Land Suitability Classification... 35
3.5.2 Physical and Integral Land Evaluation...36
3.5.3 Direct and Indirect Land Evaluation...37
3.5.4 Qualitative and Quantitative Land Evaluations...38
3.6 Calculation Logic for Land Evaluation...41
/V 3.6.1 Boolean Logic ...41
3.6.2 Fuzzy Logic...41
3.7 Summary... 42
CHAPTER FOUR...44
APPROACHES TO LAND EVALUATION METHODS...44
4.1 Introduction...44
4.2 Mathematical Yield Correlations... 45
4.2.1 Simple Mathematical Correlations...45
4.2.2 Complex Formulae... 46
4.3 Parametric Approaches... 47
4.3.1 Categoric Land Capability Classifications... 48
4.4 Country Based Land Evaluation Systems...49
4.4.1 The USDA Land Capability System...49
4.4.2 The Canada Land Inventory (CLI)... 50
4.4.3 Land Capability Assessments in Britain... 51
4.4.4 The Land Capability for Agriculture in Scotland (LCAS)... 52
4.4.5 The Land Classification for England and Wales (LCEW)... 53
4.5 Computerised Land Evaluation Systems... 54
4.6 Special Purpose Evaluation Systems... 55
4.6.1 The US Bureau of Reclamation (USBR) System...55
4.6.2 The Fertility Capability Classification of Sanchez...56
4.6.3 Agro-ecological Zonation: FAO Agro -ecological zone (AEZ)...57
4.7 The FAO System of Land Evaluation... 58
4.8 Summary... 64
CHAPTER FIVE... 65
LAND SUITABILITY ANALYSIS USING GIS AND MULTI-CRITERIA EVALUATION... 65
5.1 Introduction... 65
5.2 Multi Criteria Decision Making (MCDM) for Land Suitability Evaluation 65 5.2.1 Integration of Multi-Criteria Evaluation (MCE) Techniques with GIS...67
5.3 Boolean Logic and its Application in Land Evaluation...69
5.4 Fuzzy Set Theory...73
5.4.1 Fuzzy Logic vs. Boolean Logic... 74
5.4.2 Fuzzy Sets Membership Functions... 77
5.5 Methods for Deriving Weight... 81
5.5.1 Ranking Methods...82
5.5.2 Rating Methods...82
5.5.3 Trade-off Analysis Method...83
5.6 Analytical Hierarchy Process (AHP)...83
5.6.1 Applications of the AHP Method in Land Evaluation...89
5.6.2 AHP _ Group Method and Member Weights... 92
5.7 GIS and Overlay Techniques... 94
5.7.1 Weighted Overlay Analysis for Land Suitability Evaluation... 96
5.8 Summary... 99
CHAPTER SIX...101
RESEARCH METHODOLOGY... 101
6.1 Introduction... 101
6.2 Data Requirement and Data Collection...101
6.3.1 Climate and Soil Information of Study Area... 105
6.4 Land Suitability Assessment in the Study area... 108
6.4.1 Land Utilisation Types in the Study Area... 109
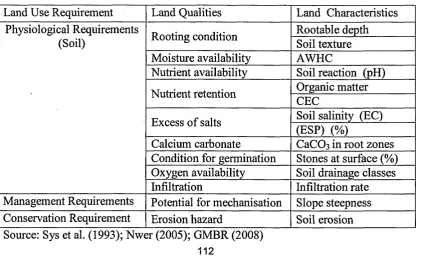
6.4.2 Land Qualities and Land Characteristics in the Study Area...112
6.5 Building GIS Database...114
6.6 Deriving Weights for Land Characteristics for Selected Crops... 114
6.6.1 Multi-criteria decision analysis... 114
6.6.2 Hierarchy Development...115
6.6.3 Pairwise Comparison Matrices... 119
6.6.4 Group Pairwise Comparison Matrices...121
6.7 Fuzzy Set theory...124
6.8 Land Evaluation Models for the Study Area...129
6.8.1 Model 1 (Existing Land Evaluation Model)... 129
6.8.2 Model 2 (Weighted Overlay Summation-AHP)...129
6.8.3 Model 3 (Fuzzy - AHP)...130
6.9 Maps Comparison...131
6.9.1 The CROSSTAB Matrix...131
6.9.2 Kappa Statistic...132
6.10 Validation of the Models...132
6.11 Summary...137
CHAPTER SEVEN... 138
RESULTS... 138
7.1 Introduction... 138
7.2 Weighting Results...138
7.3 Modelling Land Suitability for Wheat and Barley... 141
7.3.1 Model 1 (Boolean) Land Suitability for Barley and Wheat... 141
7.3.2 Model 2 (AHP) Land Suitability for Barley and Wheat... 144
7.3.3 Model 3 Land Suitability for Barley and Wheat... 147
7.4. Result Summary and Comparison...150
7.4.1 Comparison of Results... 151
7.5 Comparisons of Model Outputs and Level of Agreement for Barley...152
7.5.1 Results of Crosstab Model for Barley...153
7.5.2 Model 1 Map vs. Model 2 Map... 153
7.5.3 Model 1 Map vs. Model 3 Map... 155
7.5.4 Model 2 Map vs. Model 3 Map... 157
7.6 Comparison of the Models and Level of Agreement for Wheat...158
7.6.1 Results of Crosstab Model for Wheat...159
7.6.2 Model 1 Map vs. Model 2 Map... 160
7.6.3 Model 1 Map vs. Model 3 Map... 161
7.6.4 Model 2 Map vs. Model 3 Map... 163
7.7 Models validation...165
7.7.1 Results of Field Visit... 165
7.7.2 Results of Validation... 167
7.8 Summary... 171
CHAPTER EIGHT... 173
DISCUSSION OF RESULTS ...173
8.1 Introduction... 173
8.2 Discussion of Model 1 ... 173
8.3 Discussion of Model 2 ...177
8.4 Model 3 Discussion...181
8.5 Summary...184
CHAPTER NINE... 186
CONCLUSIONS AND RECOMMENDATIONS...186
9.1 Introduction...186
9.2 General Conclusions...187
9.3 Recommendations and future work...192
BIBLIOGRAPHY... 195
APPENDICES... 210
List of Figures
Figure 2.1: Map of Libya...9
Figure 2.2: Climatic conditions in Libya, 1960-2012... 12
Figure 2.3: Libyan population 1950-2050...14
Figure 2.4: Agriculture and municipal water demand in Libya... 20
Figure 2.5: The five phases of the Great Man-Made River Project... 22
Figure 3.1: Process of land evaluation...Error! Bookmark not defined. Figure 3.2: Response curve of single-factor systems...40
Figure 5.1: Integration of Multi-Criteria Evaluation (MCE) with GIS ...68
Figure 5.2: Representation of Boolean sets and Fuzzy sets... 75
Figure 5.3: Typical presentation of crisp sets and fuzzy sets... 76
Figure: 5.4: Bell-shaped or Gaussian membership functions... 78
Figure: 5.4a: Symmetrical fuzzy membership functions... 78
Figure: 5.4b: Asymmetrical left and right fuzzy membership functions...79
Figure 5.5: Triangular fuzzy membership function...79
Figure: 5.5a: Trapezoidal (Symmetrical) fuzzy membership function...80
Figure: 5.5b: Trapezoidal (asymmetrical left and right)... 80
Figure 5.6: An AHP hierarchy structure...84
Figure 5.7: Overall land suitability overlay... 97
Figure 6.1: The research process...102
Figure 6.2: Selected study area...105
Figure 6.3: Benghazi Mean Monthly Temperature from 1973-2010... 106
Figure 6.4 Soil Map for study area... 108
Figure 6.5: Hierarchical structure for agricultural land suitability in study area 116 Figure 6.6: Symmetrical fuzzy membership function...125
Figure 6.7: Asymmetrical left fuzzy membership function... 126
Figure 6.8: Asymmetrical right fuzzy membership function... 126
Figure 6.9: Asymmetrical left fuzzy mempership for catogrical data...127
Figure 6.10: land cover map for studyarea...136
Figure 7.1 Model 1 proportions of suitability classes for barley...142
Figure 7.2 Spatial distribution using model 1 of suitability classes for barley...142
Figure 7.3 Model 1 proportions of suitability classes for wheat...143
Figure 7.4 Spatial distribution using model 1 suitability classes for wheat... 143
Figure 7.5 Model 2 proportions of suitability classes for Barley...144
Figure 7.6 Spatial distribution using model 2suitability classes for barley... 145
Figure 7.7: Model 2 proportions of suitability classes for wheat...146
Figure 7.8 Spatial distribution using model 2 suitability classes for wheat...146
Figure 7.9: Model 3 proportions of suitability classes for barley...147
Figure 7.10 Spatial distribution using model 3 suitability classes for barley...148
Figure 7.11: Model 3 proportions of suitability classes for wheat...149
Figure 7.12 Spatial distribution using model 3 suitability classes for barley...150
Figure 7.13: Level of agreement and disagreement between suitability classes (model 1 vs. model 2) for barley...155
Figure 7.14: Level of agreement and disagreement between suitability classes (model 1 vs. model 3) for barley... 156
Figure 7.15: Level of agreement and disagreement between suitability classes (model 2 vs. model 3) for barley 158 Figure 7.16: Level of agreement and disagreement between suitability classes (model 1 vs. model 2) for wheat... 161
Figure 7.17 : Level of agreement and disagreement between suitability classes (model 1 vs. model 3) for wheat... 163
Figure 7.18: Level of agreement and disagreement between suitability classes (model 2 vs. model 3) for wheat... 164
Figure 7.19: Linear regression between land suitability index obtained with model 1 and observed irrigated barley yield in study area... 168
List of Tables
Table 2.1: Major water basins of Libya in million cubic meters per year... 18
Table 2.2: Water Demands forecasts in Libya, 2006-2020... 23
Table 2.3: Total agricultural production in Libya in 2007... 25
Table 4.1: Comparison of various land evaluation Systems... 63
Table 5.1: Scale for pairwise comparison ... 85
Table 5.2: Random Consistency Index (RI)...87
Table 5.3: Steps for the pairwise comparison method...87
Table 5.4: Step 5(a) of the pairwise comparison method...88
Table 5.5: Step 5(b) of the pairwise comparison method...88
Table 5.6: Comparison of the methods used for estimating weights...89
Table 6.1: classification of the soils of the study area...107
Table 6.2a: Definition and description of LUT1 (Barley) in the study area...I ll Table 6.2b: Definition and description of LUT2 (Wheat) in the study area... 112
Table 6.3: Land use requirement, LQ and LC in the study area... 112
Table 6.4a: Land suitability classes and their threshold values for barley... 113
Table 6.4b: The Land suitability classes and their threshold values for wheat...113
Table 6.5: Second-level pairwise comparison matrices and weights...120
Table 6.6: The result of weighting for Level 2 (criteria) of hierarchical for barley and wheat generated by local experts...120
Table 6.8: Third-level Pairwise Comparison Matrix and weights for barley generated by local expert 1... 121
Table 6.9: Derived weighting for Level 3 (Sub-criteria) of hierarchical for barley generated by local experts... 121
Table 6.10: Group pairwise comparison matrix and resulting weight for Level 2 criteria of hierarchical for barley and wheat...122
Table 6.11: Group pairwise comparison matrix and resulting weight for Level 2 criteria of hierarchical for barley...123
Table 6.13: Group pairwise comparison matrix and resulting weight for Level 2
criteria of hierarchical for wheat... 123
Table 6.14: Weighting for each level of hierarchical and overall weight for each land characteristics for barley... 123
Table 6.15: Weighting for each level of hierarchical and overall weight for each land characteristics for wheat... 124
Table 6.16: Types of fuzzy set models and their use to calculate membership functions for each land characteristic for barley crop...127
Table 6.17: Types of fuzzy set models and their use to calculate membership functions for each land characteristic for wheat crop...128
Table 7.1: The result of weighting for Level 2 (criteria) of hierarchy for barley and wheat generated by local experts and GAHP...139
Table7.2: Derived weighting for Level 3 (Sub-criteria) of hierarchy for barley generated by local experts... 140
7.3: Derived weighting for Level 3 (Sub-criteria) of hierarchy for wheat generated by local experts... 140
Table 7.4: Weights for barley and wheat...141
Table 7.5: The results of three Models for barley...151
Table 7.6: The results of three Models for wheat...151
Table 7.7: Summarises the comparison between land suitability models for barley 153 Table 7.8: Crosstab Matrix for Barley. Model 1 vs. Model 2 ... 154
Table 7.9: Crosstab Matrix for Barley. Model 1 vs. Model 3 ... 155
Table 7.10: Crosstab Matrix for Barley. Model 2 vs. Model 3 ... 157
Table 7.11: Summaries of the comparison between land suitability models for wheat ... 159
Table 7.12: Crosstab Matrix for Wheat Model 1 vs. Model 2 ... 160
Table 7.13: Crosstab Matrix for Wheat. Model 1 vs. Model 3 ... 161
Table 7.14: Crosstab Matrix for Wheat. Model 2 vs. Model 3 ... 164
Chapter One
Introduction
1.1 Research Problem
In many countries, land resources are being used with an increasing intensity to meet the needs of growing populations. Increasing demands for food and increasing material expectations have led to the urgent need for the optimisation of land resources (Kutter et al., 1997). According to the Food and Agriculture Organisation (FAO) (1993), land use planning involves making decisions regarding the use of land resources with the primary aim of achieving the best use of land for maximum food production and profit. This is often driven by the needs of future generations in terms of productivity and environmental sustainability. However, sustainable land management in agriculture is a very complex and challenging concept, encompassing biophysical, socioeconomic and environmental issues that must be viewed as part of an integrated system (FAO, 1976; 1985; 2002). Therefore, effective land management information and land evaluation are prerequisites to achieving optimum utilisation of available land resources for agricultural production of particular importance to developing countries (Dale and McLaughlin, 1988; Nwer, 2005). Libya is one of these developing countries whose most important present-day agricultural policies are to use available land and water resources for the maintenance of food security, as evidenced in the man-made river and irrigation project (ARC, 2000; GMRP, 2008).
Furthermore, the most current and future challenge facing the development of agriculture is how to ensure the sustainability of land resources through efficient exploitation of what is available. Again, due to rapidly increasing population and urbanisation, arable land needs to be evaluated in order to achieve self-sufficiency and reduce vulnerability to food insecurity (FAO, 2011). This is particularly relevant
for the two main areas of human settlement and food production in Libya’s Jeffara and Benghazi regions, which both have significant human and natural resources (Ben Mahmoud, 1995; Ben Mahmoud et al., 2000; GMRP, 2008). These regions are targeted to receive water from the southern aquifers (Al Kufrah, Al Sarrir and Fazzan) through a network of concrete pipes. According to GMRP (1990), the main objective of Libyan agricultural policy in this region is to create all year round irrigation projects for the production of food and cash crops (e.g. barley, wheat and maize). However, currently the contribution of crops to the local economy also remains substantially low, with potential for future increases when suitable land suitability methods are developed and adopted. To sustain agricultural production, special attention needs to be given to spatial models that can illustrate stronger linkages between data derived from land characteristics and crop yields, which can predict land suitability for crop production on specified farmland management in the Libyan context. Similarly, Al-Mashreki et al. (2011) suggest that increasing food production for self-sufficiency and national economic growth could be met through systematic survey of the soils, evaluating land use options and formulating land use plans based on local peculiarities, but which are viable economically, socially acceptable and environmentally friendly.
In addition to the previous works undertaken by Nwer (2005) and Elaalem (2010), this thesis used GIS-based multi-criteria decision making (MCDM) of fuzzy logic and the Analytical Hierarchy Process (AHP) to identify and map optimal land suitability for barley and wheat crop production in the Benghazi region of Libya. Section 1.2 shows previous works that have developed land evaluation models for a number of cash crops in the Benghazi and Jeffara region of Libya.
1.2 Land Suitability Evaluation in the Study Area
Traditional land evaluation methods (the FAO Framework and Boolean Logic) were applied by Nwer (2005) using the concept of a limiting factors to produce land suitability maps for barley and wheat crops in the study area. One of the limitations of Nwer’s (2005) land evaluation model, in the context of the selected study area, is that it applies the Boolean methodology. The Boolean method usually refers to a number of related elements as a crisp set (Baja et al., 2011). In Boolean logic, the boundaries between land mapping units are sharply defined, whereas they should actually be set according to transition zones (e.g. Baja et al., 2002; Burrough, 1989; Christoffel, 2006; Davidson et al., 1994; Dobermann and Oberthiir, 1997; Elaalem, 2012; Sarmadian et al., 2010). According to McBratney and Odeh (1997), Boolean logic application in land evaluation often leads to the loss of useful information that is relevant in the study area as occurred in Nwer’s (2005) study. Davidson et al. (1994: 383) were some of the early authors to describe the disadvantages of applying Boolean logic, stating for example: 1) “masking of key and positive land properties by less important ones may depress the overall suitability class", and 2) inabilities to take into account the effect of properties which happen to have values near to class boundaries”. In recent times however, fuzzy-set theory in land evaluation is gaining popularity as a remedy for Boolean limitations (De la Rosa and Van Diepen, 2002).
1997; Braimoh et al., 2004; Elaalem et al., 2010; Sarmadian et al., 2010) clearly affirm that the selection of weights have a major effect on the model outputs. However, a major issue confronting land evaluation methodologies is the prediction of the weights placed on land characteristics and/or land qualities against the eventual crop performance required. The accuracy of land evaluation methods also depends on the weighting values of the attributes of land based on their effect on crop production. It is therefore, necessary to assign appropriate weights to them. The third limitation is the choice of technique used to identify the land that is suitable for each crop i.e. weighted overlay technique (WOT).
The limitation associated with using the weighted overlay technique is that the output of WOT in the raster should be discrete, and the value will typically be rounded to an integer; yet, this is a limitation because converting the decimal value to an integer can result in a loss of information which inaccurately reflects reality (ESRI, 2010). In addition, the weighted overlay tool is applied to solve multi-criteria problems such as location selection and suitability models, and allows for the consideration of geographic problems which may often require the analysis of different factors (ESRI, 2010). Such is the case with land suitability analysis where determination of overall land suitability of an area for a particular agricultural crop will require consideration of many criteria e.g. soil pH, depth and texture (Van Diepen et al., 1991). Each criterion can be represented by a separate map (a single thematic layer) in terms of the degree of suitability for each land unit, but in the existing land evaluation model for the study area, the land characteristics which are related to soil are grouped and represented as one thematic layer. Arguably, this may result in the loss of interaction between factors, particularly when weights are being assigned to each land characteristic. This demonstrates the need to give attention to
the testing and development of traditional land suitability models in order to achieve the optimum use of available land in Libya. To overcome the limitations of purely relying on traditional methods, this research explores the potential of using multi criteria methods (such as the fuzzy method and the AHP integrated with GIS functions (such as overlay analysis) to handle these problems.
1.3 Research Questions
In order to address the research aim and to analyse land evaluation techniques to find land suitability in in Benghazi region in northeast of Libya, the following research questions were developed followed by a main aim and objectives:
1. What are the benefits of applying different approaches such as multi-criteria methods to a land suitability model?
2. Is it possible to develop the existing land suitability model by using multi criteria method?
3. Which land evaluation system is most suitable for Libyan land conditions? 4. How will the newly-developed land suitability model help the Libyan
government in the decision-making process for land use planning?
1.4 Research Aim and Objectives
The overall aim of this study is to develop and verify a land evaluation technique for the production of barley and wheat in the study area. This aim was achieved by meeting five specific objectives:
2. Development of existing land evaluation methods by using Multi-criteria Evaluation (MCE) methods.
3. Identification and assembly of data on land characteristics which affect agricultural growth in the study area, weighted by means of local expert knowledge. •
4. Comparison of the outputs derived from both the new model and those from an existing land evaluation model of the study area, with field yield data collected during the course of this research.
5. Derivation of a number of land suitability maps for barley and wheat based on MCE and Boolean methods.
1.5 Thesis Structure
This thesis is arranged into nine chapters, from introduction to study area, followed by methodological issues to results then the conclusion. A summary of the contents of each chapter is presented below.
Chapter One presents a brief introduction to the thesis and provides a brief background to the study including the rationale, research questions, aim and objectives and structure of the thesis. Chapter Two covers most relevant socio economic and geophysical factors including population, climate, soil and water resources use and management and the interplay between agricultural policies and food security among others. Chapter Three presents a review of land evaluation methods and their applications in land suitability. The second part of this chapter goes on to briefly explain Boolean and Fuzzy theory as the two logics used in land evaluation. Chapter Four is an extension of chapter three reviewing the most widely used land evaluation methods. Chapter Five reviews land suitability analysis that
involves GIS and multi-criteria evaluation. Chapter Six document the methods employed in the research from selection of study areas to data validation, covering data requirements, database construction, deriving weights, fuzzy set theory applications and deriving land evaluation models. While Chapter Six shows the different models used to produce land suitability maps for Barley and Wheat, Chapter Seven shows the results (in the form of three models). The latter are based on FAO framework and weighting local experts’ opinions. Chapter Eight compares the three models and their implications in practice. Chapter Nine links the aims and objectives, the literature review, and the research results to present the conclusions to this research project. This last section of the thesis provides recommendations based on the findings and suggest possible areas of future research.
Chapter Two
Research Context
2.1 Introduction
Compared to its North African neighbours, Libya is for the most part an arid country, which account for why the agricultural sector’s contribution to the national economy in terms of Gross Domestic Products is low. The constraint to agriculture is caused by fresh water scarcity, low soil fertility coupled with limited arable land. Consequently, this has resulted in an extensive production system that suffers from low productivity. However, the productivity along the coastal areas of the Mediterranean climate which covers a narrow belt of about 25 square kilometres is an exception due to year round adequate rainfall. To overcome limitations in land scarcity robust scientific analyses for evaluating land suitability are required to increase output of crop production for self-sufficiency in food supply. This chapter is therefore aimed at contextualising these issues in the country of study. Section 2.2 starts with the background and general characteristics of Libya, including the geography and the population. This is followed by an examination of the major natural and land use conditions associated with agriculture but are relevant to the research topic such as soil and water management. The Libyan economy, agriculture and food security problems are also examined in Sections 2.5 and 2.6 respectively.
2.2 Physical Landscape
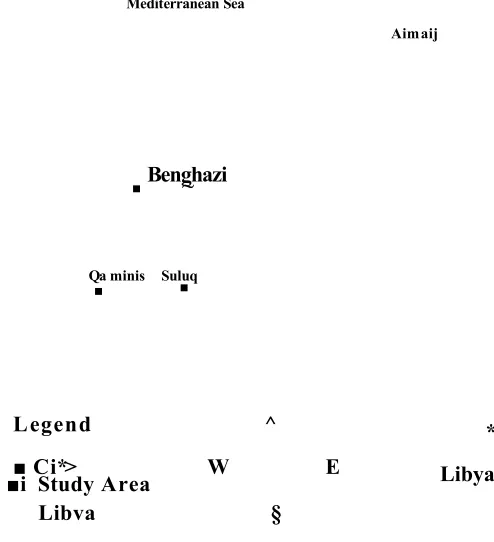
1,770 kilometres (Ben Mahmoud et al., 2000; Johnson, 1973). Libya shares borders
with Egypt to the East, Sudan to the south-east, Tunisia and Algeria to the west, and
Niger and Chad to the south (Figure 2.1). It has an important physical asset in its
strategic site at the centre of Africa’s northern rim. Figure 2.1 also indicates the
location of the study area which covers the Benghazi coastal line located in the
western comer of north-eastern Libya. The Benghazi region is located between
longitudes 32° 4'N and 20° 16' E.
- r- T r ip o li
l._ T u n isia J ■ ' Mediterranean Sea
Benghazi
Libya
Algeria
C had
S u dan
Country7
Study Area Wh KJ
120 240 480
K i l o m e t r e s
Figure 2.1: Map of Libya.
In Libya, two main land systems were identified, based essentially on geographic location and geomorphological patterns: the barren plains are in the north part and the Sahara desert in the south are the most dominant natural features. The Mediterranean coastal lands stretch from west to east, stretching about 2000 km from the Tunisian border to the Egyptian border. The desert includes rocky outcrops and loose surface materials. Only 2% of the country is cultivable land which is estimated at about 3.8 million hectares (Ben Mahmoud et al., 2000). The majority of the cultivated land and /or rangeland are located along the northern zone. However, there are recent agricultural development projects in the southern desert covering about 35,000 hectares. In 1997, the total cultivated area was estimated at 2.28 million hectares or 60 % of the cultivable area, of which 1.93 million hectares consisted of annual crops and 0.35 million hectares biennial and perennial crops. At present, an estimated 400,000 hectares are under irrigation. These areas include large projects, settlements and small holder farms (Ben Mahmoud, 1995).
In between the Sahara desert and the Coastal shorelines, four physiographic regions can be distinguished: 1) The Coastal Plains that run along the Libyan coast which vary in width; 2) Northern Mountains that run close to the coastal plains and include the Jabal Nafusa to the west and Jabal al Akhdar to the east; 3) Internal Depressions that cover the centre of the Libya and include several oases; and 4) Southern and Western Mountains (Figure 2.2). All of these regions have constrained agriculture due to barrenness, dryness, low soil fertility and difficulty of access.
upreq afusa Mountains
alharuj al aswad
Idhan Murzuq
Tibesti Al-Hamada al-
Hautra
S anr
| 1 The Coastal Plains I I The Pre-Desert: ! ] Internal Depressions
; ] Southern and Western Mountains ”| Northern Mountains
LJ
Flat Lands-Desert ^LJ
Stony plainsL. J
Sand Dunes125 250
Kilometres
Figure 2.2 : Map of Physiographic regions in Libya
2.2.1 Climatic Conditions
The climatic conditions of Libya are influenced by the Mediterranean climate to the
north and the Sahara desert to the south. The coastal region, which contains cities
such as Tripoli, Khoms, Alzawia, Shahat and Tubruq comes under the influence of
the Mediterranean coastal strip that is characterised by hot and dry summers and
relatively wet winters. The inland mountains comprising Jabal Nafusa and Jabal
Akhdar highlands experience a plateau climate with higher rainfall and humidity and
low winter temperatures, including snow on the hills because of the north westerly
winds. As one move southwards to the interior, the semi-desert and Sahara climatic
conditions prevail, with hot temperatures (measuring up to 136°F (58°C) in Aziziyah)
and large diurnal temperature variations between night and day and between summer
and winter. Temperature can be as low as -3.6°C degrees centigrade in the month of
January and up to 47°C in the month of August in cities like Ghadames. The north
westerly winds are considered the most desirable winds for summer nights and their
lower velocity also makes them less damaging during the winter months.
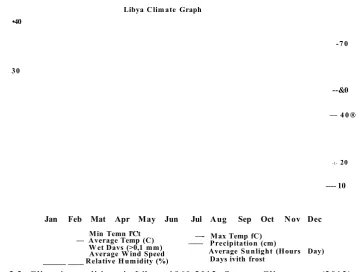
Libya Clim ate Graph •40
-7 0
30
--&0
— 4 0 ®
-1- 20
----10
Jan Feb Mat Apr May Jun Jul Aug Sep Oct Nov Dec
Min Temn I'C't — Average Temp (C)
W et Davs (>0,1 mm) Average Wind Speed ______ ____ Relative Humidity (%)
—- Max Temp fC) —— Precipitation (cm)
[image:30.613.107.469.354.626.2]Average Sunlight (Hours Day) Days ivith frost
Figure 2.2: Climatic conditions in Libya, 1960-2012. Source: Climatemps (2013)
The spatial pattern of precipitation is one of very fast decline from north to south (ARC-ICARDA, 2008; Hamad, 2012). The average annual rainfall for Libya is 26 mm (Figure 2.2) and only coastal areas have sufficient rainfall to allow agricultural use of the land. In the Sahara, rainfall is almost non-existent, with about 93% of the land receiving below 2.5 cm (25 mm) per year and progressively towards zero. The relative humidity is low throughout the year in this part of Libya. While there is severe rainfall shortage in the Sahara, the rainfall in the northern Tripoli (e.g. Jabal Nafusa and Jeffara Plain) and northern Benghazi (Jabal al Akhdar) exceeds the minimum precipitation (250-300 mm) required for rain-fed agricultural production. In this instance, McCalley and Sparks (2009) have cautioned that high temperature increases and irregular rainfall patterns may lead to nitrogen losses in the semi-desert regions and make the soils infertile and unable to support plant life.
The above brief climatic conditions clearly show that Al-Kufrah region in Libya is one of the ten driest regions worldwide with low annual rainfall, high temperature and evaporation (Al-Ghariani, 1996). As a result of the low precipitation and limited surface water; groundwater has been used in the development of agriculture in Libya. As indicated in Figure 2.3, expanding economy and growing population along the coastal strip is associated with escalating demand on groundwater resources for domestic and industrial usages and for agriculture. The increase in water demand and intensive use with very little recharge is restraining groundwater resources, resulting in serious declines in water levels and saline intrusion into the coastal aquifer (Lawgali, 2008). El Asswad (1995) had earlier stated that groundwater on the coastal regions is over-exploited and non-sustainable. The dwindling water supply and increasing population compelled for creating ways of
increasing agricultural productivity through methods such as those carried out in this
research.
2.2.2 Population
Figure 2.3 shows how rapidly the Libyan population has changed markedly since the
discovery of oil in late 1950s. The total population is steadily growing, from just over
four million in the 1990s to more than six million by 2010 (FAOSTAT, 2013). The
population has increased from 4.4 million in 1995 to 5.3 million in 2006, with an
estimated 6.5 million people by the end of 2015. There are currently 1.1 million non-
Libyan migrants from mainly neighbouring countries and the rest of Africa. It is
projected that the population of Libyans and migrants may reach up to nine million
by 2050. As a result of improvements in the standard of living, per capita income
growth, increased health awareness and the availability of medical treatment and
urbanisation, the death rate has declined while birth rate has increased respectively
(UNICEF, 2011).
8.74 7.77
7.37
6.13-3.06
1.34 JH L
2050
1970 1990 2010 2020 2030
1950 2040
Year
Figure 2.3: Libyan population 1950-2050. Source: FAOSTAT (2013).
The Libyan population inhabit the coastal region of Jeffara and Benghazi Plains. The coastal areas of Tripoli, Benghazi, Misrata, Az -Zawiya, Al Bayda, Zliten and Damah are have to about 90% of the population of Libya. The urban population is about 78% of the total (UNICEF, 2011), out of which about 44% are in Tripoli and Benghazi because of their significant resources such as soil, water, vegetation and climate. Other important factors attracting population growth is trade legacy and national development plans. In 1995, 54% of the Libyan population lived in the western coastal area. The eastern coastal area has 21% of the population. This means that 75% of the population are dwelling in an area that is just over 1.5 % of the total land area of the country. The expanding economy and population coupled with the absence of control and planning policies, have resulted in increasing pressure and competition between urban and agricultural lands (Libyan Statistics Book, 2007). As a result, increased supplies of food are needed to match this growth. According to Wheidah (2012; 146), the needs and demand of the population have been the driving force in the allocation of water resources for food production. Therefore, it is vital to examine prevailing climatic conditions, soil and water resources effects on agriculture and to develop land suitability models that would boost food production policy.
2.3 Soil Resources
Extensive soil studies have been conducted in Libya over the last four decades (e.g.
Ben Mahmoud and Suliman, 1989). However, emphasis has been placed mainly on
the distribution of morphological characteristics of northern part of Libya and on
small scattered areas in the southern desert. The present soil survey reports and maps
methods of soil analysis, and the criteria on which the interpretation of data is based.
The major soil classification systems used in these reports are the USD A Soil
Taxonomy, the modem soil classification of Russia, the French soil classification,
and the FAO/UNESCO system. Based on the US Soil Taxonomy, the main soil
orders are Entisols, Aridisols, Mollisols, Alfisols, Vertisols, and Inceptisols (FAO
and UNESCO, 1998; Selkhozpromexport, 1980; Mahmoud, 1995). Libyan soils are
generally Entisols and Aridisols.
The taxonomy of the Soviet soil pedology system was adopted for elaboration of the soil classification, and the soil nomenclature generally applied to characterize the soil mantle of the Mediterranean countries was also partially used. Classes and subclasses have been singled out on the basis of the classification structure for the tropics and sub-tropics. The Russian terminology system used in this study is summarised below: Appendix A.l contains the definitions of the Soviet terminology for class, subclass, type, subtype and genera
Based on the taxonomy of the Soviet classifications system the soil in the study area are divided into: 2 soil classes, 5 soil subclasses, and 10 soil types, including 30 subtypes and the soils are also subdivided into genera. Besides, non-soil formation represented by Martine and continental sands, rock outcrops and coarse-textured stony alluvial and proluvial deposits are also delineated on the soil map. Most of the soils in Libya have a transition between aridic and xeric moisture regimes and thermic and hyperthermic temperature regime (Selkhozpromexport, 1980; Mahmoud, 1995).
2.3.1 Soil Erosion
Soil erosion in Libya is a major problem occurring mainly in the semi-arid and sub-humid areas. Both water and wind work together, as redeposited silts from surfaces stripped by water erosion are particularly vulnerable to wind transport. Wind erosion starts with the movement of coarse soil particles in one part of a field, then progresses downwind with increasing severity as bouncing soil particles knock other particles into the air in a kind of progressive, increasing effect. Finer materials are lifted as dust into the air and carried away over long distances; coarser sandy materials drift over the surface until they are trapped by plants in accumulations of low, rounded hills and small dunes. A study conducted in 1980 showed that there are two types of soil erosion in Libya: water erosion and wind erosion (Selkhozpromexport, 1980). Wind erosion is a big problem in the Jeffara Plain leading to soil degradation and affects agricultural production and pasture. Over grazing, which involves deflation of the uppermost soil is the major cause of wind erosion. Ben-Mahmoud et al. (2000) added that several centimetres of soils that have sandy texture, such as Camborthids and Orthents, can be easily removed by wind. Erosion is widespread within the Jebel Nafusa upland and the Benghazi region, occurs in the form of sheet washing and rill forms because the vegetation cover has been degraded by over-cultivation. Also, the intensity of soil erosion in this area depends on the amount of precipitation, vegetation density, slope stability and soil moisture. Some of the human causes of soil degradation and consequently erosion in Libya are by: 1) deforestation and the removal of natural vegetation, 2) misuse or poor management and over exploitation, 3) overexploitation of water resources, 4) rangeland conversion to cropland, 5) overgrazing in marginal areas, and 6) urbanisation and increasing population (Saad et. al., 2011).
2.4 Water Resources and Management
[image:36.612.77.490.382.561.2]Libya like other North African countries bordering the Sahara has always been challenged by the need to use available water to meet human needs for consumption, agriculture and industrialisation (Alghariani, 2004). The situation has been compounded by increasing population, rising standard of living and food demand. Major efforts were designed to mitigate the water shortage in Libya through the construction of dams, seawater desalination, treatment plants; and the so-called Great Man-Made River - one of the world’s largest irrigation projects that supplies water from the Sahara to the coast. Despite these efforts, Libya still suffers from an unenviable water shortage (Ramali, 2012).
Table 2.1: Major water basins of Libya in million cubic meters per year
Water basin Groundwater Surfacewater Unconventionalwater Total
Jeffara Plain 200 52 27.5 279.5
Jabal Alakhdar 200 92 45.5 337.5
AL Hamada
Alhamra 230 48 50.5 328.5
Kufrah and Sarir 563 - - 563
Murzuk 771 - - 771
Total 1964 192 123.5 2279.5
Source: General Water Authority (2006) and Alghariani (2004)
in the Jabal Alakhdar basin region. The deficit is due to population, industrialisation and demand for arable land along the north-western and north-eastern regions of Libya. There is, however, no water deficit in the Murzuk and Kufrah-Sarir basins due to low population and land availability.
Surface water is limited - estimated at less than 200 million m3 per year and contributes above 5% of the current water resources (GWA, 2000). According to Al-Ghariani (1996), Libya’s total mean annual runoff calculated or measured at the entrance of the wadis in the plains (or spreading zones) was at 200 million m3 per year. However, a high proportion of the runoff either evaporates or recharges the underlying aquifers. Attempts were made to increase water reservoirs from the current 16 dams, whose maximum capacity is around 30-40 * 106 m3/yr., to ones that could take the annual storage capacity of about 61* 106 m3' As indicated in table 2.1, groundwater accounts for about 90% of the water resources in use. The coastal aquifers are being recharged by rainfall but uncontrolled groundwater extraction from these aquifers tends to exceed the annual replenishment rate. This process, leading to seawater encroachment, has caused high salinity. Unconventional water resources in Libya include sea water desalination plants and wastewater treatment facilities. While desalination plants are purpose built for domestic and industrial uses (put presently at 40 million m per year), treated wastewater is for agricultural purposes.
2.4.1 Water Demand and Supply
domestic sector consumes about 15%. Industrial consumption, on the other hand,
amounts to about 3% of the total water demand by 2020. This result is similar to the
current estimates given by the Libyan General Water Authority (2006). The
combined future estimates indicate an increase from 6293.89 m3 in 2006 to 12473.20
m in 2020: an average annual rate of around 5%. By 2020, the increase would be
98% of 2006 consumption rate.
14000
■ Agriculture l l Industrial
■ M unicipal ■ Total Demand
12000
10000
8000
^ ~ 6000
4000
2000
2006 2008 2010 2012
Yearly forecast
[image:38.612.90.474.247.445.2]2014 2016 2018 2020
Figure 2.4: Agriculture and municipal water demand in Libya. Source: Author. Data obtained from Lawgali (2008)
Figure 2.4 shows water demand in blue bars against supply for agriculture and
municipal use from 2006-2020. The increase in water consumption for agricultural
use affects current and planned water reserves. It therefore becomes important to find
land suitable to crop production using minimal water supply. As the figure indicates,
agriculture has taken the larger proportion of water use because it has been
transformed from traditional rain-fed crop production into an extensive mechanised
irrigation cultivation which requires intensive water usage. However, available water
resources are insufficient to meet the present consumption rate. This prompted huge water transfer and redistribution system otherwise known as The Great Manmade River Project (GMRP) (Figure 2.5). The GMRP is planned in five phases. The three phases have been completed.
The first phase, the largest, and consists of a system that extracted and carries two million cubic metres of water daily to the coastal region. However, the system is designed to be expanded to carry 3.68 million m3 of water daily in the future (GMRP, 1990).
The second phase consists of a system that delivers one million m3 of water daily from well fields in Fezzan region to the western coastal belt and in particular to Jeffara Plain. It is designed to accommodate a further one million m3 a day in the future (GMRP, 1990).
The third phase is an anticipated expansion of the first phase. The water flow will be increased by 1.68 million m daily. The water flow was increased by 1.68 million m3 daily.
The fourth phase is under construction and will carry 200,000 m3 to Tubruq from Ajdabiya.
The fifth phase consists of two stages. The first stage connects phases one and two by linking a conveyance line between Sirt and the Jeffara Plain to deliver one million m . The second stage of phase five expands the second phase system by incorporating two additional well fields to supply one million m3 of water a day (GMRP, 2008).
5hases
Figure 2.5: The five phases of the Great Man-Made River Project. Source: GMRP (2008)
Similar to Figure 2.4, Table 2.2 clearly indicates that GMRP is only a partial solution
to medium term water solution. Estimates by the General Water Authority (2000) has
3 • 3
shown deficits of more than 1.2 m in 2010 further increasing to more than 3.5 m by
2025. This calls for a rethink on the use of GMRP for agriculture - it has to be
progressively but drastically reduced through contemplating expanding seawater
desalination technology and waste water treatment that currently represent only 3% of
water sources. Other ways are to reduce agricultural water demand by producing
more crops with less water demand, and selecting suitable land for increased
productivity are areas that can be explored. The latter is the major area to be
discussed in chapter seven of this thesis.
Table 2.2: Water Demands forecasts in Libya, 2006-2020
Year Water demand Water supply Balance
Without GMRP With GMRP With GMRP
1995 3885 2279.5 2360.5 -1524.5
2000 4493 2279.5 3912.5 -581.0
2010 5794 2279.5 4506.0 -1288.0
2020 7236 2279.5 4506.0 -2730.0
2025 8022 2279.5 4506.0 -3516
Source: Genera Water Authority (2000) and Alghariani (2007)
2.5 Libyan Economy
According to Abubrig (2012:123), the economic transformation of Libya can be broadly categorised into three phases. The first phase is before the discovery of oil in 1958 which started after the abolition of the Trans-Sahara slave trade. Libya was characterised by poverty and the economy depended on foreign aid due to limited wealth. The majority of the population was dependent upon traditional agriculture, which, in turn depends on rainfall and productivity has suffered from soil erosion, water scarcity and harsh climate. The industrial sector was limited, due to shortage of skilled and educated manpower and the lack of raw materials. The second phase began from 1961 when Libya began to enjoy the revenues from oil export and was transferring into a modem society through infrastructure and self-sufficiency in food supply. Within this period, Libya experienced social and political change, such as the aggressive nationalisation programme and the socialist principles movement of 1978. Agriculture’s contribution of 20% to GDP prior to 1958 sharply declined to 2% in 1978, due to limited water and migration of local farmers to the coastal areas for oil sectorjobs.
The third phase covered consolidation of the economy and the dissolution of private ownership and the public sector development programmes from 1980s up to 2000. While agriculture remained abysmally low (2% of GDP), Libya began food imports from Italy, Germany and the neighbouring countries for the increasing population. For example, the import of cereals, sugar and oil in 2000 represented 68% of the national calorie budget. In 2010, food security at the national level was achieved, but food self-sufficiency is not feasible because of the volatility of imports and the government’s over-reliance on oil revenue to subsidise the importation of food. Also, the 2011-2012 Libyan revolution has had an impact on the national economy and agriculture. This I do not intend to expand on here.
2.6 Agricultural Production
According to estimates, agriculture is 9% of GDP and employs 5% of the economically active population. Crop production accounts for 5% of the GDP and occupies about 13% of the total labour force. As a result of climatic and land constraints, Libya’s main agricultural products are vegetables, cereals -mainly wheat and barley - fruits, meat, legumes and dairy products (Table 2.3). Olive trees and orchard farms are prevalent in the western part of the country and are intercropped with barley and vegetables. The usual market for most of the products is the local one, where these products are transferred from the farmers to the consumers (Libyan Statistics Book 2007). Libya’s agriculture depends mainly on the private sector since the late 1970s. There is large proportion of privately-owned farms in Libya. The private farms, range from one hectare small family holders - purely for subsistence farming - to large-scale irrigation of more than 10 hectares (GMPR, 2008). The rest are government-owned under the irrigation scheme, but mainly for the production of
cereals and forage. Mechanised farming system using overhead sprinkler and drip irrigation systems are common in government-owned arable lands.
Table 2.3: Total agricultural production in Libya in 2007
Products Productions (1000 tonnes)
Vegetables 420.000
Cereals 650.000
Fruits 350,000
Meat 16.000
Legumes 22.000
Dairy products 90.061
Source: Libyan Statistics Book (2007)
As a result of climatic factors and land constraints, irrigation has always been of crucial importance to the country’s agriculture. According to FAO (2005), Libya dedicated about 470 000 hectares of land for irrigation, of which about 22% has been cultivated. For example, local production of cereals from irrigated land is about 50% and that of fruit and vegetable is almost 90%. In the coastal plains, marginal lands, Jabal Al Akhdar and wadi beds annual, perennial and biennial crops are cultivated depending on the rainfall pattern.
2.7 Summary
This chapter has shown that Libya depends on the importing for most of its agricultural products owing to climatic conditions and poor soils that limit domestic output. The increase in income and population growth has increased food consumption over the years, but food security is becoming a serious challenge in the oil rich country. Because of low rainfall, agriculture relies on limited rainfall on underground water sources. As a sign of commitment, the GMRP remains the primary agricultural water source but also significant resources are being invested in
desalinisation of the Mediterranean Sea to meet increasing demand. This means that that agricultural water management must be coordinated with, and integrated into, the overall water and agriculture policies. However, land evaluation research must be integrated to attain best suitability and maximal yield using the limited amount of water and land. As indicated in sections 2.2-2.4, the potential physical and climatic conditions exist to support increased local food production through scientific use of land resources. For example, as there is a large reserve of shallow underground water along the coast, yield can be improved by irrigation due to the short precipitation period during the winter. In order to increase productivity a thorough land evaluation needs to be undertaken as described in the following chapter.
Chapter Three
An Overv
iew of Land Evaluation
3.1 Introduction
This chapter describe a variety of definitions and explanations regarding land evaluation, as well as different approaches to the process of land evaluation. The following section focus on specific instances of the land evaluation and its applications. Section 3.3 discusses the need for land evaluation and section 3.4 identifies the difference between land use and land evaluation. Section 3.5 explains the terms and logic used in land evaluation including types of evaluation. The traditional systems in land evaluation, from the qualitative systems to the single factor models are contained in this section. Section 3.6 reviews the logic used in land evaluation including Boolean and fuzzy and is further extended in section 5.4. Section 3.7 of this chapter concludes with a description of the role of the land information system in land evaluation and how these systems can contribute to the exercise. The chapter that follows contains a critical overview of the various methods used in land evaluation studies and put into context the specific methods adopted in this study. It also contains the reasons why FAO approach was considered the most suitable approach for this research.
3.2 Land Evaluation: Definition and Explanation
Dent and Young (1981) define land evaluation as the process of estimating the potential for alternative kinds of land use and to predict the consequences of change. It can distinguish between a numbers of forces behind land evaluation emerging as a distinct subject. Firstly, there is an increasing availability of biophysical data, and
these data can be processed and presented in a variety of ways. Secondly, countries are committing to the challenges of land use planning. South Africa and Libya for instance, have linked their sustainable development goals and land use planning. In this manner, the function of land use planning is to guide decisions on land use so that they are put to the most beneficial use for present, whilst conserving the same land for future population and their needs.
Land evaluation process may be done qualitatively or quantitatively for the purpose of determining its suitability (for a specific use, as in production of maize or potatoes) or its capability (for a wider utilisation such as agriculture or grazing). In the past, land evaluation was used as part of soil survey studies. However, since 1970, land development has shifted focus to crop growth and crop production, which includes aspects pertaining to climate conditions, soil and land management. There are two approaches being used: 1) parametric systems incorporate land characteristics that influence agricultural production by using mathematical equations. Many parametric approaches have been used for land evaluation. These approaches vary in the specific parameters they include and in their mathematical manipulation (McRae and Burnham, 1980), and 2) categorical systems, focused on the classification of the property into production units according to the units’ varying potentials and limitations affecting crop growth (McRae and Burnham, 1980; Rossiter, 1994). Land evaluation involves assessing the production capability of the land using a systematic analysis of both the land’s physical conditions and their impact on the current and future land use. Land evaluation offers a technique for comparing the different ways that the land can be used as well as the benefits that may be derived from these uses, considering the present and future economic and social environments (FAO, 2007).
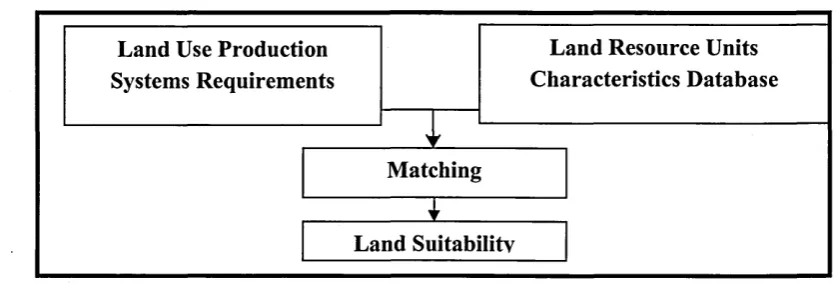
The process of land evaluation will not define the land use or any proposed changes in it. Instead, it provides data that can serve as a basis for deciding which land use option is suitable. In short, land evaluation helps land owners, regional land development agencies and nations to arrive at logical land use decisions. But there are certain requirements for land evaluation to be successfully utilised (Verheye, 2008). Many of these requirements are specific to the type of land use, and they include both the ecological requirements of the crop or other biological product, and the requirements of the management system used to produce it. Evaluation of land resources is essentially a combination of the properties of the land with the requirements of proposed land use. The principles of land evaluation are presented in the Framework for Land Evaluation (FAO, 1976) as follows and illustrated in Figure 3.1.
• Initial consultation, concerned with the objective of the evaluation, data (including land, land use and economics) and defining assumptions;
• Description of the kinds of land use to be considered, and establishment of their requirements that can support particular land use;
• Description of resource base units or “land units”;
• Comparison of kinds of land use, such as coffee cultivation, wheat production, irrigation projector poultry farms, with the types of land present (“matching”); • Economic and social analysis e.g. size of land holdings and mechanisation; • Land suitability classification (qualitative or quantitative);
• Presentation of the results of the evaluation into a form usable by land users.
Land Suitability Matching Land Use Production
Systems Requirements
[image:48.613.60.480.77.219.2]Land Resource Units Characteristics Database
Figure 3.1: Process of land evaluation
3.3 The Need for Land Evaluation
The FAO (1976) argues that in the past, land use changes often came about by gradual evolution as a result of many separate decisions taken by individuals. The increased demand for physical space and food from expanding population, the availability of suitable land for production making land a scarce resource, and even the less suitable or marginal lands had been subjected to cultivation (FAO, 1983; Purnell, 1986; Son and Shrestha, 2008). This calls for a systematic and comprehensive assessment of land. In emerging countries, the growing need for more productive land types, the reservation and preservation of land for agriculture, plus the expanding concern to protect the environment, has created a demand for a total review of land space and its rationality. To achieve this, what is needed is a total inventory of natural resources for a proper assessment of land’s suitability for production purposes.
Scientists have been interested in the study of land resources and modifications of the methods of land evaluation (Beek, 1978). Purnell (1986) stated that land evaluation provides a systematic way of looking at various options and predicting the results of alternative courses of action. The inventory and survey of
natural resources are essential parts of land evaluation. These helps land use planners to avoid costly mistakes and to improve investment efficiency (Camp, 1999; Young, 1998). Valid techniques of resource survey and land evaluation have helped to translate environmental data into land use potential (Young, 1998). Land evaluation is an essential perspective for all-rational land use planning (Purnell, 1986). It forms the link between basic resource surveys and land use planning (FAO, 1983) and enables land use planners to make decisions on land use.