capacity and increased mortality risk in patients with
coronary heart disease – a CARE CR study
NICHOLS, Simon <http://orcid.org/0000-0003-0377-6982>, O'DOHERTY,
Alasdair F., TAYLOR, Claire, CLARK, Andrew L., CARROLL, Sean and
INGLE, Lee
Available from Sheffield Hallam University Research Archive (SHURA) at:
http://shura.shu.ac.uk/22396/
This document is the author deposited version. You are advised to consult the
publisher's version if you wish to cite from it.
Published version
NICHOLS, Simon, O'DOHERTY, Alasdair F., TAYLOR, Claire, CLARK, Andrew L.,
CARROLL, Sean and INGLE, Lee (2019). Low skeletal muscle mass is associated
with low aerobic capacity and increased mortality risk in patients with coronary heart
disease – a CARE CR study. Clinical Physiology And Functional Imaging, 39 (1),
93-102.
Copyright and re-use policy
See http://shura.shu.ac.uk/information.html
Sheffield Hallam University Research Archive
Low skeletal muscle mass is associated with low aerobic
capacity and increased mortality risk in patients with
coronary heart disease
–
a CARE CR study
Simon Nichols1 , Alasdair F. O’Doherty2, Claire Taylor3, Andrew L. Clark4, Sean Carroll5and Lee Ingle5
1
Centre for Sports and Exercise Science, Sheffield Hallam University, Sheffield,2Department of Sport, Exercise and Rehabilitation, Northumbria University, Newcastle-Upon-Tyne,3Carnegie School of Sport, Leeds Beckett University, Leeds,4Academic Cardiology, Castle Hill Hospital, Cottingham, and5Sport Health and Exercise Science, University of Hull, Hull, UK
Summary
Correspondence
Simon Nichols, Centre for Sports and Exercise Science, Sheffield Hallam University, Collegiate Campus, Sheffield S10 2BP, UK
E-mail: s.j.nichols@shu.ac.uk
Accepted for publication
Received 23 March 2018; accepted 9 July 2018
Key words
cardiorespiratory fitness; coronary disease; sarcopenia; skeletal muscle
Background In patients with chronic heart failure, there is a positive linear relationship between skeletal muscle mass (SMM) and peak oxygen consumption (VO_ 2peak); an independent predictor of all-cause mortality. We investigated the association between SMM andVO_ 2peakin patients with coronary heart disease (CHD) without a diagnosis of heart failure.
Methods Male patients with CHD underwent maximal cardiopulmonary exercise testing and dual X-ray absorptiometry assessment. VO_ 2peak,the ventilatory anaero-bic threshold and peak oxygen pulse were calculated. SMM was expressed as appendicular lean mass (lean mass in both arms and legs) and reported as skeletal muscle index (SMI; kg m2), and as a proportion of total body mass (appendicu-lar skeletal mass [ASM%]). Low SMM was defined as a SMI <726 kg m2, or ASM%<2572%. Five-year all-cause mortality risk was calculated using the Calibre 5-year all-cause mortality risk score.
Results Sixty patients were assessed. Thirteen (217%) had low SMM. SMI and ASM% correlated positively withVO_ 2peak(r = 0431 and 0473, respectively;P<0001 for both). SMI and ASM% predicted 163% and 129% of the variance in VO_ 2peak, respectively. SMI correlated most closely with peak oxygen pulse (r= 058;
P<0001). SMI predicted 403% of peak VO_ 2/HR variance. ASM% was inversely associated with 5-year all-cause mortality risk (r= 0365;P = 0006).
Conclusion Skeletal muscle mass was positively correlated with VO_ 2peak in patients with CHD. Peak oxygen pulse had the strongest association with SMM. Low ASM% was associated with a higher risk of all-cause mortality. The effects of exer-cise and nutritional strategies aimed at improving SMM and function in CHD patients should be investigated.
Introduction
Peak oxygen uptake (VO_ 2peak), measured by a maximal
car-diopulmonary exercise test (CPET) represents the upper limit of aerobic capacity. A low VO_ 2peakis associated with the loss
of independence in older individuals (Shephard, 2009) and increased all-cause and cardiovascular mortality in patients with coronary heart disease (CHD) (Keteyian et al., 2008). The physiological factors that limit VO_ 2peak are summarized
by the Fick equation (Bassett & Howley, 2000; Poole et al., 2012; Lundbyet al., 2017):
_
VO2peak¼cardiac output ðavO2diffÞ
Where cardiac output is the product of heart rate (HR) and stroke volume (SV), andavO2diff is the difference between
arterial and venous O2content, representing muscle O2
extrac-tion. In healthy individuals,VO_ 2peakis limited centrally;
maxi-mum cardiac output limits O2 delivery to the exercising
muscle at the rate that it is required for aerobic resynthesis of ATP (Bassett & Howley, 2000; Lundbyet al., 2017). However, in patients with chronic heart failure (CHF), a cascade of events alters peripheral muscle physiology. These include, reduced skeletal muscle oxidative enzyme activity, reduced mitochondrial density, decreased perfusion matching with oxidative muscle fibres (Poole et al., 2012) and decreased skeletal muscle mass (Cicoira et al., 2001). Consequently, the
Clin Physiol Funct Imaging(2018) doi: 10.1111/cpf.12539
1
©2018 The Authors.Clinical Physiology and Functional Imagingpublished by John Wiley & Sons Ltd on behalf of Scandinavian Society of Clinical
Physiology and Nuclear Medicine.
peripheral muscle may become the primary limitation to
_
VO2peak(Clarket al., 1996; Sheltonet al., 2010; Pooleet al., 2012).
As CHF worsens, skeletal muscle mass (Collamati et al., 2016) andVO_ 2peak decline (Piepoli et al., 2006; F€ulster et al.,
2013). However, this relationship has not yet been reported in patients with CHD. Around a quarter of patients with CHD have low muscle mass and function (sarcopenia) (Harada
et al., 2016), compared with only 10% of adults older than 60 years (Shafiee et al., 2017). Patients with CHD are com-monly physically inactive which, together with progression of the underlying CHD, may exacerbate loss of muscle mass. Patients with CHD who experience a marked loss of skeletal muscle mass may have a reduced VO_ 2peak and consequently
higher risk of early mortality. Identifying the relationship between skeletal muscle mass and VO_ 2peak in patients with
CHD may be important so that preventative exercise and nutritional interventions can be developed.
We aimed to describe the association between skeletal mus-cle mass and VO_ 2peak in male patients with CHD. We also
assessed the relationship between skeletal muscle mass and other potentially important variables: peak oxygen pulse (peak
_
VO2/HR) (Laukkanen et al., 2006), ventilatory anaerobic
threshold (VAT) (Gitt et al., 2002), VE/_ VCO_ 2 slope (Van de
Veire et al., 2006), N-terminal pro B-type Natriuretic Peptide (NT-proBNP) (Omland et al., 2007) and CALIBER 5-year all-cause mortality risk (Rapsomanikiet al., 2014).
Methods
Study design
Data for this cross-sectional study included baseline measure-ments taken from male patients enrolled in the Cardiovascular and cardiorespiratory Adaptations to Routine Exercise-based Cardiac Rehabilitation (CARE CR) study (Nicholset al., 2018). Ethical approval was obtained from the Humber Bridge NHS Research Ethics Committee–Yorkshire and the Humber (13/ YH/0278). Study procedures conform to the declaration of Helsinki 1964.
The study protocol for CARE CR has previously been reported (Nichols et al., 2018). Briefly, clinically stable male patients who had recently been discharged from hospital fol-lowing an admission for stable angina, myocardial infarction (MI), coronary artery bypass graft (CABG) surgery or elective percutaneous coronary intervention (PCI) were recruited. Patients were asked to attend the research laboratory having not participated in strenuous exercise within the previous 24 h. Written informed consent was obtained prior to con-ducting any investigations.
Resting measurements
Resting HR and left arm brachial blood pressure were taken at the end of 15 min semi-supine rest using a 12-lead ECG (GE Healthcare, Buckinghamshire, UK) and an ECG-gated
automated blood pressure cuff (Tango, SunTech Medical, Eyn-sham, UK). Stature (cm) was measured using a Leicester Height Measure (SECA, Birmingham, UK). Waist circumfer-ence measurements were taken 1 cm above the iliac crest, and hip measurements were taken from the widest aspect of the buttocks. Both measurements were recorded in cm, and the ratio of the two was calculated to determine waist-to-hip cir-cumference ratio (ACSM 2017).
A 2D echocardiogram was used to determine left ventricular (LV) function. LV ejection fraction (LVEF) was calculated using Simpson’s method from measurements of end-diastolic and end-systolic volumes on apical four- chamber and two-chamber 2D views, following the guidelines of Lang and colleagues (Lang et al., 2015). LV systolic dysfunction was diagnosed if LVEF was≤45%.
Body composition
Body composition was determined using dual X-ray absorp-tometry [DEXA] (Lunar iDXA, 255 GE Healthcare). Total body mass (kg), lean body mass (kg) and total fat (%) were deter-mined using the Lunar iDXA’s integrated software. BMI (kg m2) was calculated using DEXA-derived total body mass. Appendicular lean mass (ALM; total lean mass in both arms and legs) was calculated (kg) and indexed to derive skeletal muscle index (SMI; measured in kg m2). ALM was also reported as a percentage of total body mass (appendicular skeletal mass; ASM%). Low skeletal muscle mass was defined as an SMI of<726 kg m2 as recommended by international consensus guidelines (Cruz-Jentoftet al., 2010). A low ASM% was defined as <2572% (Levine & Crimmins, 2012). This approach may be more appropriate for patients who are over-weight/obese and have a higher absolute skeletal muscle mass, but low skeletal muscle mass relative to their total body mass.
Maximal cardiopulmonary exercise test
The cardiopulmonary exercise testing adhered to established guidelines and recommendations (American Thoracic Society/ American College of Chest Physicians 2003; Balady et al., 2010; Nichols et al., 2015; Taylor et al., 2015) and was per-formed using the modified Bruce treadmill protocol (Bruce
et al., 1973) (GE Healthcare). A 12-lead ECG was monitored continuously throughout the test. An ECG-gated automated BP measurement was recorded at the start of the test and at the second minute of each test stage until the end of the test. Rat-ing of perceived exertion (RPE) scores (6-20) was recorded at peak exercise (Borg, 1982). Breath-by-breath metabolic gas exchange data were collected using an Oxycon Pro metabolic cart (Jaeger, Hoechburg, Germany). VO_ 2peak was defined as
the meanVO_ 2(ml) over the last 30 s of the test.VO_ 2peakwas
also adjusted for body mass (ml kg1min1). The VAT was analysed by two independent investigators using the V-slope method (Beaveret al., 1986) with data averaged over the mid-dle five of seven consecutive breaths. The VAT was reported
©2018 The Authors.Clinical Physiology and Functional Imagingpublished by John Wiley & Sons Ltd on behalf of Scandinavian Society of Clinical
in ml, and standardized to patient body mass (ml kg1min1). VO_ 2/HR (ml per beat) and VE/_ VCO_ 2
slope were calculated as previously described (Nichols et al., 2015, 2018).
Pulse wave velocity
Pulse wave velocity (PWV) between the brachium and ankle was measured (Vascular Explorer, Enverdis GmbH, D€usseldorf, Germany) after 15 min of semi-supine rest (torso elevated 45°) in a quiet temperature controlled room (21°C). A blood pressure cuff was placed proximally to the left cubital fossa (brachial artery) and another placed proximally to the medial malleolus. Photoplethysmographic sensors were placed on the patients left index finger and left hallux. Oscillations in the pulse waves alter the volume of the blood pressure cuff and are converted to a PWV. A shorter PWV (ms) indicates more severe arterial stiffness and/or worse peripheral vascular health. The reproducibility of PWV measurement at a single time point has been shown to be good (intraclass correlation 072–086) (Sutton-Tyrrellet al., 2001).
Blood samples
Resting venous blood samples were collected in ethylenedi-aminetetraacetic acid (EDTA), potassium oxalate and serum separating tubes (SST). EDTA and potassium oxalate tubes were spun in a refrigerated (4°C) centrifuge at 3000 revolu-tions per min, for 15 min immediately after the blood draw. Samples collected in SST tubes were allowed to clot for 30 min prior to being centrifuged under the same conditions. Haematocrit and haemoglobin concentrations, neutrophil and lymphocyte count, and NT-proBNP were analysed using a reg-istered National Health Service (NHS) pathology laboratory (Castle Hill Hospital, Hull). All samples not analysed on the day of collection were stored in a 80°C freezer. The ABX Pentra 400 biochemistry auto analyser (Horiba, Montpellier, France) was used to analyse serum plasma glucose, and high sensitivity C-reactive protein (hs-CRP) in duplicate. Calibration and quality controls were conducted in accordance with man-ufacturer’s guidelines.
Prognosis–Calibre 5-year all-cause mortality risk
Five-year risk of all-cause mortality was calculated for each patient using the comprehensive online (https://www.caliber research.org/model) Calibre 5-year risk score (Rapsomaniki
et al., 2014). The Calibre risk score has been developed in a population of 100 000 patients with CHD. The model has good calibration and discrimination in internal and external validation (C-Index 0811) for all-cause mortality. Impor-tantly, the model does not include any fitness measurements in its calculation. Five-year risk of all-cause mortality was reported as a percentage. The variables included in the Calibre score are shown in Table 1.
Statistical analysis
Statistical analysis was performed using SPSS version 22 (IBM, New York, NY, USA). The distribution of the data were assessed visually and using the Shapiro–Wilk test. Categorical data are reported as percentages. Continuous normally dis-tributed variables are displayed as mean with 95% confidence intervals (95% CI) or standard deviation () where specified. Non-normally distributed data are displayed as median (range). Pearson’s (normally distributed), Spearman’s correla-tions (non-normally distributed) and age-adjusted partial cor-relations were used to assess the cor-relationship between indices of skeletal muscle mass and variables of interest. Anrvalue of
<025, 026–050, 051–075, and, >075 were considered weak, moderate, fair and strong associations, respectively (Berg & Latin, 2008). Scatter plots of partial correlations were constructed using the residuals of the independent skeletal muscle indices and dependent variables. Where a variable was significantly associated with SMI or ASM%, receiver operating characteristic (ROC) curves were used to investigate the sensi-tivity and specificity of predicting low skeletal muscle mass. Patients with a low skeletal muscle mass (SMI<726 Kg m2 or ASM% <2572%) were treated as the dichotomous ‘state-variable’ for the ROC curve. Statistical significance was set at
P=005.
Up to six dependent variables with the strongest, significant age-adjusted partial correlations were selected for inclusion within separate stepwise multivariate regression models. The main outcome variables selected were VO_ 2peak, VAT, peak
_
VO2/HR, CPET duration, Calibre 5-year all-cause mortality
risk and NT-proBNP.
Results
Sixty male patients (aged, 621100 years; BMI, 288 37 kg m2) were recruited. Patient characteristics, comorbidities and medications are reported in Tables 2, 3 and 4, respectively. Fifteen patients (250%) had sustained a ST-elevation MI, 19 (317%) a non-ST-elevation MI, 16 (267%) underwent elective PCI, 6 (100%) CABG and 4 (67%) had exertional angina. Comorbidities are shown in Table 3. Med-ian time from cardiac event to baseline assessment was 54 days (range 22–220 days). Mean resting HR was 82 bpm14 bpm. Mean resting systolic and diastolic blood pressure was 12717 mmHg and 58 9 mmHg, respec-tively. Four patients (66%) had a LVEF <45%, ten (167%) had an NT-proBNP>400 pg l1and one (17%) had an NT-proBNP >2000 pg l1. The proportion of patients with low skeletal muscle mass was 167% by SMI and 117% by ASM%. However, only four patients had both a low SMIand ASM%, meaning that 13 (217%) had a low SMIorASM%.
Correlations between ALM, SMI, ASM% and dependent vari-ables of interest are presented in Table 5. The associations between ALM, SMI and VO_ 2peak (ml) were r=0566
(P<0001) and r=0473 (P<0001), respectively. The
©2018 The Authors.Clinical Physiology and Functional Imagingpublished by John Wiley & Sons Ltd on behalf of Scandinavian Society of Clinical
Physiology and Nuclear Medicine.
association between ASM% andVO_ 2peak(ml kg1 min1) was r=0420 (P=0001). The strongest associations between indices of skeletal muscle mass and secondary outcome
measures were observed between; ALM and peak VO_ 2/HR
(r=0633; P<0001), SMI VO_ 2/HR (r=0575; P<0001)
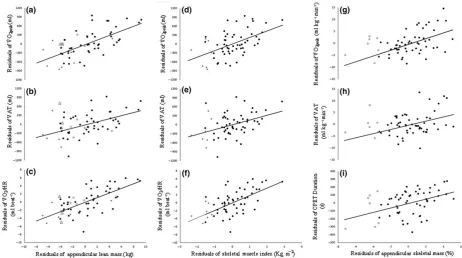
and ASM% and VO_ 2peak [ml kg1min1] (r=0431; P<0001). CPET variables that were significantly associated with ALM, SMI and ASM% are shown in Fig. 1. ASM% was the only method of characterizing skeletal muscle mass result-ing in a significant association with PWV, NT-proBNP and Calibre 5-year all-cause mortality risk.
ROC curve analysis
Receiver operating characteristic curve analysis was conducted on variables that were significantly associated with measure-ments of SMI or ASM%. The area under the curve (AUC) for each prognostic variable is shown in Table 6. For SMI, peak
_
VO2/HR had the greatest predictive capacity (AUC=0767; P=0008). Values<133 ml per beat was predictive of a low SMI. When patients with a low SMI or ASM% were combined, peak VO_ 2/HR AUC was 0764 (P=0004). A peak VO_ 2/HR <143 ml per beat was most predictive of patients with a low SMI or ASM%. Patients with a NT-proBNP>1125 pg l1, a Cal-ibre risk score >30% or a modified Bruce treadmill duration
[image:5.595.66.291.79.278.2]<17 min 43 s were also more likely to have a low ASM%.
Table 2 Patient characteristics.
Variable Mean (SD)
Age (Years) 631 (100)
BMI (kg m2) 288 (37)
ALM (kg) 248 (40)
SMI (kg m2) 83 (11)
ASM% 291 (25)
Body fat% 355 (93)
Waist/Hip ratio 098 (006)
_
VO2peak(ml kg 1
min1) 240 (56)
_
VO2peak(ml) 20793 (5526)
_
VO2peakLean (ml kg 1
min1) 385 (83)
VAT (ml kg1min1) 172 (51)
VAT (ml) 14819 (4524)
VAT Lean (ml kg1min1) 278 (76)
PeakVO_ 2/HR (ml per beat) 155 (33)
Peak HR (bpm) 134 (20)
_
VE/VCO_ 2slope 343 (60)
CPET duration (s) 8266 (1938)
LVEF (%) 543 (67)
Calibre 5-year risk (%) 83 (70)
NT-proBNP (pg l1) 1745 (114–27350)
hs-CRP (mg l1) 23 (30)
Glucose (mmol l1) 61 (20)
BMI, body mass index; ALM, appendicular lean mass; SMI, skeletal
muscle index; ASM%, appendicular skeletal mass; VO_ 2peak, peak
oxy-gen uptake; VAT, ventilatory anaerobic threshold; VO_ 2/HR, oxygen
pulse; HR, heart rate; bpm, bats per minute;VE/_ VCO_ 2slope,
[image:5.595.311.539.80.219.2]ventila-tory efficiency with respect to carbon dioxide elimination; CPET, car-diopulmonary exercise test; LVEF, left ventricular ejection fraction; NT-proBNP, N-terminal pro B-type natriuretic peptide; hs, high sensi-tivity.
Table 3 Patient comorbidities (Frequency).
Comorbidity All patients
Hypertension (%) 27 (450)
Diabetes (%) 11 (183)
COPD (%) 2 (33)
Hyperlipidaemia (%) 38 (633)
Hypothyroidism 5 (91)
Previous PCI (%) 13 (217)
Previous MI (%) 14 (234)
Previous CABG (%) 4 (67)
Previous cardiac valve surgery (%) 1 (17)
Previous CVA (%) 6 (100)
Previous Cancer 8 (133)
COPD, chronic obstructive pulmonary disease; PCI, percutaneous coro-nary intervention; MI, myocardial infarction; CABG, corocoro-nary artery bypass graft; CVA, cerebrovascular accident.
Table 4 Patient medications (Frequency).
Medications All patients
Aspirin (%) 58 (967)
Clopidogrel (%) 16 (267)
Ticagrelor (%) 33 (550)
Beta-Blockers (%) 54 (900)
ACE Inhibitors (%) 38 (633)
Statins (%) 57 (950)
Diuretics (%) 5 (83)
Nitrates (%) 13 (217)
GTN (%) 54 (900)
[image:5.595.312.538.292.410.2]ACE, angiotensin converting enzyme; GTN, glyceryl trinitrate.
Table 1 Variables included in the CALIBER 5-year risk score.
Categorical variables Continuous variables
Sex Age
Belongs to most deprived quintile Total cholesterol
CAD diagnosis and severity HDL
Interventions (last 6 months) Heart rate
Smoking status Creatinine
Hypertension/BP lowering medication White cell count
Diabetes Haemoglobin
Heart failure
Peripheral arterial disease Atrial fibrillation Stroke
Chronic renal disease COPD
Cancer
Chronic liver disease Depression Anxiety
CAD, Coronary Artery Disease; BP, Blood Pressure; COPD, Chronic Obstructive Pulmonary Disease; HDL, High-density Lipoprotein.
©2018 The Authors.Clinical Physiology and Functional Imagingpublished by John Wiley & Sons Ltd on behalf of Scandinavian Society of Clinical
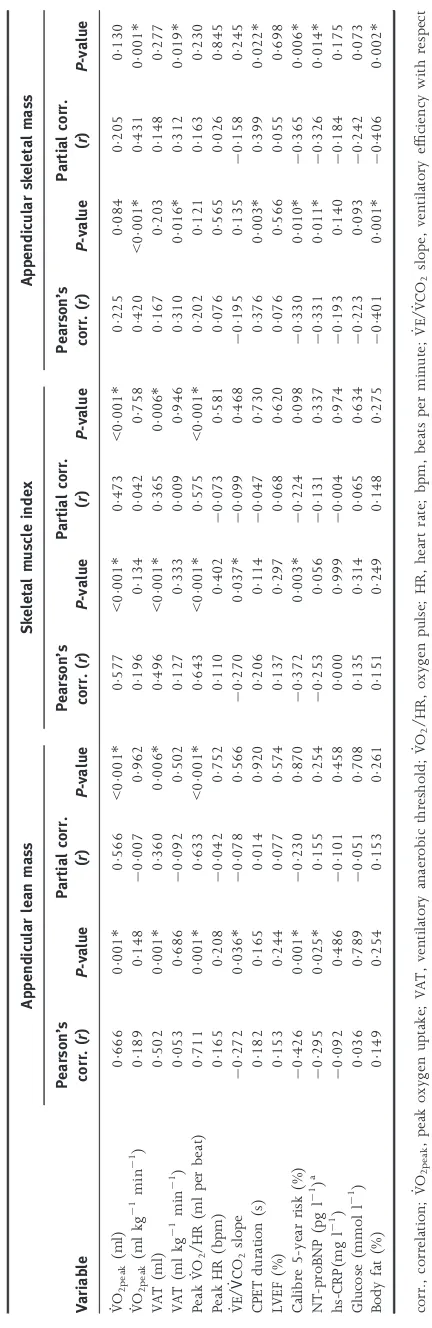
[image:5.595.67.292.342.589.2]Table 5 Correlat ion and partial correlat ions betw een append icular lean mass, skeletal mus cle inde x, appendicular skelet al mass and dependent variab les. Variable A ppendic ular lean mass S keletal muscle index Appe ndicular skeletal mass Pe arson’s corr. ( r ) P -val ue Partial corr. ( r ) P -value Pears on’s co rr. ( r ) P -valu e Partial corr. ( r ) P -valu e Pears on’s co rr. ( r ) P -valu e Partial corr. ( r ) P -value _VO 2peak (ml) 0 666 0 001* 0 566 < 0 001* 0 577 < 0 001* 0 473 < 0 001* 0 225 0 084 0 205 0 130 _VO 2peak (ml kg 1min 1)0 189 0 148 0 007 0 962 0 196 0 134 0 042 0 758 0 420 < 0 001* 0 431 0 001* VA T (ml ) 0 502 0 001* 0 360 0 006* 0 496 < 0 001* 0 365 0 006* 0 167 0 203 0 148 0 277 VA T (ml k g 1 min 1)0 053 0 686 0 092 0 502 0 127 0 333 0 009 0 946 0 310 0 016* 0 312 0 019* Pea k _VO 2 /HR (ml per beat) 0 711 0 001* 0 633 < 0 001* 0 643 < 0 001* 0 575 < 0 001* 0 202 0 121 0 163 0 230 Pea k H R (bp m) 0 165 0 208 0 042 0 752 0 110 0 402 0 073 0 581 0 076 0 565 0 026 0 845 _VE /
_VCO
2 slope 0 272 0 036* 0 078 0 566 0 270 0 037* 0 099 0 468 0 195 0 135 0 158 0 245 CPET duration (s) 0 182 0 165 0 014 0 920 0 206 0 114 0 047 0 730 0 376 0 003* 0 399 0 022* LVEF (%) 0 153 0 244 0 077 0 574 0 137 0 297 0 068 0 620 0 076 0 566 0 055 0 698 Ca libre 5-yea r risk (%) 0 426 0 001* 0 230 0 870 0 372 0 003* 0 224 0 098 0 330 0 010* 0 365 0 006* NT-p roBNP (pg l 1 ) a 0 295 0 025* 0 155 0 254 0 253 0 056 0 131 0 337 0 331 0 011* 0 326 0 014* hs-C RP(mg l 1) 0 092 0 486 0 101 0 458 0 000 0 999 0 004 0 974 0 193 0 140 0 184 0 175 Gl ucose (mm ol l 1)0 036 0 789 0 051 0 708 0 135 0 314 0 065 0 634 0 223 0 093 0 242 0 073 Body fat (%) 0 149 0 254 0 153 0 261 0 151 0 249 0 148 0 275 0 401 0 001* 0 406 0 002* corr., correlat ion; _VO 2peak , peak oxygen uptak e; VAT, ventilatory anaerob ic thr eshold ; _VO 2 /HR, oxyg en pulse; HR , heart rate ; bpm, beat s per min ute; _VE/ _VC O2 slope, ventilato ry effi ciency with resp ect to carbon dioxide elimination; CPET , cardiopulmonar y exerc ise test; LVEF , left ventricular ejection frac tion; NT-proBN P, N-terminal pr o B -type n atr iuretic pept ide; hs, high sensit ivity.
*Significant. a Spearm
an
correlat
ion.
©2018 The Authors.Clinical Physiology and Functional Imagingpublished by John Wiley & Sons Ltd on behalf of Scandinavian Society of Clinical
Physiology and Nuclear Medicine.
[image:6.595.178.394.60.724.2]Multivariate regression
Appendicular lean mass and age (both P<0001) were independent predictors of VO_ 2peak (ml) and VAT (ml). For
_
VO2peak, these variables explained 588% of variance. For VAT
348% was explained. ALM alone accounted for 434% and 239% of variance for VO_ 2peak and VAT, respectively. ALM
was the only significant predictor of peakVO_ 2/HR (P<0001),
accounting for 498% of variance.
Skeletal muscle index and age were independent predictors ofVO_ 2peak and the VAT (ml). ForVO_ 2peak, 525% of variance
was explained by SMI and age, with SMI accounting for 163%. For VAT, 358% of variance was explained by SMI and age. About 121% of variance was explained by VAT alone. Interestingly, only SMI was an independent predictor for peak
_
VO2/HR. 403% of variance was accounted for byVO_ 2/HR.
[image:7.595.67.530.64.322.2]Similar to SMI, ASM% and age (both P<0001) were inde-pendent predictors ofVO_ 2peakand VAT, standardised to body
Figure 1 Partial correlations between appendicular lean mass andVO_ 2peak(a), VAT (b), and peakVO_ 2/HR (c). Panels d to f show partial
correla-tions between skeletal muscle index andVO_ 2peak(d), VAT (e) and peakVO_ 2/HR (f). Panels G to H show partial correlations between appendicular
skeletal mass andVO_ 2peak(g), VAT (h), and total CPET Duration (i).VO_ 2peak, peak oxygen uptake; VAT, ventilatory anaerobic threshold;VO_ 2/HR,
oxygen pulse; CPET, cardiopulmonary exercise test.* =Significant;+ =Low muscle mass when defined using skeletal muscle index
(<726Kg m2);◊= Low muscle mass when defined using appendicular skeletal mass (<2572%);Δ= Low muscle mass when using either
skeletal mass or appendicular skeletal mass.
Table 6 Area under the curve for variables associated low skeletal muscle mass (95% confidence intervals).
Variable
SMI ASM% SMI & ASM%
Area under the curve P-value Area under the curve P-value Area under the curve P-value
_
VO2peak(ml) 0649 (0478–0820) 0139 – – 0675 (0527–0823) 0055
_
VO2peak(ml kg1min1) – – 0726 (0510–0943) 0053 0615 (0430–0810) 0206
PeakVO_ 2/HR (ml per beat) 0767 (0613–0921) 0008* – – 0764 (0632–0895) 0004*
VAT (ml) 0594 (0399–0789) 0351 – – 0620 (0455–0786) 0187
VAT (ml kg1min1) – 0679 (0454–0904) 0126 0561 (0368–0755) 0501
CPET duration (s) – 0744 (0510–0943) 0037* 0648 (0466–0830) 0104
Calibre 5-year risk (%) – 0805 (0600–100) 0009* 0383 (0191–0574 0202
NT-proBNP (pg l1) – 0759 (0511–100) 0027* 0623 (0420–0825) 0178
SMI, skeletal muscle index; ASM%, appendicular skeletal mass;VO_ 2peak, peak oxygen uptake;VO_ 2/HR, oxygen pulse; VAT, ventilatory anaerobic
threshold; CPET, cardiopulmonary exercise test; NT-proBNP, N-terminal pro B-type natriuretic peptide. *Significant.
©2018 The Authors.Clinical Physiology and Functional Imagingpublished by John Wiley & Sons Ltd on behalf of Scandinavian Society of Clinical
[image:7.595.67.539.555.681.2]mass (ml kg1 min1). 388% of VO_ 2peak (ml kg1min1)
and 178% of VAT (ml kg1min1) variance was accounted for by ASM% and age. ASM% alone accounted for 129% of
_
VO2peak variance, compared to 63% for VAT. Age and ASM%
were also independent predictors of NT-proBNP (P<0001) with age accounting for 205% of NT-proBNP variance and ASM% accounting for 72% (combined model; 272%). ASM% accounted for 94% of total Calibre 5-year all-cause mortality risk score variance (P<0001).
Discussion
To our knowledge, this is the first study to investigate the relationship between skeletal muscle mass and VO_ 2peak in
patients with CHD. We identified that a lower skeletal muscle mass was associated with a lowerVO_ 2peak, an observation
pre-viously reported in patients with CHF (Cicoira et al., 2001). We also investigated the relationship between other important prognostic indicators, including peakVO_ 2/HR. Our data
sug-gest that skeletal muscle mass may be more closely associated with peakVO_ 2/HR, rather thanVO_ 2peak. Similar to previously
reported data in patients with CHD (Haradaet al., 2016), we found that more than one-fifth of patients had a low skeletal muscle mass; a higher proportion than reported among adults over the age of 60 years (10%) (Shafieeet al., 2017). A lower skeletal muscle mass was associated with a higher 5-year all-cause mortality risk.
Peak oxygen uptake
Sarcopenia and/or a low muscle mass are associated with increased mortality risk (Cawthonet al., 2007) and difficulties performing daily activities (Janssen, 2006). A low VO_ 2peak is
also associated with a higher mortality risk (Keteyian et al., 2008) and difficulties performing daily activities (Shephard, 2009). Consistent with data reported on patients with CHF (r=046 to r=070) (Cicoira et al., 2001; Piepoli et al., 2006), we found that ALM was positively associated with
_
VO2peak (r=0566). Although dependent on the methods
used to scaleVO_ 2peak, this relationship was maintained when
ALM was standardized to stature (SMI; r=0473) and body mass (ASM%; r=431). However, whilst ALM (434%), SMI (163%) and ASM% (129%) were independent predictors of
_
VO2peak, we were unable to replicate the same predictive
strength (54-65%) reported by Cicoira, et al.in non-cachexic patients with CHF. This may be because patients with CHF can have severe skeletal muscle abnormalities (Clark et al., 1996; Vescovo et al., 1996; Piepoli et al., 2010; Poole et al., 2012) that limit exercise tolerance as a consequence of the disease (Shelton et al., 2010). Given that CHD represents an earlier stage of cardiovascular dysfunction than CHF, skeletal muscle abnormalities may occur at an earlier stage of cardio-vascular dysfunction. Skeletal muscle mass may therefore play a greater role in limiting VO_ 2peak among patients with CHF,
compared with patients who have CHD. Our observation may
suggest that adverse changes in skeletal muscle mass and qual-ity associated with cardiovascular dysfunction exist on a con-tinuum. If this were true, early optimization strategies that target peripheral muscle in addition to cardiac function may be important for disease prevention.
Peak VO_ 2/HR was most closely associated with indices of
skeletal muscle mass. ALM and SMI separately accounted for 498% and 403% of the variance in peak VO_ 2/HR,
respec-tively. These indices of skeletal muscle mass not only had a stronger association with peak VO_ 2/HR (r=0575 to r=0633) compared toVO_ 2peak(r=0566), but also had the
largest AUC (0767; 95% CI 0613–0921;P=0008). Unlike
_
VO2peak,peakVO_ 2/HR had good sensitivity and specificity for
detecting patients with a low SMI. A threshold of 133 ml per beat was identified as the point below which, patients were more likely to have a low SMI (726 kg m2). Simple rear-rangement of the Fick equation means that peak VO_ 2/HR
becomes independent of HR; a factor that we (r=0042,
0073, 0026; P>005 for all) and others (Horwich et al., 2009; Piepoli et al., 2017) have found to be unrelated to skeletal muscle. Instead, reported peak VO_ 2/HR characterizes
SV and a-vO2difference (peripheral O2extraction) which may
explain why it appears to be more closely related to skeletal muscle mass than VO_ 2peak, in patients with CHD. However,
whilst skeletal muscle mass has previously been identified as an independent predictor of peak VO_ 2/HR (74%) in
hyper-tensive men and women (Lim et al., 2005), the association between peak indices of skeletal muscle mass and peakVO_ 2/HR
in our study was smaller [403–498%] (Lim et al., 2005). Nonetheless, this is an interesting finding and should be further explored in a larger cohort.
The weaker relationship between indices of skeletal muscle mass and peak VO_ 2/HR observed in our study may indicate
that patients with CHD have a different physiological response to maximal exercise, compared to patients with hypertension. Under normal circumstances, VO_ 2/HR rises progressively
throughout an incremental exercise test until it reaches a pla-teau associated with normal physiological limitation to exer-cise (Whipp et al., 1996). However, in patients with CHD,
_
VO2/HR may prematurely decrease during incremental
exer-cise due to ischaemia-induced myocardial wall-motion abnor-malities which cause a reduction in SV (Belardinelli et al., 2003). This is thought to occur prior to ST-segment changes detected using electrocardiogram, or symptoms of angina (Nesto & Kowalchuk, 1987). If myocardial blood flow is not restored through surgical or medical intervention, VO_ 2/HR
would be lower than expected at peak exercise and may atten-uate the association between VO_ 2/HR, a-vO2 difference and
skeletal muscle mass. Alternatively, a low peakVO_ 2/HR may
indicate greater cardiac dysfunction and consequently, more severe skeletal muscle abnormalities. However, whilst we can-not confirm either of these scenarios, peak VO_ 2/HR was a
better predictor of SMI than any other measured variable, includingVO_ 2peak, the gold-standard measurement of aerobic
exercise capacity. Formal screening for sarcopenia in patients
©2018 The Authors.Clinical Physiology and Functional Imagingpublished by John Wiley & Sons Ltd on behalf of Scandinavian Society of Clinical
Physiology and Nuclear Medicine.
who are incidentally found to have a low peakVO_ 2/HR may
be beneficial.
Prognostically important associations with skeletal muscle mass
Although SMI was associated with peak VO_ 2/HR, ASM% was
not. However, ASM% was inversely associated with prognosti-cally important variables including; VO_ 2peak, PWV, 5-year
all-cause mortality risk, a higher NT-proBNP and, body fat per-centage even when controlling for age. Although not specifi-cally investigated by our study, the faster PWV speeds observed among patients with a lower SMI indicates more sev-ere arterial stiffness and greater abnormalities in peripheral cardiovascular health, something reported among patients with CHF (Poole et al., 2012). Furthermore, the higher NT-proBNP values reported among patients with a lower ASM% suggests more advanced CHD, or the early development of CHF which may exacerbate the loss of skeletal muscle mass (Collamatiet al., 2016). The association between higher body fat percentage and relative lower skeletal muscle mass may also indicate the onset of sarcopenic obesity, fat infiltration of skeletal muscle and therefore reduced muscle quality (Narici & Maffulli, 2010).
Strengths and weaknesses
This is the first study to use gold-standard measurement tech-niques (DXA and CPET) to investigate the relationship between low skeletal muscle mass and reduced aerobic exer-cise capacity in CHD patients. In addition, this study included a representative cohort of male patients with CHD and the sta-tistical methods employed controlled for several variables that are commonly associated with reduced skeletal muscle mass and aerobic exercise capacity. However, this study has limita-tions; first, we did not assess muscle function, which meant that we could not report the prevalence of sarcopenia in our cohort. Second, our findings in our male only cohort may not be relevant to females with CHD. In addition, the sample size used in this population was relatively small. Finally, whilst the associations identified in our cross-sectional cohort study are interesting, a prospective long-term follow-up study is required. This would help to determine whether progression of CHD confers with reduced skeletal muscle mass and whether this relates to prognostically important variables and/ or the development of CHF.
Conclusion
We found a high incidence of low skeletal muscle mass in our cohort of patients with CHD. When standardized to body mass (ASM%), low skeletal muscle mass conferred a higher predicted risk of all-cause mortality. Low skeletal muscle mass was associated with a low VO_ 2peak in patients with CHD;
however, the relationship was complex and dependent on the method used to scale skeletal muscle mass andVO_ 2peak.
Inter-estingly, our data show that there was a stronger association between SMI and peak VO_ 2/HR. The relationship between
low skeletal muscle mass, prognostic indices and aerobic fit-ness suggests that adverse changes in skeletal muscle mass may be initiated before the diagnosis or development of CHF. These findings may highlight a need for preventative exercise and nutritional strategies to improve skeletal muscle mass and quality in patients with CHD.
Acknowledgments
We would like to thank Toni Goodman, Wendy Summer, Lesley Richardson and Emma Smith for their help during patient recruitment. We would also like to acknowledge the support of the Hull and East Riding Cardiac Trust Fund who provided financial support which enabled us to analyse our blood samples.
Funding
Financial support for blood sample analysis was provided by the Hull and East Riding Cardiac Trust Fund (Hull, East York-shire, UK). Funding for a research post (SN) was supported by City Health Care Partnership CIC (Hull, UK). [No Grant Numbers Issued].
Conflict of interest
SN received salary match-funding from City Health Care Part-nership CIC (Hull, UK) during the data collection period of this study. The authors declare no other conflict of interest.
Author contributions
SN contributed to project conception and design, acquisition, analysis and interpretation of data, drafted and critically revised the manuscript. AFO’D contributed to analysis and interpretation of data, and drafted and critically revised the manuscript.CT contributed to the acquisition of data and criti-cally revised the manuscript. ALC contributed to project design and critically revised the manuscript. SC and LI contributed to project conception and design, analysis and interpretation of data, drafted and critically revised the manuscript. All authors have given their final approval and agree to be accountable for all aspects of work ensuring integrity and accuracy.
Manuscript status
We confirm that this manuscript is not under review with any other Journal. This manuscript has not previously been sub-mitted or reviewed by another Journal. Findings reported in this manuscript have not been presented at any conference.
©2018 The Authors.Clinical Physiology and Functional Imagingpublished by John Wiley & Sons Ltd on behalf of Scandinavian Society of Clinical
References
ACSM. ACSM’s Guidelines for Exercise Testing and
Prescription (2017). Wolters Kluwer/Lippin-cott Williams & Wilkins Health, Philadel-phia.
American Thoracic Society/American College of Chest Physicians. ATS/ACCP Statement
on cardiopulmonary exercise testing. Am J
Respir Crit Care Med(2003);167: 211.
Balady GJ, Arena R, Sietsema K, et al.
Clini-cian’s guide to cardiopulmonary exercise testing in adults: a scientific statement from
the American Heart Association. Circulation
(2010);122: 191–225.
Bassett D, Howley E. Limiting factors for maximum oxygen uptake and determinants
of endurance performance.Med Sci Sports Exerc
(2000);32: 70–84.
Beaver WL, Wasserman K, Whipp BJ. A new method for detecting anaerobic threshold
by gas exchange. J Appl Physiol(1986); 60:
2020–2027.
Belardinelli R, Lacalaprice F, Carle F, et al.
Exercise-induced myocardial ischaemia
detected by cardiopulmonary exercise test-ing.Eur Heart J(2003);24: 1304–1313.
Berg KE, Latin RW.Essentials of Research Methods
in Health, Physical Education, Exercise Science, and Recreation (2008). Lippincott Williams & Wilkins, Philadelphia.
Borg GA. Psychophysical bases of perceived
exertion. Med Sci Sports Exerc (1982); 14:
377–381.
Bruce RA, Kusumi F, Hosmer D. Maximal oxygen intake and nomographic assessment of functional aerobic impairment in
cardio-vascular disease. Am Heart J (1973); 85:
546–562.
Cawthon PM, Marshall LM, Michael Y, et al.
Frailty in older men: prevalence,
progres-sion, and relationship with mortality.J Am
Geriatr Soc(2007);55: 1216–1223.
Cicoira M, Zanolla L, Franceschini L, et al.
Skeletal muscle mass independently predicts peak oxygen consumption and ventilatory response during exercise in noncachectic
patients with chronic heart failure.J Am Coll
Cardiol(2001);37: 2080–2085.
Clark AL, Poole-Wilson PA, Coats AJS. Exer-cise limitation in chronic heart failure:
cen-tral role of the periphery. J Am Coll Cardiol
(1996);28: 1092–1102.
Collamati A, Marzetti E, Calvani R,et al.
Sar-copenia in heart failure: mechanisms and
therapeutic strategies. J Geriatr Cardiol
(2016);13: 615–624.
Cruz-Jentoft AJ, Baeyens JP, Bauer JM, et al.
Sarcopenia: European consensus on defini-tion and diagnosis report of the European Working Group on sarcopenia in older peo-ple.Age Ageing(2010);39: 412–423.
Fulster S, Tacke M, Sandek A,€ et al.Muscle
wast-ing in patients with chronic heart failure: results from the studies investigating co-mor-bidities aggravating heart failure (SICA-HF).
Eur Heart J(2013);34: 512–519.
Gitt AK, Wasserman K, Kilkowski C, et al.
Exercise anaerobic threshold and ventilatory efficiency identify heart failure patients for
high risk of early death. Circulation(2002);
106: 3079–3084.
Harada H, Kai H, Niiyama H,et al.
Effective-ness of cardiac rehabilitation for prevention and treatment of sarcopenia in patients with cardiovascular disease-A retrospective
cross-sectional analysis.J Nutr Health Aging(2017);
21(4): 449–456. doi: 10.1007/s12603-016-0743-9
Horwich TB, Leifer ES, Brawner CA,et al.The
relationship between body mass index and cardiopulmonary exercise testing in chronic
systolic heart failure. Am Heart J (2009);
158: S31–S36.
Janssen I. Influence of sarcopenia on the development of physical disability: the
Car-diovascular Health Study. J Am Geriatr Soc
(2006);54: 56–62.
Keteyian SJ, Brawner CA, Savage PD, et al.
Peak aerobic capacity predicts prognosis in
patients with coronary heart disease. Am
Heart J(2008);156: 292–300.
Lang RM, Badano LP, Mor-Avi V, et al.
Rec-ommendations for cardiac chamber quan-tification by echocardiography in adults: an
update from the American Society of
Echocardiography and the European
Associ-ation of Cardiovascular Imaging. J Am Soc
Echocardiogr(2015);28: 1–39.e14.
Laukkanen JA, Kurl S, Salonen JT, et al. Peak
oxygen pulse during exercise as a predictor for coronary heart disease and all cause
death.Heart(2006);92: 1219–1224.
Levine ME, Crimmins EM. The impact of insulin resistance and inflammation on the association between sarcopenic obesity and
physical functioning. Obesity (Silver Spring)
(2012);20: 2101–2106.
Lim JG, McAveney TJ, Fleg JL, et al.Oxygen
pulse during exercise is related to resting systolic and diastolic left ventricular func-tion in older persons with mild
hyperten-sion.Am Heart J(2005);150: 941–946.
Lundby C, Montero D, Joyner M. Biology of
VO2max: looking under the physiology
lamp.Acta Physiol(2017);220: 218–228.
Narici MV, Maffulli N. Sarcopenia: character-istics, mechanisms and functional
signifi-cance.Br Med Bull(2010);95: 139–159.
Nesto RW, Kowalchuk GJ. The ischemic cas-cade: temporal sequence of hemodynamic,
electrocardiographic and symptomatic
expressions of ischemia. Am J Cardiol
(1987);59: C23–C30.
Nichols S, Taylor C, Ingle L. A clinician’s guide to cardiopulmonary exercise testing
2: test interpretation. Br J Hosp Med(2015);
76: 281–289.
Nichols S, Nation F, Goodman T,et al.CARE
CR-Cardiovascular and cardiorespiratory
adaptations to routine exercise-based cardiac rehabilitation: a study protocol for a com-munity-based controlled study with
crite-rion methods. BMJ Open (2018); 8:
e019216.
Omland T, Sabatine MS, Jablonski KA, et al.
Prognostic value of B-Type natriuretic pep-tides in patients with stable coronary artery
disease: the PEACE Trial. J Am Coll Cardiol
(2007);50: 205–214.
Piepoli MF, Kaczmarek A, Francis DP, et al.
Reduced peripheral skeletal muscle mass and abnormal reflex physiology in chronic
heart failure. Circulation (2006);114: 126–
134.
Piepoli MF, Guazzi M, Boriani G, et al.
Exer-cise intolerance in chronic heart failure:
mechanisms and therapies. Part II.Eur J
Car-diovasc Prev Rehabil(2010);17: 643–648.
Piepoli MF, Corra U, Agostoni P.
Cardiopul-monary exercise testing in patients with heart failure with specific comorbidities.
Ann Am Thorac Soc(2017);14: S110–S115.
Poole DC, Hirai DM, Copp SW, et al.Muscle
oxygen transport and utilization in heart failure: implications for exercise (in)
toler-ance. Am J Physiol Heart Circ Physiol (2012);
302: H1050–H1063.
Rapsomaniki E, Shah A, Perel P, et al.
Prog-nostic models for stable coronary artery dis-ease based on electronic health record
cohort of 102 023 patients. Eur Heart J
(2014);35: 844–852.
Shafiee G, Keshtkar A, Soltani A,et al.
Preva-lence of sarcopenia in the world: a system-atic review and meta- analysis of general
population studies. J Diabetes Metab Disord
(2017);16: 21.
Shelton RJ, Ingle L, Rigby AS, et al. Cardiac
output does not limit submaximal exercise capacity in patients with chronic heart
failure. Eur J Heart Fail (2010); 12: 983–
989.
Shephard RJ. Maximal oxygen intake and
independence in old age. Br J Sports Med
(2009);43: 342–346.
Sutton-Tyrrell K, Mackey RH, Holubkov R,
et al. Measurement variation of aortic pulse
wave velocity in the elderly.Am J Hypertens
(2001);14: 463–468.
Taylor C, Nichols S, Ingle L. A clinician’s guide to cardiopulmonary exercise testing
©2018 The Authors.Clinical Physiology and Functional Imagingpublished by John Wiley & Sons Ltd on behalf of Scandinavian Society of Clinical
Physiology and Nuclear Medicine.
1: an introduction. Br J Hosp Med (2015); 76: 192–195.
Van de Veire NR, Van Laethem C, Philippe
J, et al. VE/Vco2 slope and oxygen uptake efficiency slope in patients with coronary artery disease and intermediate peakVo2.
Eur J Cardiovasc Prev Rehabil (2006); 13: 916–923.
Vescovo G, Serafini F, Facchin L,et al.Specific
changes in skeletal muscle myosin heavy chain composition in cardiac failure: differ-ences compared with disuse atrophy as
assessed on microbiopsies by high resolution
electrophoresis.Heart(1996);76: 337–343.
Whipp BJ, Higgenbotham MB, Cobb FC. Esti-mating exercise stroke volume from
asymp-totic oxygen pulse in humans. J Appl Physiol
(1996);81: 2674–2679.
©2018 The Authors.Clinical Physiology and Functional Imagingpublished by John Wiley & Sons Ltd on behalf of Scandinavian Society of Clinical