A CASE STUDY OF T H E D E V E L O P M E N T OF CAR D E P E N D E N C E IN T E E N A G E R S
Glenn D Lyons Stephen J Swinbank University of Southampton
1. I N T R O D U C T I O N
Substantial resource and research effort is being directed towards encouraging and developing a more sustainable transport system and understanding and influencing the choice between the use of the private car and other forms of transport. In general the objective is implicitly to influence the mode choice decisions of existing, established car users. The work detailed in this paper stems from the premise that attempts to influence such established behaviour, particularly once an individual has purchased a private car, will yield limited returns. Car dependence shapes many adults' present lifestyles to the point of being, or at least appearing, irrevocable.
"At the time o f first purchase, the car may be seen as a luxury. However, once bought, it encourages changes in behaviour and circumstances which in effect turn it into a necessity. Car dependence grows, rather than simple existing."
(Goodwin et al, 1995) The growth of car dependence begins even before the point of car purchase with many people of all ages dependent as car passengers. Ownership serves to reinforce and promote dependence. By considering the travel behaviour o f young people up to the age of seventeen there is the potential to gain a better understanding of the formative factors that influence and shape young people's longer term travel behaviour and car dependence. It may subsequently be possible to develop policies and practices that aim to instil car independent travel behaviour at an impressionable age that could then serve to resist the drift into car dependence beyond the landmark of the driving test. This paper reports on a survey of young people's travel behaviour, opinions and aspirations conducted at two secondary schools. A questionnaire was distributed to some 1000 pupils aged between 11 and 17 at a suburban comprehensive school and a rural private school.
2. TEENAGE TRAVEL
friends and these people must have an influence on their attitudes towards modal choice. The most regular trip for young people is the journey to (and from) school and this has been the predominant focus of research to date concerning young people's travel behaviour.
The proportion of 7 and 8 year-olds allowed to travel to school independently fell from 80 per cent in 1971 to fewer than 10 per cent in 1990 (Sustrans, 1996). The proportion of children aged 5-15 in Great Britain travelling to school by car has increased from 12 per cent in 1975/76 to 27 per cent in 1994/96 (DETR, 1997a). Bradshaw (1995) identified a whole range of factors as to why children (aged 9-13) are increasingly being driven to school by their parents. The rise in car ownership, particularly the increase in two car households, has been recognised as a major factor. This has served to enable parents to address their concerns over road safety and personal safety by replacing walking and cycling journeys by car. Figure 1 shows that between 1970 and 1994, the increase in the proportion of 2 car households is closely matched with the decrease in the proportion o f households with no car.
Primary school children are more likely to be accompanied to school than those at secondary school. Hillman et al. (1993) identified four significant reasons for parental restriction on allowing primary school children to travel to or from school alone. These were traffic danger, child unreliability, fear of molestation and distance. Children who have been taken to school by car from a younger age, due to parental concems, will have become used to travelling this way. At an older age, when parental concerns over safety are likely to be lower, such children may be in a stronger position to pressure their parents into continued transport provision.
Approximately one child in five qualifies to receive transport at its local authority's expense and some 95 per cent of these children travel by bus (Pettitt et al, 1995). However, legislation allowing parents freedom of choice as to which schools they send their children will have resulted in increased school journey lengths for many children whose parents have elected to send them to schools that fall outside the traditional catchment areas. This is likely to further promote car journeys to school. Under the 1944 Education Act, all pupils within the age range 8-16 living further than 3 miles from the school, for the catchment area in which they fall, are entitled to free transport (Ketteridge, 1997). However, if parents do not choose this school then the entitlement is lost as is the financial incentive to use public transport for the school journey.
A substantial proportion of adults rely heavily on their cars for work and increasingly children are being taken to school as part of their parents' journey to work. The rise in more flexible working hours has facilitated this trend. A number of concerns arise about the shift in mode choice for the journey to school:
• child health - a journey to school by cycle or walking contributes to health and wellbeing
• congestion - a significant proportion of peak period traffic is school-related with one source estimating that twenty per cent of peak-hour journeys now consist of school escort journeys (Sustrans, 1996)
Concern has lead to initiatives to kerb the proportion of car dependent school trips. 'Safe Routes to School', an initiative launched by Sustrans, seeks to offer parents and children viable alternatives to the car for the journey to school by developing safer routes for cyclists and pedestrians. Central and local government are now beginning to attune to such aims and the latest Transport Policies and Programme (TPP) guidance invites measures to encourage walking and cycling in an effort to reduce car dependence. The Royal Commission Report on Environmental Pollution (1994) referred to the importance of developing environmentally desirable lifestyles at an early age. Efforts to redress the balance of mode split for the journey to school are clearly one means of addressing this issue.
Other published research concerning young people's travel behaviour appears to have been limited in the context of car dependence, particularly for those of secondary school age upwards. Solomon and Atkins (1995) noted in a study of teenage travel by public transport in London that "teenage travel has not received much attention from transport researchers and analysts". One of that study's conclusions was that by the age of 14 most teenagers are allowed to travel independently on the buses and Underground however the incentive to use public transport is diminished after 16 because fare concessions are removed. This change occurs at a time when most teenagers are still at school or unemployed and also coincides rather unfortunately with the age at which they can begin to learn to drive. A Student Pass scheme in the Netherlands for students aged between 18 and 27 covered over 90 per cent of the country's full time student population. Conditions of the Pass were varied during successive stages of the scheme but 'purchase' of the Pass offered free travel anywhere in the country, by all forms public transport. The impacts of the scheme amounted to a substantial increase in public transport usage and mode share at the expense of cycle use and to a lesser extent car use (Cheung et al, 1996). Such initiatives are a positive step towards the aim of instilling car independent behaviour in young people although more needs to be understood about the underlying factors that govern young people's travel behaviour in the short and long term.
3. STUDY D E T A I L S
A questionnaire survey was designed to collect information concerning the following issues: the journey to school; leisure travel; household characteristics; and learning to drive.
1000 questionnaires were circulated between the two schools: 600 to SBL and 400 to Dauntsey's. Staff at each school had agreed to distribute the questionnaires and collect and remm the responses. Class time was set aside for children from SBL to complete their questionnaires. Although this was not the case at Dauntsey's it is assumed that in a substantial proportion of cases the pupils have completed the questionnaires without the help of their parents. Some of the results may be influenced by the extent to which the young respondents are able to recall distances, times and other factual information accurately.
A total of 479 acceptable responses were received. The 326 from SBL represented a 54 per cent response rate and 36 per cent of all pupils. The 153 from Dauntsey's represented a 38 per cent response rate and 25 per cent of all pupils. Responses were received from students in Years 7 (age 11-12) to 12 (age 16-17). Responses from both schools were received for Years 9-11 however only SBL provided responses for Years 7 and 8 meanwhile Year 12 responses were from Dauntsey's only. 54 per cent of the respondents were female. 15 per cent of the responses from Dauntsey's were from boarders.
4. STUDY RESULTS
4.1 The Journey To School
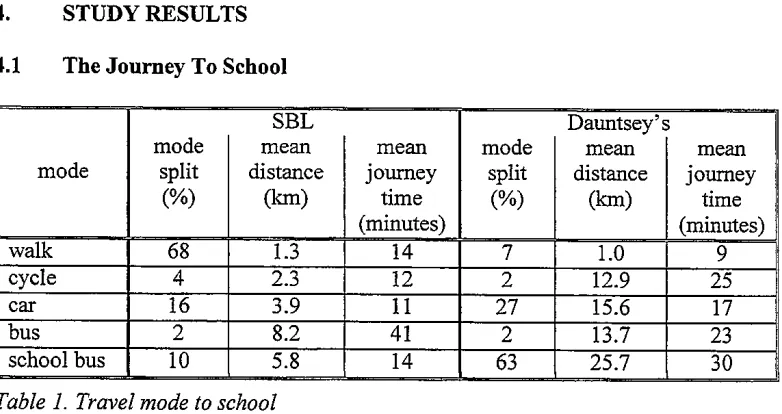
mode walk SBL mode split
(%)
68m e a n distance
(km)
1.3
mean mode
journey split
time (%)
(minutes)
14 7
Dauntsey' s mean distance
(km)
1.0
cycle 4 2.3 12 2 12.9 25
car 16 3.9 I1 27 15.6 17
bus 2 8.2 41 2 13.7 23
school bus 10 5.8 14 63
Table 1. Travel mode to school
25.7
m e a n journey
time (minutes)
9
30
[image:4.612.130.521.350.557.2]reflecting the rural location of the school and the lack of a limiting catchment area. 80 per cent of day pupils travel more than 3 miles to school with 42 per cent travelling more than 10 miles to school. For journeys over 20 miles a higher proportion are made by school bus than by car. This is likely to reflect the increasing difficulty for children to be chauffeured to school as distance increases with less likelihood of the school journey forming part o f a trip chain with the work trip.
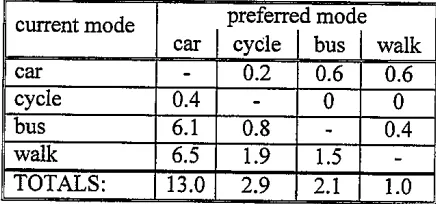
19 per cent of all respondents expressed a desire to travel to school by an alternative mode of transport. Table 2 shows the distribution of desired mode changes. 1.4 per cent of all respondents wished to change from car to an alternative mode which represents over 7 per cent of pupils currently travelling by car. Reasons for not being able to change were distance for walking, weather for cycling and expense or availability for using the bus. However, the substantial proportion of the desired changes are towards car travel to the extent that the proportion of school trips made by car would increase from an average of 19 per cent to 32 per cent. The main reason given for these desired changes not taking place was the lack of someone available to drive the children. Cost was given as an alternative reason in some cases.
current mode
c a r
cycle bus walk TOTALS:
preferredmode car [ ~ e l e ~ s [ walk
- 0.2 0.6 0.6
0.4 0 0
6.1 0.8 0.4
6.5 1.9 1.5
[image:5.612.186.404.297.399.2]13.0 2.9 2.1 1.0
Table 2. Desired mode changes (per cent of total survey sample wishing to change)
A similar issue was addressed in the Sustrans study of 8 secondary and 2 primary schools (Cleary, 1996). For most of the secondary schools, higher proportions of pupils were found to prefer travel to school by car through choice than actually did so. The same was true to a lesser extent for cycling. However, a lower proportion of pupils preferred to use public transport than did so. For the two primary schools, cycling was the most desirable mode at the expense of walking and car which were the main modes used. The study concluded that the greatest interest and potential for promoting cycling rests with school children aged between 10 and 13.
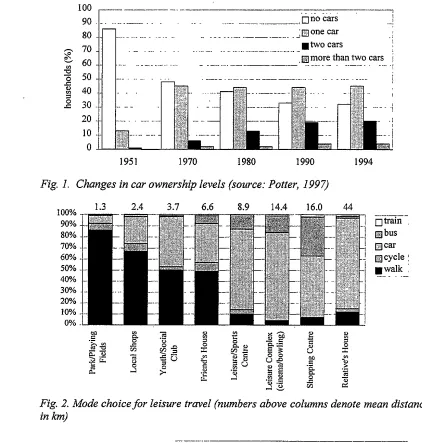
4 . 2 L e i s u r e T r a v e l
car dependence for such trips. There is a substantial change in mode split in favour of the car for travel to a shopping centre, predominantly at the expense of using the bus which currently accounts for over 30 per cent of such trips (the highest proportion of bus use for any of the leisure trips). While it may be encouraging that for the shorter leisure trips a large proportion of respondents intend to continue walking, it is likely that the particular leisure activities identified will become less relevant to respondents as they grow older, or accessibility afforded by the car may lead to alternative longer distance destinations for such activities.
4.3 Household Characteristics
Figure 4 compares the levels of household car ownership for the schools' sample against national figures. The disparity between them is readily apparent. Table 3 provides fiarther comparison. Vehicle ownership for the survey households is substantially higher than the national average. This may be explained by an average household size over one-and-a-half times that of the national average. Indeed, cars per household individual compare well with the national average. However, if cars per adult is considered, both school samples have much higher levels of ownership. If cars per adult is taken as a proxy for household income then the survey sample represents households of above average income. The majority of households in the survey had either one or two children aged under 17. 87 per cent of household members aged 17 or over could drive. This was consistent between schools and compares to 67 per cent of all adults nationally. Nationally, licence holding varies with age, although it is greatest for people in the age range 30-39 at 81 per cent (DETR, 1997b).
cars per household*
National
cars per adult
1.02 individuals per household 2.54 cars per household individual 0.40 0.53
SBL Dauntsey's
1.67 2.11 4.22 4.06 0.40 0.52 0.74 0.79
Combined school sample
1.81 4.18 0.43 0.76 *assumes 3 or more cars equals 3
Table 3. Car availability for household members (national data is for the whole of Great Britain in 1996 (DETR, 1997b))
The figures suggest that either the respondents are collectively atypical of the total population of young people or that households representing young families have a greater need for car use and as a consequence have, on average, higher levels of car ownership. Results from the Sustrans study appear to corroborate the latter with an average of approximately 1.5 cars per household for the pupils surveyed from 8 secondary schools. The respondents are likely to experience car dependent behaviour from older members of their household and with nearly half of the combined SBL/Dauntsey's sample belonging to households with two or more cars, availability of a car for escort trips is likely to be high.
[image:6.612.129.518.405.497.2]of having an increased number of drivers in the family. This is likely to be particularly the case for Year 12 pupils at Dauntsey's, all of whom are aged 17 and are therefore in a position to learn to drive. It is also more likely that respondents in later year groups have older brothers and sisters who either have a car of their own or share a second car with a parent. The trend reflects car ownership rather than use but suggests that car dependence of the household is increased as an almost immediate response to a change in household age structure in relation to the driving age threshold.
4.4 Learning to Drive
Set against the high level of car dependence demonstrated by other household members (assuming ownership is matched with use) it is inevitable that pre-driving age teenagers are likely to be influenced in their own development and aspirations.
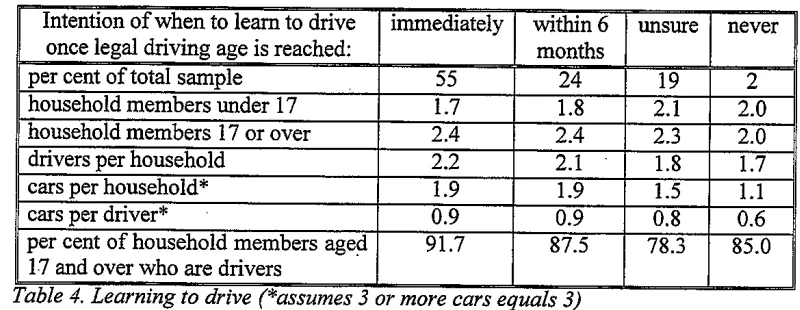
Intention of when to learn to drive once legal driving age is reached: per cent of total sample
household members under 17 household members 17 or over drivers per household
immediately
per cent of household members age d 17 and over who are drivers
Table 4. Learning to drive (*assumes
55 1.7 2.4
never
2 within 6 unsure
months
24 19
1.8 2.1
2.4 2.3
2.1 1.8
1.9 1.5
0.9 0.8
87.5 78.3
2.0 2.0
2.2 1.7
cars per household* 1.9 1.1
cars per driver* 0.9 0.6
91.7
or more cars equals 3)
85.0
The majority of respondents intend to begin learning to drive within 6 months o f reaching the age of 17. Educational preference had no influence upon when respondents intended to learn to drive and those who hoped to continue to University were no more likely to delay learning to drive. Table 4 compares characteristics of the household against the conviction with which respondents wish to learn to drive. The responses regarding learning to drive were reasonably consistent across all Year Groups except for Year Group 7 (11-12 years) where 50 per cent were unsure. Respondents who wish to learn to drive immediately or within 6 months come from older households with a corresponding higher number of drivers and cars compared to households of respondents who are unsure about their intention for learning to drive or who have no intention to learn to drive. Although sample sizes of the latter two categories are much smaller these results imply that the state of car dependence of a household has, not surprisingly, an influence over the expectations of younger members of the household.
[image:7.612.91.491.243.398.2]the national average, the results suggest that the trend in high levels of licence holding is set to continue and may occur at an even earlier age.
Approximately 86 per cent of the entire sample thought that their parents would encourage them to learn to drive, 4 per cent thought that they would not and 10 per cent were unsure. These proportions do not vary much between the schools, although there is slightly higher encouragement for pupils from Dauntsey's. From the respondents wishing to start driving immediately, only a small proportion thought their parents would not give encouragement. At the opposite extreme, of the respondents with no intention to learn to drive, only a small proportion thought their parents would give encouragement. The four most frequently cited reasons (given in open response) for being given parental encouragement in learning to drive were 'so they don't have to take me everywhere' (43 per cent), 'so I become more independent' (22 per cent), ' so I can take them places' (8 per cent), and 'because you are disadvantaged if you don't drive' (7 per cent). Young people see themselves as dependent upon their parents who in turn are dependent upon their cars. By learning to drive they are able to benefit both themselves by gaining independence from their parents, and their parents by reducing the need/obligation to make escort trips.
Financial support from parents will also facilitate and encourage car dependence. 40 per cent of SBL respondents believed that their parents would pay for their driving lessons (the remainder either said no or were unsure). 63 per cent of respondents from Dauntsey's believed that their parents would pay for driving lessons. 69 per cent and 58 per cent of respondents from SBL and Dauntsey's respectively believed their parents would also offer some financial help in buying a car.
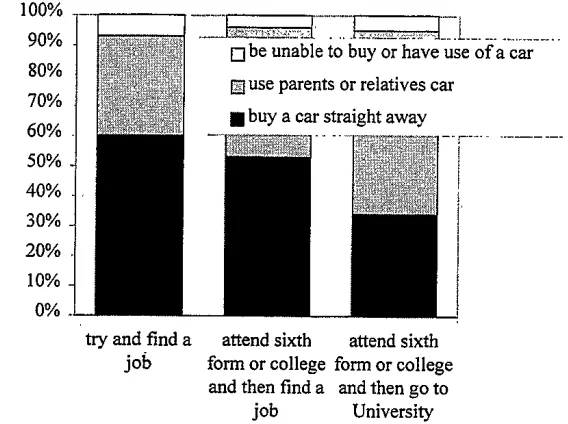
Figure 6 shows the expected degree of access to a car upon passing the driving test according to educational preference. Less than 10 per cent of pupils are unlikely to have access to a car. The progression from use to ownership and use is slowed by further education. This suggests that there may be some opportunity to promote car independent behaviour during years at University when young people are independent from their car dependent families and are far less likely to have access to a car, certainly in their fLrst year at University.
5. CONCLUDING R E M A R K S
Households with children have higher than average levels of car ownership. This reflects both the size of the household and probably the convenience and perceived necessity o f the car for group travel. Consequently young people are living in environments in which the use o f the car is likely to be more prevalent. Young people aspire to adulthood of which car use is seen as an integral part. In this context, making car use less attractive in the minds of parents through new pricing policies and restrictions is likely to influence the intentions of their children.
Young people are aware of the problems arising from increased traffic levels. The four most frequently recognised problems in the survey were air pollution, congestion, number of accidents and the expense of motoring. However such awareness is balanced by their aspirations. When asked to rank eight benefits of car ownership the most important benefits were seen to be freedom to travel to places otherwise inaccessible and independence from parents. The extent to which such benefits could be realised by alternatives to the car is not clear. However, it is likely that for the suburban and rural locations considered in the study the alternatives would not be able to compete.
Young people who have not passed their driving test have to use walking, cycling or public transport if they wish to seek independence from their parents for travel. If they are allowed to travel independently then it is at this age that such modes of travel can be promoted. The survey results indicate that car ownership can be delayed by the pursuit o f further education. At this point young people typically begin living independently from their family for the first time and are far less likely to have access to a car. It would therefore appear to be appropriate to target this age group, particularly for the promotion of public transport. The extent to which this could be successful and cost effective is a separate issue.
This study was limited in scope by resource and timescale constraints. To gain a more detail appreciation of the development of car dependence in young people it would be desirable to use longitudinal panel surveys and study opinion and behaviour in an age range spanning pre-driving age and early post-driving age years. Such an approach would offer much greater insights into family activity and inter-relationships between household members.
References
(1994) Transport and the Environment. Eighteenth Report, Royal Commission on
Environmental Pollution. HMSO.
Bradshaw, R. (1995) Why do parents drive their children to school?, Traffic
Engineering + Control, 36(1), 16-19.
Cheung, Y.H.F., Kroes, E.P. and Hamer, R.N. (1996) The evaluation of the student
pass (new formula) in the Netherlands, Proe. 24 t~ European Transport Forum:
Public Transport Planning and Operations, Brunel University, PTRC.
Cleary, J. (1996) Safe Routes to Schools Project Findings of Schools Survey,
DETR (1997a) Transport Statistics Report: National Travel Survey 1994/96, TSO, London.
DETR (1997b). Transport Statistics Great Britain 1997, TSO, London
Goodwin et al (1995) Car Dependence, RAC Foundation for Motoring and the Environment.
HiUman, M. et al. (1993) Children, Transport and the Quality of Life, Policy Studies Institute, London.
Ketteridge, P. (1997) Modes of transport and provision ofinfras~ucture for journeys to school. Proe. Transport to School, Aston University, May.
Morris, J.M., Richardson, A.J. and MePherson, M. (1996) The emerging needs of the majority - women, young and old. Proe. 20 t~ Australasian Transport Research Forum, Aukland, NZ.
Pettitt, T., Frost, P. and Thomthwaite, S. (1995) Travel to school: influencing modal choice and encouraging safer journeys. Proe. 23 ra European Transport Forum: Traffic Management and Road Safety, University of Warwick, PTRC.
Potter, S. (1997) Vital Travel Statistics. Landor Publishing Limited.
Solomon, J. and Atkins, S. (1995) Teenage travel by public transport in London. Proc. 23 rd European Transport Forum: Public Transport Planning and Operations, University of Warwick, 111-120.
0 0 d = 100 90 80 70 60 50 40 30 20 1 0 0
i ~ one car . I
• two cars
. . . !
, ~ m o r e than two cars I
. .. .. .. . .. .. .. . .. .. .. . .. .. .. . .. .. .. . .. .. . .. .. .. . .. .. .. . .. .. ,
1951 1970 1980 1990 1994
Fig. 1. Changes in car ownership levels (source: Potter, 1997)
100% 90% 80% 70% 60% 50% 40% 30% 20% 10% 0%
1.3 2.4 3.7 6.6 8.9 14.4 16.0
__ ~:~
-- I
N
Fig. 2. Mode choice for leisure travel (numbers above in km)
0
44
~i\!l!~il n train
~ I~bus
i ~ N ~a N car
N c y c l e
. . . • walk m
, , + . . . .
I
0
o
columns denote mean distances
100% 90% 80% 70% 60% 50% 40% 30% 20% 10% 0%
• m-m- o "~
[] continue to use existing mode I~ drive yourself
[image:11.612.58.480.59.502.2] [image:11.612.65.461.60.229.2] [image:11.612.108.466.497.677.2]6O
50 J--.
40 _.
r ~ 30
0
.~ 20
10
' [ 3 Nati3rii~i -
h - - _
',y
no c a r one car t w o cars m o r e than t w o cars
Fig. 4. Household Car Ownership levels (National levels for England and Wales exclude large metropolitan areas).
100%
90% 80% 70% 60% 50% 40% 30% 20% 10% 0%
7 8 9 10 I1 12
Year Group
100% 90% 80% 70% 60% 50% 40% 30% 20% 10% 0%
7 8 9 10
[image:12.612.150.491.71.289.2]Year Group
Fig. 5. Household car ownership by Year Group
[image:12.612.160.480.345.680.2]100%
90% 80% 70% 60% 50% 40% 30% 20% 10% 0 %
try and find a
job
form or college form or college attend sixth attend sixth and then find a and then go tojob University
[image:13.612.145.429.70.282.2]