underlying affective responses to heavy exercise
JONES, Leighton <http://orcid.org/0000-0002-7899-4119>, HUTCHINSON, Jasmin C. and MULLIN, Elizabeth M
Available from Sheffield Hallam University Research Archive (SHURA) at:
http://shura.shu.ac.uk/22608/
This document is the author deposited version. You are advised to consult the publisher's version if you wish to cite from it.
Published version
JONES, Leighton, HUTCHINSON, Jasmin C. and MULLIN, Elizabeth M (2018). In the zone: an exploration of personal characteristics underlying affective responses to heavy exercise. Journal of sport and exercise psychology, 40 (5), 249-258.
Copyright and re-use policy
See http://shura.shu.ac.uk/information.html
1
2
3
4
5
6
In the zone: An exploration of personal characteristics underlying affective responses to 7
heavy exercise 8
9
10
11
12
13
Leighton Jones1, Jasmin C. Hutchinson2, Elizabeth M. Mullin3 14
1
Academy of Sport and Physical Activity, Sheffield Hallam University, UK 15
2
Department of Exercise Science and Sport Studies, Springfield College, USA 16
3
Department of Physical Education and Health Education, Springfield College, USA 17
18
19
20
21
Corresponding author: 22
Dr Leighton Jones. A212 Collegiate Hall, Collegiate Campus, Sheffield Hallam University. 23
Sheffield. S10 2BP. UK. leighton.jones@shu.ac.uk 24
25
“As accepted for publication in Journal of Sport & Exercise Psychology, ©Human Kinetics"
26
27
Abstract 1
Positive affective responses to exercise have been linked with longer term adherence. The 2
Dual-Mode Model indicates that affective responses during heavy exercise (between the 3
ventilatory threshold and the respiratory compensation point) are subject to interindividual 4
variability (zone of response variability). Participants (N = 48) completed measures to assess 5
personal characteristics prior to a graded exercise test (GXT). Responses to the Feeling Scale 6
were recorded during the GXT and subsequently used to group participants as either Negative 7
Responders or Neutral/Positive Responders to heavy exercise. Discriminant Function 8
Analysis was applied and a significant weighted linear composite predicted affective 9
response. Preference for exercise intensity and sex were significant predictors (p = .003). 10
Negative Responders had lower Preference scores and were more likely to be men. The 11
combination of these two variables successfully predicted group membership 71% of the 12
time. Individual differences appear relevant when examining affective responses to heavy 13
exercise. 14
15
Introduction 1
Under the broader perspective of motivational hedonism, asserting that human 2
behaviour is driven by a pursuit of pleasure and avoidance of displeasure (Mees & Schmitt, 3
2008), exercise researchers are seeking to understand alternative ways by which to tackle the 4
physical inactivity crisis. There is renewed awareness of the role that affective responses to 5
exercise might have in determining longer-term adherence (Ekkekakis, 2017; Ekkekakis & 6
Dafermos, 2012). This awareness has, in part, been heightened by a number of studies that 7
have demonstrated a link between acute affective responses to exercise and maintenance of 8
exercise programs (Hagberg, Lindahl, Nyberg, & Hellénius, 2009; Williams, Dunsiger, 9
Jennings, & Marcus, 2012). However, factors underlying individual affective responses to 10
exercise are less well understood, with factors such as personality (Rhodes & Smith, 2006), 11
Body Mass Index (BMI; Ekkekakis, Lind, & Vazou, 2010), and intensity of exercise 12
(Ekkekakis, Parfitt, & Petruzzello, 2011) shown to be relevant. 13
The dual-mode model (DMM; Ekkekakis, 2003) conceptualises affective responses 14
across a range of exercise intensities and the tenets of the model have received strong 15
empirical support (Parfitt, Rose, & Burgess, 2006; Welch, Hulley, Ferguson, & Beauchamp, 16
2007; Rose & Parfitt, 2007). According to the model, affective valence (pleasure) changes as 17
a function of exercise intensity. Pleasure typically increases during low and moderate exercise 18
intensity up to the respiratory marker of ventilatory threshold (Tvent). Affective responses 19
become more variable at heavy exercise intensities (i.e., proximal to Tvent and up to respiratory 20
compensation point; RCP) wherein some people continue to experience an increase in 21
pleasure and others experience a decline in pleasure. This exercise intensity has consequently 22
been labelled as the "zone of response variability" (p. 47) in terms of affective responses 23
(Ekkekakis, 2013). As exercise intensity transitions to severe levels (beyond RCP), there is 24
reasons for the variable affective response during heavy exercise, but Ekkekakis (2003) 1
proposed that the interplay of cognitive appraisal and interoceptive cues drives such 2
variability. A greater understanding of what is driving these interindividual differences in 3
affective responses to exercise may help practitioners to personalise exercise prescriptions and 4
therefore deliver exercise experiences that are more consistently pleasurable, and in turn, 5
more sustainable. 6
In a study seeking to further understand the cognitive factors influencing affective 7
responses at an exercise intensity proximal to Tvent,Rose and Parfitt (2010) adopted a 8
qualitative approach using a ‘think aloud’ procedure. Thematic analysis revealed concepts 9
relating to pre-exercise affective state, perceptions of ability, immediate and anticipated 10
outcomes, attentional focus, and perceptions of control as salient in determining affective 11
response. This approach afforded the researchers a rich insight into participants’ cognitions 12
but limited the researchers’ capacity to account for the role of traits in determining affective 13
responses at this exercise intensity. Jones, Karageorghis, Lane, and Bishop (2017) examined 14
dominant attentional style and motivation as predictors of affective responses to group 15
exercise and results revealed that individuals with a dominant associative attentional focus 16
and self-determined motivation derived the greatest pleasure from sessions. However, their 17
study did not examine responses in relation to Tvent and it is unknown how influential these 18
specific individual factors are in determining affective responses in the zone of response 19
variability. There are a number of traits that are likely determinants of affective responses 20
during exercise. Previous research has indicated that these might include preference for, and 21
tolerance of, exercise (Ekkekakis, Hall, & Petruzzello, 2005), and traits from classic 22
personality theories (e.g., extraversion, and sensation seeking; Ekkekakis, Hargreaves, & 23
Parfitt, 2013; Zuckerman, 1983). However, few studies have sought to address these traits in 24
Hall, Petruzzello, Ekkekakis, Miller, and Bixby (2014) discussed how individual 1
differences could play a role in exercise testing and prescription, but noted that these 2
differences have been understudied in this context. Hall et al. examined preference for, and 3
tolerance of, exercise intensity across a range of exercise testing protocols. Preference for 4
exercise intensity is described as the “predisposition to select a particular level of exercise 5
intensity when given the opportunity” and tolerance is “a trait that influences one’s ability to 6
continue exercising at an imposed level of intensity beyond the point at which the activity 7
becomes uncomfortable or unpleasant” (Ekkekakis et al., 2013; p.354). Preference has been 8
shown to be a relevant factor in self-selecting exercise intensity (Smith, Eston, Tempest, 9
Norton, & Parfitt, 2015). Further, Hall et al.’s (2014) findings that preference and tolerance 10
were positively correlated with performance in exercise tests indicated these characteristics 11
are relevant for exercise testing and prescription. However, their study did not explore the 12
relationship between preference, tolerance, and affective responses to exercise. Among the 13
scant previous work exploring the relationship between preference and tolerance, and in-task 14
affective responses was Ekkekakis et al.’s (2005) study where they found that preference and 15
tolerance were significantly correlated with Feeling Scales scores above Tvent. Ekkekakis et al. 16
also examined the ability of the PRETIE-Q scales to predict affective responses to bouts of 17
physical activity at different levels of intensity using hierarchical multiple regression 18
analyses. The Preference and Tolerance scales both accounted for significant portions of the 19
variance in affective valence when exercise intensity was at Tvent, while only the Tolerance 20
scale accounted for significant portions of the variance when the intensity exceeded Tvent. 21
Neither scale was significantly related to affective responses below Tvent. It appears that 22
preference and tolerance are relevant variables in the context of affective response during 23
moderate to vigorous exercise and warrant additional research attention. The previous work 24
attention should be given to examining these relationships in older and less active populations 1
(Ekkekakis et al., 2005). 2
Outside of physical activity contexts, personality traits have been associated with 3
affective experience in day-to-day life (e.g., Larsen & Ketelaar, 1989). The Big Five 4
personality model (extraversion, neuroticism, openness, agreeableness, and 5
conscientiousness) was proposed as a generalizable model to examine psychological and 6
behavioural outcomes (De Raad, 2000), and has been the subject of voluminous empirical 7
work. In their seminal work, Costa and McCrae (1980) demonstrated that extraversion related 8
strongly to positive affect and neuroticism to negative affect. Further work has identified a 9
link between conscientiousness and trait positive affect (Watson, David, & Suls, 1999), and 10
this link has since been extended by Lochbaum and Lutz (2005) who found higher 11
conscientiousness was associated with greater enjoyment of a step aerobics class. The 12
influence of personality on exercise has been subject to extensive research (Rhodes & Smith, 13
2006; Rhodes & Pfaeffli, 2012) but early work in the area led to a number of inconsistent 14
findings (see Hall et al., 2014). More recent meta-analyses have sought to clarify the role of 15
personality in exercise and health contexts (Wilson & Dishman, 2015). Conceptually, it has 16
been proposed that extraverts seek out strong sensory stimuli (Eysenck, Nias, & Cox., 1982), 17
and that physical activity might fulfil a drive for stimulation. Neuroticism is related to 18
heightened autonomic responsiveness to intense stimuli and individuals with high neuroticism 19
tend to be predisposed to negative affect (Gray, 1991); this could account for negative affect 20
during exercise if the increased physiological arousal is perceived negatively (Wilson & 21
Dishman, 2015). Individuals with a greater degree of openness are receptive to new 22
experiences and different types of physical activity, and a recent analysis by Wilson and 23
Dishman (2015) revealed a correlation between openness and physical activity. It has been 24
Markland, & Sheppard, 2004); a greater capacity to regulate feelings when interoceptive cues 1
are challenging the maintenance of positive emotions (i.e., above Tvent) would be beneficial 2
for maintaining a pleasant exercise experience. 3
There is evidence that high levels of extraversion and conscientiousness and low 4
levels of neuroticism relate to high levels of physical activity among younger adults (Rhodes 5
& Smith, 2006). Further, high levels of extraversion, openness, conscientiousness, or low 6
levels of neuroticism in older adults results in greater energy expenditure at peak walking 7
pace (Terracciano et al., 2013). However, there does not appear to be a relationship between 8
agreeableness and physical activity (Wilson & Dishman, 2015). There is a pattern between 9
personality dimensions and physical-activity levels that appears relatively consistent across 10
age groups, culture, gender, and activity modes (Rhodes & Pfaeffli, 2012). While the 11
evidence linking personality and behaviour has developed, there has been less focus on the 12
role that personality can play in how people feel during exercise. Beyond the Big Five 13
dimensions, Schneider and Graham (2009) found that behavioural inhibition was correlated 14
with decreases in pleasure during “hard” intensity exercise (average of work rate at Tvent and 15
VO2peak). However, the “hard” exercise intensity employed in the Schneider and Graham 16
(2009) study makes inference to the DMM difficult as this average work load might have 17
been above or below RCP depending upon an individual’s fitness; if above RCP this would 18
have likely led to a sharp decline in pleasure, but if below, would have led to a more variable 19
response. 20
The links expounded in previous work between the Big Five dimensions and the 21
amount of physical activity done might, in part, be a consequence of how individuals feel 22
during exercise (i.e., they undertake more exercise because it feels good). An examination of 23
whether individuals with certain personality traits respond more favourably during physical 24
between personality traits and physical activity behaviour. 1
Sensation seeking has been proposed as a distinct trait and has been linked to high-risk 2
sport participation (e.g., Jack & Ronan, 1998), but its role in exercise is less well understood. 3
Zuckerman (1994) defined sensation seeking as “the seeking of varied, novel, complex, and 4
intense sensations and experiences and the willingness to take physical, social, legal, and 5
financial risks for the sake of such experiences” (p.27). Hedonic allostasis theory (Koob & Le 6
Moal, 1997) conceptualises certain behaviours (e.g., sensation seeking, compulsive exercise) 7
as a response to hypoactivity in dopamine systems (Dishman & Holmes, 2012). The 8
behaviors (i.e., physical activity) are engaged in to restore normal hedonic tone, and recent 9
evidence has shown that sensation seeking might be more strongly characterised by the 10
intensity of an experience, rather than the novelty (Minkwitz et al., 2016). The findings of 11
Minkwitz et al. (2016) indicated that individuals with high sensation seeking scores expended 12
more energy during everyday activities, and the intensity element of sensation seeking was 13
significant in this relationship. The preference for experiences of greater intensity alludes to 14
more positive affective response to such activities and the results of Minkwitz et al. (2016) 15
could suggest that sensation seeking is a relevant variable in understanding affective 16
responses in an exercise context where the intensity of the experience can vary greatly. 17
In his proposal for the DMM, Ekkekakis (2003) highlighted a void in the literature 18
pertaining to personality and affective responses to exercise, stating that this “is partly due to 19
the fact that the standard measures of relevant personality traits (e.g., extraversion, sensation 20
seeking, behavioural activation/inhibition, etc.) emphasise social behaviour over responses to 21
somatosensory stimuli…Nevertheless, individual differences are likely to play an important 22
role” (p. 221). The purpose of this study was to explore the extent to which a range of 23
personal characteristics influence affective responses in the zone of response variability (i.e., 24
characteristics pertaining to social behaviour (cognitive) and responses to somatosensory 1
stimuli (interoceptive). Given the exploratory nature of the study and the scant previous work 2
examining the role of personality variables in determining affective responses at specific 3
exercise intensities, we tentatively hypothesised that individuals who experience a decline in 4
pleasure during heavy exercise will: report a lower preference for, and tolerance of, exercise 5
intensity (H1); lower scores on the personality dimensions of extraversion, openness, 6
conscientiousness, and higher on neuroticism (H2); score lower on the sensation seeking scale 7
(H3). 8
Methods 9
The experimental approach was approved by ethics committees at the host institutions in England 10
and the USA. All aspects of the study conform to the Helsinki Declaration on Human Rights 11
(2013). 12
Participants 13
Participants were recruited to this multisite study from England and the USA. 14
Advertisements for participants were placed at two institutions and recruitment relied upon a 15
snowball sampling strategy. Participants were eligible for inclusion if they were free from 16
cardiorespiratory disease and had no other health contraindications; participation did not 17
require a certain level of physical fitness or BMI and the upper and lower age limit was 64 18
years and 18 years, respectively. No significant mean differences (all ps > .05) were found in 19
age, BMI, and VO2peak between the two sites (Table 1). Experimental participants were aged 20
between 18-50 years (Mage = 30.33, SD = 7.54) and included 21 women and 27 men. The 21
physical fitness of the participants ranged from unfit to highly trained (self-reported) which 22
was evident in the range of VO2peak data recorded (Range 21.68–66.01ml/kg/min; M = 23
45.68, SD = 9.35). BMI ranged from 18.4–43.82 kg/m2 (M = 25.3, SD = 4.4). Descriptive 24
by testing site. The sample included participants from a wide range of ethnicities and 1
sociocultural backgrounds. 2
Measures 3
Before Exercise. Preference for, and Tolerance of, the Intensity of Exercise 4
Questionnaire (PRETIE-Q; Ekkekakis, Hall, & Petruzzello, 2005).Participants completed 5
the PRETIE-Q to identify preferred intensity of exercise and tolerance of exercise intensity. 6
The questionnaire comprises 16 items with a response scale ranging from 1 (I totally 7
disagree) to 5 (I totally agree). Items to identify preference for exercise intensity included 8
“I’d rather go slow during my workout, even if that means taking more time” and “When I 9
exercise, I usually prefer a slow, steady pace”. Items to identify tolerance of exercise intensity 10
included “When my muscles start burning during exercise, I usually ease off some” and 11
“Feeling tired during exercise is my signal to slow down or stop”. Cronbach’s alpha levels of 12
0.84 for the Preference scale and 0.80 for the Tolerance scale represent satisfactory internal 13
consistency (Hall et al., 2014). In the current study, Cronbach’s alpha was .84 for the 14
Preference scale and .75 for the Tolerance scale. 15
International Personality Item Pool (IPIP - Inventory based on Costa and McCrae's 16
[1992] NEO-PI-R Domains). Public domain scales from the IPIP (Goldberg et al., 2006) 17
were used to measure the Big Five dimensions of personality (extraversion, openness, 18
conscientiousness, agreeableness, neuroticism). The public domain scales have been shown to 19
correlate highly with the commercial scales of the NEO Five-Factor Inventory (Costa & 20
McCrae, 1992) and have strong evidence to support their validity (Goldberg et al., 2006; 21
Ingledew & Markland, 2008). The 50-item questionnaire included 10 items for each of the 22
five subscales and a response scale of 1 (very inaccurate) to 5 (very accurate) was used for 23
each item. Items were phrased as statements (e.g., “Am interested in people”; “Keep in the 24
statement was accurate. Cronbach’s alpha for the IPIP in the current study ranged from .76 1
(Conscientiousness) to .91 (Extraversion), and therefore was considered to have adequate 2
internal consistency. 3
Sensation Seeking Scale-V (V; Zuckerman, Eysenck, & Eysenck, 1978). The SS-4
V was administered to assess the participant’s need for varied, novel, intense, and complex 5
sensations and experiences. The scale comprises 40 items that require a forced-choice 6
between two statements. Participants are instructed to indicate “which of the choices most 7
describes your likes or the way you feel”, and the overall score for the 40 items represents a 8
general sensation seeking score. Internal consistency coefficients for the subscales within the 9
SS-V ranged from 0.67 – 0.84 (Zuckerman, 1979). In the current study, Kuder Richardson 10
KR-20 coefficient was calculated as .83 for the general sensation seeking score. 11
During Exercise. The Feeling Scale (FS; Hardy & Rejeski, 1989).In-task affective 12
valence was assessed using Hardy and Rejeski’s (1989) 11-point Feeling Scale which has a 13
single-item response scale ranging from +5 (very good) to -5 (very bad). The scale has 14
demonstrated satisfactory validity (Hardy & Rejeski, 1989). 15
Procedure 16
Participants attended a single testing session during which they completed the 17
questionnaires prior to exercise. Participants were familiarised with the in-task measures and 18
then began a treadmill protocol designed to elicit maximal capacities (a continuous ramp test 19
based on the Bruce Protocol [Will & Walter, 1999]). The protocol maintained the 3 min stage 20
markers of the Bruce Protocol (e.g., 12% gradient and 2.5mph at min 6, 14% gradient and 3.4 21
mph at min 9), but the gradient and treadmill belt velocity increased gradually every 15s 22
rather than steeply every 3 min. Participants were asked to respond to the FS 10s prior to the 23
end of each 1-min of the protocol, and were asked to exercise until volitional exhaustion. The 24
pointed to a number on the scales, which were held directly in front of them whenever 1
responses were required. After each response, a researcher repeated the participant’s selection 2
aloud to ensure accuracy; the participant confirmed the number non-verbally with a nod or 3
‘thumbs up’ gesture. 4
Breath-by-breath data were collected throughout the exercise protocol using gas 5
analysers (Ultima, Medical Graphics [UK]; Sensor Medics 2900, Sensor Medics Corp 6
[USA]). These data were analysed independently by two members of the research team who 7
identified the ventilatory threshold (Tvent) and respiratory compensation point (RCP). Analysis 8
was conducted using Winbreak software (Ekkekakis, Lind, Hall, & Petruzzello, 2008) and 9
was based on the three-method procedure described by Gaskill et al. (2001) for Tvent. and a 10
slightly modified version of Beaver, Wasserman, and Whipp’s (1986) procedure for RCP, 11
based upon the relationship between minute ventilation and carbon dioxide output (see 12
Ekkekakis et al., 2008). In instances where the identification of Tvent and RCP differed 13
between the members of the research team (n = 2), data were referred to an independent, 14
accredited physiologist to decide upon the threshold points. 15
Data Analysis 16
A change in FS score (∆FS) during heavy exercise (i.e., zone of response variability) 17
was calculated for each participant by subtracting the FS score reported immediately prior to 18
reaching RCP from the FS score reported during the minute in which Tvent was reached. 19
Participants were then divided into two groups based on this score: Negative Responders (n = 20
28), among whom change in FS score ranged from -3 to -1, and Neutral/Positive Responders 21
(n = 20), among whom the change in FS ranged from 0 to +2. Neutral responders were 22
grouped with positive responders owing to the assumption that maintaining or increasing 23
pleasure at this exercise intensity is beneficial compared to a decline in pleasure with regards 24
Responder Group was used as the dependent variable in a series of Predictive 1
Discriminant Function Analyses (PDA). The purpose of Discriminant Analysis (DA) is to 2
predict group membership from a series of continuous predictor models. DA can be used to 3
test a prediction hypothesis (PDA) or as a multivariate post hoc to a significant one-way or 4
factorial MANOVA (Descriptive Discriminant Analysis) to describe the nature of the 5
differences between groups (Barton, Yeatts, Henson, & Martin, 2016; Warner, 2013). Like 6
Multiple Regression, DA develops an optimal weighted linear composite or function from a 7
set of continuous predictors for the purposes of prediction. However, in DA the purpose is to 8
develop one or more optimal functions (depending on the number of groups and/or predictors) 9
which optimize between groups variance and minimize within groups variance (Warner, 10
2013). 11
In the first model, personal factors including Tolerance, Preference, Extraversion, 12
Agreeableness, Conscientiousness, Neuroticism, Openness, and Sensation Seeking, were 13
identified as predictor variables. Alpha was set at .05. An arbitrary cut-off point to evaluate 14
structure and standardized coefficients was set at 0.5 (Warner, 2013). A classification table 15
was requested to more fully examine the extent of the discrimination by the weighted linear 16
composite. All data were analysed using SPSS version 23. 17
After reviewing the model, predictors that did not contribute substantially to the model 18
were removed. A second model was developed to assess how the remaining personal factors 19
as well as key demographics (age, sex, BMI, and VO2peak), predicted group membership. 20
Sex was dummy coded (men = 0, women = 1). A final model was developed with only 21
substantially contributing predictors. 22
Results 23
Descriptive statistics for the predictor variables are presented in Table 2 and 24
analysis, data were screened for normality, skewness, and other basic assumptions. No major 1
deviations from skewness or normality were detected. No outliers were found in the data 2
beyond 3.29 standard deviations of the mean (Warner, 2013). 3
Basic assumptions of the PDA were reviewed. The Box M test was non-significant (p 4
> .05), suggesting the assumption of homogeneity of variance/covariance was met. A single 5
weighted linear composite was generated as a result of the PDA. The weighted linear 6
composite was statistically significant, Λ = 0.679, χ2
(8) = 16.27, p = .039. The resulting 7
moderate eigenvalue and large squared canonical correlation (Rc2) were .473 and .321, 8
respectively. A review of the structure coefficients identified that only Preference (-.642) had 9
a structure coefficient greater than the identified cut-off value of 0.5, suggesting it is the only 10
predictor which substantially correlated to the outcome of the predictive function. Scores on 11
the Preference scale explained 41.2% of the variance in the composite. This finding is further 12
supported when reviewing univariate one-way ANOVAs, where the two groups significantly 13
differed only on Preference when using a Bonferonni correction (α = .05/8 = .006), among the 14
eight predictor variables, Λ = .837, F(1, 46) = 8.977, p = .004 (mean data are presented in 15
Table 1). 16
A standardized weighted linear composite was developed to predict group 17
membership. When examining the standardized coefficients (analogous to the standardized 18
slopes or betas in regression; Barton et al., 2016), Preference (-1.023) was the only slope 19
above the cut off value. Participants predicted to be in the Negative Responder group reported 20
lower scores on the Preference scale. While Sensation Seeking (.496) and Conscientiousness 21
(.477) approached the cut off value, the corresponding structure coefficients were weak (.175 22
and .257, respectively). All other measured trait variables only weakly influenced the 23
predicted scores. A summary of the structure and standardized coefficients is presented in 24
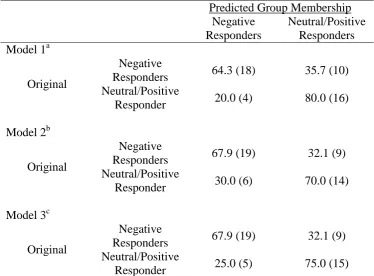
= 34) of participants in the current study. More specifically, membership for 64.3% (n = 18) 1
of Negative Responders and 80% (n = 16) of Neutral/Positive Responders was predicted 2
correctly. The classification table is presented in Table 5. 3
In a second model, Preference was retained as a predictor, while age, sex, BMI, and 4
VO2peak were added as predictors to the model. The weighted linear composite was 5
significant, Λ = .741, χ2
(5) = 13.047, p = .023, Rc2 = .259. When reviewing the standardized 6
slopes in the second model, Preference (.611) and sex (.816) were substantial contributors to 7
predicting group membership such that members of the predicted Negative Responder group 8
had lower Preference scores and were more likely to be male. Only Preference and sex 9
substantially correlated with the function in Model 2 (.747 and .657, respectively). Structure 10
and standardized coefficients are presented in Table 4. Overall, 68.8% (n = 35) of participants 11
were correctly classified by the weighted linear composite, where 67.9% (n = 19) of Negative 12
Responders and 70% (n = 14) of Neutral/Positive Responders were correctly classified. 13
Classification results are presented in Table 5. 14
A final model was run with only Preference and sex as the critical predictors of group 15
membership. The weighted linear composite was significant, Λ = .769, χ2
(2) = 11.821, p = 16
.003, Rc2 = .231. Preference and sex substantially contributed to the prediction of group 17
membership (.714 and .599 standardized coefficients, respectively) and correlated with the 18
weighted linear composite (.806 and .709 structure coefficients, respective). 70.8% (n = 34) of 19
participants were classified correctly by the resulting function, where 67.9% (n = 19) of 20
Negative Responders and 75% (n = 15) of Neutral/Positive Responders were classified 21
correctly. Model 3 coefficients are presented in Table 4 and classification results for are 22
presented in Table 5. 23
Discussion 24
characteristics on affective responses to exercise in the zone of response variability (i.e., 1
exercise intensity between Tvent and RCP). Participants were grouped as either Negative 2
Responders or Neutral/Positive Responders based upon the trajectory of affective valence (i.e. 3
∆FS) between Tvent and RCP. Negative responders had lower scores on the PRETIE-Q 4
Preference subscale, and were more likely to be male. 5
Preference for Exercise Intensity 6
The lower PRETIE-Q Preference scores observed in Negative Responders are in line 7
with theoretical predictions. In previous work, both the Preference and Tolerance subscale of 8
the PRETIE-Q accounted for significant portions of the variance in affective valence at Tvent, 9
and the Tolerance scale accounted for significant portions of the variance when the intensity 10
exceeded Tvent (Ekkekakis et al., 2005). In the present study, Preference was a substantial 11
predictor of group membership based on affective response to exercise in the zone of response 12
variability but Tolerance was not, therefore H1 is partially accepted. Our findings pertaining to 13
Preference demonstrate the importance of considering preferred exercise intensity when 14
prescribing exercise in order to optimize affective response, and in turn, adherence. Exercise 15
is often prescribed based on intensity zones (e.g., by personal trainers or training plans) but 16
these prescriptions do not account for individual affective responses to different exercise 17
intensities. For example, high-intensity interval training (HIIT) receives notable media 18
coverage and endorsement as it is portrayed as a time efficient way for individuals to garner 19
physiological benefits from exercise (e.g., Gillen & Gibala, 2014). However, exercise at such 20
intensities might not be suitable for all individuals and a negative affective response to high 21
intensity exercise could lead to poor adherence (Oliveira, Slama, Deslandes, Furtado, & 22
Santos, 2013; Saaniloki et al., 2015). ACSM exercise prescription guidelines (2018) identify 23
moderate intensity exercise as 46-63%VO2max and vigorous intensity as 64-<91%VO2max. 24
91.7±6.5% VO2peak, respectively. This offers additional support that the present data are of 1
relevance to exercise professionals as the intensity examined is within the ranges of moderate 2
and vigorous intensity exercise that are currently part of the PA guidelines worldwide. 3
Affect is viewed within behavioral economics as one of the major factors driving 4
human decision-making. Put simply, humans tend to repeat what makes them feel better and 5
avoid what makes them feel worse (Ekkekakis & Dafermos, 2012). Preliminary findings in 6
exercise psychology show that affective responses to exercise predict subsequent exercise 7
behaviour (e.g., Williams et al, 2012; Rhodes, Fiala, & Connor, 2009). Therefore, using 8
preference for exercise intensity to tailor exercise prescriptions to optimize the subjective 9
experience of exercise may be a promising way to improve exercise adherence. The 10
preference scale of the PRETIE-Q could be used to develop a protocol for screening 11
individuals who might be predisposed to negative affective response during heavy exercise 12
(i.e., above Tvent but below RCP). In practice, the questionnaire could be administered prior to 13
the commencement of an exercise program and if an individual reported a score >30 14
(according to present data; Table 2) the practitioner could be more confident that an 15
individual would respond to heavy exercise in a neutral or positive manner. If an individual 16
reports a score <30, then the practitioner could consider programming exercise at intensities 17
below Tvent as the individual will likely respond negatively to exercise intensities above Tvent, 18
which will in turn impact upon adherence. 19
Present results also lend support to the implementation of affect-regulated exercise, 20
which has been cited as a viable way in which to minimise feelings of displeasure during 21
exercise (Parfitt, Alrumh, & Rowlands, 2012). Recent evidence has demonstrated that 22
exercising at an intensity that feels ‘good’ leads to a meaningful intensity for cardiovascular 23
benefits (Schneider & Schmalbach, 2015) across active (Hutchinson et al., 2018) and 24
regulated exercise offers an easily implementable way for individuals to regulate their 1
exercise intensity per their individual preference while ensuring a pleasant experience. 2
The findings for Tolerance are inconsistent with previous reports (Ekkekakis et al., 3
2005; Tempest & Parfitt, 2016) and this might be a consequence of the limited amount of 4
time spent working above Tvent. In the present study, participants spent an average of 5
3.18±1.13 min working at intensities between Tvent and RCP, whereas previous work has 6
employed a continuous workload protocol (e.g., 15min [Ekkekakis et al., 2005]). The short 7
period of time might have been insufficient to capture the unique contribution of tolerance of 8
exercise intensity. 9
Big Five Personality Factors and Sensation Seeking 10
Research on personality and exercise behaviour has largely focused on the relationship 11
with volume of physical activity, as well as long-term health outcomes. Minimal attention has 12
been paid to the role that personality can play in how people experience exercise, despite 13
accumulating evidence that the pleasure or displeasure experienced during exercise can 14
influence subsequent physical activity (e.g., Hagberg et al., 2009; Williams et al., 2012). In 15
the present study, personality dimensions from the Big Five factor structure and Sensation 16
Seeking did not effectively discriminate between the two affective response groups, thus H2 17
and H3 are not accepted. 18
To our knowledge, there is no previous work to draw upon regarding the relationship 19
between personality factors and affective experiences during exercise at varying workloads. 20
In one of the few studies to investigate the influence of personality on the subjective 21
experience of exercise, Lochbaum and Lutz (2005) observed that participants who reported 22
greater enjoyment of a step-aerobics exercise session were more conscientious and less 23
neurotic. There is also consistent evidence that conscientiousness is positively related to 24
with greater self-reported PA (Rhodes & Smith, 2006). In the present study, 1
Conscientiousness (.477) approached the standardized coefficient cut off value of 0.5, 2
although the corresponding structure coefficient (.257) indicated it was a relatively weak 3
predictor of group membership. 4
It is somewhat surprising that extraversion did not differ between the two affective 5
response groups given the extensive body of literature linking extraversion with positive 6
affect (e.g., Watson & Clark, 1992). Indeed, the experience of positive emotions is considered 7
to be a facet of extraversion (Costa & McCrae, 1992). Future investigations might benefit 8
from studying the lower-order facets of personality, which often show differential 9
relationships with performance criteria. For example, conscientiousness has been 10
characterized as having both proactive (e.g., need for achievement, self-discipline) and 11
inhibitive (e.g., cautiousness, self-control) aspects which may differentially influence health 12
and exercise behavior (O’Connor, Conner, Jones, McMillan, & Ferguson, 2009). With respect 13
to the affective experience of exercise, the lower-order extraversion facets of positive 14
affectivity, and activity seem particularly worthy of investigation (Rhodes, Courneya, &
15
Jones, 2002). 16
Our hypothesis pertaining to sensation seeking (H3) was based on findings that suggest 17
high sensation seekers expend more energy during everyday tasks (Minkwitz et al., 2016), 18
and sensation seekers seek out "intense sensations". In light of our null findings, it is possible 19
that the intensity of sensations experienced between Tvent and RCP were not high enough to 20
satisfy high sensation seekers. Alternatively, the task itself may have been unappealing to 21
high sensation seekers. Sensation seeking is highly correlated with impulsivity and involves 22
pursuit of targeted rather than merely general stimulation (Arnett, 1994). Moreover, sensation 23
seekers express a greater need for autonomy (Zuckerman, 1994) which is largely absent in the 24
The weak contribution of personality variables (the Big Five and Sensation Seeking) 1
suggests that accounting for such social cognitive variables is of limited utility when seeking 2
to understand and predict affective responses to heavy exercise. It appears that measures 3
including greater acknowledgement of interoceptive sensations are more effective at 4
accounting for affective responses during heavy exercise. The dual-mode model (Ekekkakis, 5
2003) postulates that there is interplay between social cognitive factors and interoceptive cues 6
in the zone of response variability; the present results indicate that the interplay is dominated 7
by an individual's interpretation of those interoceptive cues (manifest in an expression of 8
preference for exercise intensity), and it is that which predominates affective responses during 9
heavy exercise. The capacity of broad personality dimensions (extraversion, neuroticism, 10
openness, agreeableness, conscientiousness, and sensation seeking) to help researchers and 11
practitioners individualise exercise programs appears limited. 12
Sex and affective response 13
Relevant demographics (age, sex, BMI, and VO2peak) were added to the model with 14
the aim of enhancing the practical application of the findings. The significant contribution of 15
sex indicates that practitioners could consider this alongside preference for exercise intensity 16
when designing exercise programmes. There is scant work examining sex differences in 17
affective responses to exercise, with studies typically including one sex (e.g., Ekekkakis et al., 18
2010; Jones et al., 2017) or not exploring differences between their participants (e.g., Kwan & 19
Bryan, 2010; Schneider & Schmalbach, 2015; Sheppard & Parfitt, 2008). This preliminary 20
finding could indicate that future investigations examining different affective responses to 21
exercise between the sexes could be fruitful and offers further options in the personalisation 22
of exercise programs. 23
In non-exercise settings, men and women have been found to differ in the use of 24
or reduce emotion-expressive behavior more often than women (Gross & John, 2003). This 1
pattern of gender differences is often explained in terms of social norms (Smieja, Mrozowicz, 2
& Kobylińska, 2011), but there is accumulating evidence of sex-related structural differences 3
in the prefrontal cortex that are “meaningfully related to affective individual differences, 4
including emotion-regulation strategies, expression and experience” (Welborn et al., 2009, 5
p.334). A review of functional neuroimaging studies supports the notion that men and women 6
use different strategies to down-regulate negative emotions, and that these strategies might be 7
mediated by different neural circuitry (Whittle, Yücel, Yap, & Allen, 2011). 8
Limitations and Future Research 9
Affective responses were recorded during a GXT to account for the entire range of 10
exercise intensities and to anchor responses around relevant respiratory markers. This 11
laboratory-based exercise test is not representative of a typical exercise session or setting, 12
therefore different modes of exercise and environments may yield different results. 13
Future work could include investigations of whether there are other personal 14
characteristics that might explain affective response to exercise in the zone of response 15
variability. This could lead to greater understanding of how individual difference factors 16
influence affective responses to exercise, which may in turn hold meaningful implications for 17
exercise prescription and adherence. The characteristics presented here represent an initial 18
exploration, but there are likely other salient characteristics such as BIS/BAS (Schnneider & 19
Graham, 2009), and perceived evaluative threat (Focht & Hausenblas, 2004) that will likely 20
provide additional understanding of individual affective responses during heavy exercise. 21
A seemingly promising avenue for future research is therole of hereditary influences 22
on individual differences in exercise-related affect. Initial evidence of the genetic contribution 23
to the affective response to exercise has been offered by Schutte, Nederend, Hudziak, Bartels, 24
differences in FS responses during a cycle ergometer test. Moreover, significant correlations 1
were observed between affective responses during exercise and regular voluntary exercise 2
behaviour (r = .15-.21). 3
Conclusions 4
This study offers an initial exploration of personal characteristics underlying affective 5
responses to heavy exercise (i.e., in the zone of response variability within the dual-mode 6
model; Ekkekakis, 2003). Findings suggest that individuals in the current study could be 7
correctly classified as either Negative Responders or Neutral/Positive Responders 71% of the 8
time by measuring preference of exercise intensity and accounting for sex. Preference for 9
exercise intensity was the strongest predictor among these measures. Individuals who 10
experience no change or a positive change in pleasure (Neutral/Positive Responders) reported 11
higher preferred exercise intensity and were more likely to be female than individuals who 12
experienced a decline in pleasure (Negative Responders) during heavy exercise. Researchers 13
and practitioners might seek to account for the role of individual differences when examining 14
affective responses and when designing exercise programs for clients. While the reasons for 15
non-adherence to exercise are multifarious and complex, negative affective responses to 16
heavy exercise might play a role. Through more accurate predictions of how an individual 17
will feel during exercise, we can seek to make the exercise experience more consistently 18
pleasurable. 19
Acknowledgements 20
The authors would like to acknowledge the contribution of _____, _____, _____, and ______ 21
for their assistance with data collection at ______________. We would also like to 22
acknowledge the reviewers for their insight and assistance with the manuscript. 23
References 24
prescription (10th Ed.). Lippincott Williams & Wilkins; 2018. 1
Arnett, J. (1994). Sensation seeking: A new conceptualization and a new scale. Personality 2
and Individual Differences, 16, 289-96. 3
Barton, M., Yeatts, P. E., Henson, R. K., & Martin, S. B. (2016). Moving beyond univariate 4
post-hoc testing in exercise science: A primer on descriptive discriminant analysis. 5
Research Quarterly for Exercise and Sport, 87(4), 365-375. 6
Beaver, W. L., Wasserman, K., & Whipp, B. J. (1986). A new method for detecting anaerobic 7
threshold by gas exchange. Journal of Applied Physiology, 60, 2020-2027. 8
Costa, P. T., & McCrae, R. R. (1980). Influence of extraversion and neuroticism on subjective 9
well-being: Happy and unhappy people. Journal of Personality and Social Psychology, 10
38, 668-678. 11
Costa, P. T., & McCrae, R. R. (1992). Normal personality assessment in clinical practice: The 12
NEO Personality Inventory. Psychological Assessment, 4, 5-13. 13
DeNeve, K. M., & Cooper, H. (1998). The happy personality: A meta-analysis of 137 14
personality traits and subjective well-being. Psychological Bulletin, 124, 197-229. 15
De Raad, B. (2000). The big five personality factors: The psycholexical approach to 16
personality. Ashland, OH, US: Hogrefe & Huber Publishers. 17
Dishman, R. K., & Holmes, P. V. (2012). Exercise and opioids: Animal models. In H. 18
Boecker, C. H Hillman, L. Scheef, & H. Struder (Eds.), Functional neuroimaging in 19
exercise and sports sciences (pp 45-58). New York: Springer. 20
Ekkekakis, P. (2003) Pleasure and displeasure from the body: Perspectives from exercise. 21
Cognition and Emotion, 17, 213–39. 22
Ekkekakis, P. (2013). Pleasure from the exercising body: Two centuries of changing outlooks 23
in psychological thought. In P. Ekkekakis (Ed.), Routledge handbook of physical 24
Ekkekakis, P. (2017) People have feelings! Exercise psychology in paradigmatic 1
transition. Current Opinion in Psychology, 16, 84–88. 2
Ekkekakis, P., & Dafermos, M. (2012). Exercise is a many-splendored thing but for some it 3
does not feel so splendid. In: E.O. Acevedo (Ed.), The Oxford handbook of exercise 4
psychology (pp. 295–333). New York: Oxford University Press. 5
Ekkekakis P., Hall, E. E., & Petruzzello, S. J. (2005). Some like it vigorous: Measuring 6
individual differences in the preference for and tolerance of exercise intensity. Journal 7
of Sport & Exercise Psychology, 27, 350-74. 8
Ekkekakis, P., Hargreaves, E. A., & Parfitt, G. (2013). Invited Guest Editorial: Envisioning 9
the next fifty years of research on the exercise–affect relationship. Psychology of Sport 10
and Exercise, 14, 751-8. 11
Ekkekakis, P., Lind, E., Hall, E. E., & Petruzzello, S. J. (2008). Do regression-based computer 12
algorithms for determining the ventilatory threshold agree? Journal of Sports Science, 13
26, 967–76. 14
Ekkekakis, P., Lind, E., & Vazou, S. (2010). Affective responses to increasing levels of 15
exercise intensity in normal-weight, overweight, and obese middle-aged women. 16
Obesity, 18, 79-85 17
Ekkekakis, P., Parfitt, G., & Petruzzello, S. J. (2011). The pleasure and displeasure people 18
feel when they exercise at different intensities: Decennial update and progress towards a 19
tripartite rationale for exercise intensity prescription. Sports Medicine, 41, 641-671. 20
Eysenck, H. J., Nias, D. K. B., Cox, D. N. (1982). Sport and Personality. Advances in 21
Behaviour Research and Therapy, 4, 1-56. 22
Faul, F., Erdfelder, E., Buchner, A., & Lang, A. G. (2009). Statistical power analyses using 23
G*Power 3.1: Tests for correlation and regression analyses. Behavior Research 24
Focht, B. C & Hausenblaus, H. A. (2004) Perceived Evaluative Threat and State Anxiety 1
During Exercise in Women with Social Physique Anxiety. Journal of Applied Sport 2
Psychology, 16, 361-368. 3
Gaskill, S. E., Ruby, B. C., Walker, A. J., Sanchez, O. A., Serfass, R. C., & Leon, A. S. 4
(2001). Validity and reliability of combining three methods to determine ventilatory 5
threshold. Medicine & Science in Sports & Exercise, 33, 1841–1848. 6
Gillen, J. B., & Gibala, M. J. (2014). Is high-intensity interval training a time-efficient 7
exercise strategy to improve health and fitness?. Applied Physiology, Nutrition, and 8
Metabolism, 39(3), 409-412. 9
Goldberg, L. R., Johnson, J. A., Eber, H. W., Hogan, R., Ashton, M. C., Cloninger, C. R., & 10
Gough, H. G. (2006). The international personality item pool and the future of public-11
domain personality measures. Journal of Research in Personality, 40, 84-96. 12
Gray, J. A. (1991). Neural systems, emotion and personality. In J. Madden IV (Ed.) 13
Neurobiology of learning, emotion and affect. (pp. 273-306). New York: Raven Press. 14
Gross, J. J., & John, O. P. (2003). Individual differences in two emotion regulation processes: 15
implications for affect, relationships, and well-being. Journal of personality and social 16
psychology, 85, 348-362. 17
Hagberg, L. A., Lindahl, B., Nyberg, L., & Hellénius, M. L. (2009). Importance of enjoyment 18
when promoting physical exercise. Scandinavian Journal of Medicine & Science in 19
Sports, 19, 740–7. 20
Hall, E. E., Petruzzello, S. J., Ekkekakis, P., Miller, P. C., & Bixby, W. R. (2014). Role of 21
self-reported individual differences in preference for and tolerance of exercise intensity 22
in fitness testing performance. Journal of Strength and Conditioning Research, 28, 23
2443-2451. 24
Hamlyn-Williams, C. C., Tempest, G., Coombs, S., & Parfitt, G. (2015). Can previously
sedentary females use the feeling scale to regulate exercise intensity in a gym
1
environment? An observational study. BMC Sports Science, Medicine and 2
Rehabilitation, 7, 30.
3
Hardy, C. J., & Rejeski, W. J. (1989). Not what but how one feels: The measurement of affect 4
during exercise. Journal of Sport & Exercise Psychology, 11, 304–317. 5
Hutchinson, J. C., Jones, L., Vitti, S. N., Moore, A., Dalton, P. C., & O'Neil, B. J. (2018). The 6
influence of self-selected music on affect-regulated exercise intensity and remembered 7
pleasure during treadmill running. Sport, Exercise, and Performance Psychology, 7(1), 8
80-92. 9
Ingledew, D. K., & Markland, D. (2008) The role of motives in exercise participation. 10
Psychology & Health, 23, 807-28. 11
Jack, S. J., & Ronan, K. R. (1998) Sensation seeking among high-and low-risk sports 12
participants. Personality and Individual Differences, 25, 1063-83. 13
Jones, L., Karageorghis, C. I., Lane, A. M., & Bishop, D. T. (2017). The influence of 14
motivation and attentional style on affective, cognitive, and behavioural outcomes of an 15
exercise class. Scandinavian Journal of Medicine and Science in Sports, 27, 124-135. 16
Koob, G. F., & Le Moal, M. (1997). Drug Abuse: Hedonic homeostatic dysregulation. 17
Science, 278, 52-58. 18
Kwan, B. M., & Bryan, A. D. (2010). Affective response to exercise as a component of 19
exercise motivation: Attitudes, norms, self-efficacy, and temporal stability of intentions. 20
Psychology of Sport & Exercise, 11, 71-79. 21
Larsen, R. J, & Ketelaar, T. (1989). Extraversion, neuroticism and susceptibility to positive 22
and negative mood induction procedures. Personality and Individual Differences, 10, 23
1221-1228. 24
acute exercise: the role of personality and goal cognitions. Individual Differences 1
Research, 3, 153-161. 2
Mees, U., & Schmitt, A. (2008). Goals of action and emotional reasons for action; A modern 3
version of the theor y of ultimate psychological hedonism. Journal for the Theory of 4
Social Behaviour, 38, 157–78. 5
Minkwitz, J., Chittka, T., Schuster, S., Kirkby, K. C., Sander, C., Hegerl, U., & Himmerich H. 6
(2016). Sensation Seeking and Physical Activity. Health Behavior and Policy Review, 7
3, 528-534. 8
O’Connor, D. B., Conner, M., Jones, F., McMillan, B., & Ferguson, E. (2009). Exploring the 9
benefits of conscientiousness: An investigation of the role of daily stressors and health 10
behaviors. Annals of Behavioral Medicine, 37, 184-196. 11
Oliveira, B. R., Slama, F. A., Deslandes, A. C., Furtado, E. S., & Santos, T. M. (2013). 12
Continuous and high-intensity interval training: which promotes higher 13
pleasure?. PLOS one, 8(11), e79965. 14
Parfitt, G., Alrumh, A., & Rowlands, A. V. (2012). Affect-regulated exercise intensity: Does 15
training at an intensity that feels ‘good’ improve physical health?. Journal of Science 16
and Medicine in Sport, 15, 548-553. 17
Parfitt, G., Rose, E. A., & Burgess, W. M. (2006). The psychological and physiological 18
responses of sedentary individuals to prescribed and preferred intensity exercise. Health 19
Psychology, 11, 39–53. 20
Rhodes, R. E., Courneya, K. S., & Jones, L. W. (2002). Personality, the theory of planned 21
behavior, and exercise: A unique role for extroversion's activity facet. Journal of 22
Applied Social Psychology, 32, 1721- 1736. 23
Rhodes, R. E., Fiala, B., & Conner, M. (2009). A review and meta-analysis of affective 24
38, 180–204. 1
Rhodes, R. E., & Pfaeffli, L. A. (2012). Personality and physical activity. In E.O. 2
Acevedo(Ed.), The Oxford Handbook of Exercise Psychology (pp. 195–223). Oxford, 3
UK: Oxford University Press. 4
Rhodes, R. E., & Smith, N. E. I. (2006) Personality correlates of physical activity: a review 5
and meta-analysis. British Journal of Sports Medicine, 40, 958-65. 6
Rose, E. A., & Parfitt, G. (2007) A quantitative analysis and qualitative explanation of the 7
individual differences in affective responses to prescribed and self-selected exercise 8
intensities. Journal of Sport & Exercise Psychology, 29, 281-309. 9
Rose, E. A., & Parfitt, G. (2010). Pleasant for some and unpleasant for others: a protocol 10
analysis of the cognitive factors that influence affective responses to 11
exercise. International Journal of Behavioral Nutrition and Physical Activity, 7, 15. 12
Saanijoki, T., Nummenmaa, L., Eskelinen, J. J., Savolainen, A. M., Vahlberg, T., Kalliokoski, 13
K. K., & Hannukainen, J. C. (2015). Affective responses to repeated sessions of high-14
intensity interval training. Medicine and Science in Sports and Exercise, 47(12), 2604-15
2611. 16
Schneider, M., & Graham, D. (2009) Personality, physical fitness, and affective response to 17
exercise among adolescents. Medicine & Science in Sports & Exercise, 41, 947–55. 18
Schneider, M., & Schmalbach, P. (2015). Affective response to exercise and preferred 19
exercise intensity among adolescents. Journal of Physical Activity and Health, 12, 546-20
552. 21
Schutte, N. M., Nederend, I., Hudziak, J. J., Bartels, M., & de Geus EJ. (2017). Heritability of 22
the affective response to exercise and its correlation to exercise behaviour. Psychology 23
of Sport and Exercise, 31, 139–48. 24
selected exercise intensities in young adolescent boys and girls. Pediatric Exercise 1
Science, 20, 129-141. 2
Smith, A. E., Eston, R., Tempest, G. D., Norton, B., & Parfitt, G. (2015). Patterning of 3
physiological and affective responses in older active adults during a maximal graded 4
exercise test and self-selected exercise. European Journal of Applied Physiology, 115, 5
1855-1866. 6
Smieja, M., & Kobylinska, D. (2011). Emotional intelligence and emotion regulation 7
strategies. Studia Psychologiczne, 49(5), 55-64. 8
Tempest, G., & Parfitt, G. (2016). Self-reported tolerance influences prefrontal cortex 9
hemodynamics and affective responses. Cognitive, Affective, & Behavioral 10
Neuroscience, 16, 63–71. 11
Terracciano, A., Schrack, J. A., Sutin, A. R., Chan, W., Simonsick, E. M., & Ferrucci L. 12
(2013). Personality, metabolic rate and aerobic capacity. PloS one, 8, e54746. 13
Warner, R. M. (2013). Applied statistics: From bivariate through multivariate techniques 14
(2nd ed.). Los Angeles, CA: Sage. 15
Watson, D., & Clark, L. A. (1992). On traits and temperament: General and specific factors of 16
emotional experience and their relation to the five-factor model. Journal of Personality, 17
60, 441-476. 18
Watson, D., David, J. P., & Suls, J. (1999). Personality, affectivity, & coping. In: C. R. 19
Snyder (Ed.), Coping: The psychology of what works (pp. 119-140). New York: Oxford 20
University Press. 21
Welborn, B. L., Papademetris, X., Reis, D. L., Rajeevan, N., Bloise, S. M., & Gray, J. R. 22
(2009). Variation in orbitofrontal cortex volume: relation to sex, emotion regulation and 23
affect. Social cognitive and affective neuroscience, 4, 328-339. 24
inactive women to a maximal incremental exercise test: A test of the dual-mode model. 1
Psychology of Sport and Exercise, 8, 401-23. 2
Whittle, S., Yücel, M., Yap, M. B., & Allen, N. B. (2011). Sex differences in the neural 3
correlates of emotion: evidence from neuroimaging. Biological psychology, 87, 319-4
333. 5
Will, P. M., & Walter, J. D. (1999). Exercise testing: improving performance with a ramped 6
Bruce protocol. American Heart Journal, 138, 1033-37. 7
Williams, D. M., Dunsiger, S., Jennings, E. G., Marcus, B. H. (2012). Does affective valence 8
during and immediately following a ten-minute walk predict concurrent and future 9
physical activity? Annals of Behavioral Medicine, 44, 43–51. 10
Wilson, K. E., & Dishman, R. K. (2015). Personality and physical activity: A systematic 11
review and meta-analysis. Personality and Individual Differences, 72, 230-242. 12
Zuckerman, M., Eysenck, S. B., & Eysenck, H. J. (1978). Sensation seeking in England and 13
America: Cross-cultural, age, and sex comparisons. Journal of Consulting and Clinical 14
Psychology, 46, 139-149. 15
Zuckerman, M. (1983). Sensation seeking and sports. Personality and Individual Differences, 16
4, 285-92. 17
Zuckerman, M. (1979). Sensation seeking. New Jersey, USA: John Wiley & Sons, Inc. 18
Zuckerman, M. (1994). Behavioral expressions and biosocial bases of sensation 19
seeking. New York: Cambridge University Press. 20
Table 1 1
Descriptive Statistics for Demographic Variables 2
Total (N = 48)
Male (n = 27)
Female (n = 21)
Independent Groups t-test (df = 46)
M SD M SD M SD t p
Agea 30.3 7.5 29.4 8.1 31.5 6.8 -0.97 .34
BMIb 25.3 4.4 25.8 2.9 24.8 5.8 0.72 .47
VO2peakc 45.7 9.4 49.9 7.2 40.2 9.1 4.15 .00
England (N = 21)
USA
(N = 27) t p
Agea 31.0 3.9 29.8 9.5 0.63d .53
BMIb 25.0 2.9 25.7 5.4 -0.56 .50
VO2peakc 46.4 7.6 45.1 10.6 0.49 .63
Table 2 1
Descriptive Statistics for Predictor Variables 2
Variables All
(N = 48)
Negative Responders
(n = 28)
Positive/Neutral Responders
(n = 20)
M SD M SD M SD
Tolerance 27.7 4.6 28.1 5.1 27.2 3.9
Preference* 28.1 5.5 26.2 5.1 30.8 3.1
Extraversion 33.2 8.1 33.3 7.8 33.9 8.1 Agreeableness 40.4 6.3 39.5 7.2 41.7 4.7 Conscientiousness 38.3 6.1 39.1 5.7 37.0 6.6
Neuroticism 33.5 7.1 33.3 7.5 33.7 6.7
Openness 37.1 5.3 36.4 5.4 38.1 5.2
Sensation Seeking 19.9 6.6 20.5 6.2 19.0 7.2
Age 30.3 7.5 31.1 8.4 29.3 6.2
Malea* 27.0 56.3 20.0 71.4 7.0 35.0
Femalea* 21.0 75.0 8.0 28.6 13.0 65.0
BMI 25.3 4.4 25.5 3.8 25.2 5.3
VO2peak 45.7 9.4 46.0 9.1 45.2 9.9
Note. a Sex is reported in n/%; *Significantly different (all ps < .05) between groups. 3
Table 3 1
Intercorrelations of the Personal Predictor Variables (N = 48) 2
1 2 3 4 5 6 7 8
1. Tolerance -- .363* .045 .005 .228 .213 .042 .164
2. Preference -- .047 .250 .043 .298* .019 .071
3. Extraversion -- .402** -.165 -.003 .299* .206
4. Agreeableness -- .087 .081 .250 -.150
5. Conscien-tiousness
-- .157 .008 -.350*
6. Neuroticism -- .003 -.114
7. Openness -- .117
8. Sensation Seeking
--
Note. *p < .05, p < .01 3
Table 4 1
Summary of Structure Coefficients and Standardized Coefficients from the Predictive 2
Discriminant Function Analyses 3
Structure Coefficient Standardized Coefficient Model 1
Tolerance -.642 0.402
Preference .257 -1.023*
Extraversion -.246 0.035
Agreeableness -.228 0.027
Conscientiousness .175 0.477
Neuroticism .143 0.163
Openness -.402 -0.402
Sensation Seeking .496 0.496
Model 2
Preference .747 0.611*
Sex .657 0.816*
Age -.199 -0.216
VO2Peak -.077 0.360
BMI -.052 0.145
Model 3
Preference .806* 0.714*
Sex .709* 0.599*
Note. *Above the cut-off value (.5) identified by Warner (2013) 4
Table 5 1
Predicted Classification of Positive and Negative Responders 2
Predicted Group Membership Negative
Responders
Neutral/Positive Responders Model 1a
Original
Negative
Responders 64.3 (18) 35.7 (10) Neutral/Positive
Responder 20.0 (4) 80.0 (16)
Model 2b
Original
Negative
Responders 67.9 (19) 32.1 (9) Neutral/Positive
Responder 30.0 (6) 70.0 (14)
Model 3c
Original
Negative
Responders 67.9 (19) 32.1 (9) Neutral/Positive
Responder 25.0 (5) 75.0 (15)
Note. Reported in % (n); a70.8% of participants were correctly classified; b68.8% of cases 3
were correctly classified; c70.8% of participants were correctly classified. 4