WINGE, David O., FRANCKIÉ, Martin, VERDOZZI, Claudio, WACKER,
Andreas and PEREIRA, Mauro <http://orcid.org/0000-0002-2276-2095>
Available from Sheffield Hallam University Research Archive (SHURA) at:
http://shura.shu.ac.uk/12549/
This document is the author deposited version. You are advised to consult the
publisher's version if you wish to cite from it.
Published version
WINGE, David O., FRANCKIÉ, Martin, VERDOZZI, Claudio, WACKER, Andreas and
PEREIRA, Mauro (2016). Simple electron-electron scattering in non-equilibrium
Green's function simulations. Journal of Physics: Conference Series, 696.
Copyright and re-use policy
See
http://shura.shu.ac.uk/information.html
This content has been downloaded from IOPscience. Please scroll down to see the full text.
Download details:
IP Address: 143.52.96.10
This content was downloaded on 14/04/2016 at 13:09
Please note that terms and conditions apply.
Simple electron-electron scattering in non-equilibrium Green's function simulations
View the table of contents for this issue, or go to the journal homepage for more 2016 J. Phys.: Conf. Ser. 696 012013
Simple electron-electron scattering in
non-equilibrium Green’s function simulations
David O. Winge1, Martin Francki´e1, Claudio Verdozzi1, Andreas
Wacker1 and Mauro F. Pereira2
1
Division of Mathematical Physics, Department of Physics, Lund University, Box 118, SE-221 00 Lund, Sweden
2
Materials and Engineering Research Institute, Sheffield Hallam University, City Campus, Howard Street, Sheffield S1 1WB, UK
E-mail: [email protected]
Abstract. In this work we include electron-electron interaction beyond Hartree-Fock level in our non-equilibrium Green’s function approach by a crude form of GW through the Single Plasmon Pole Approximation. This is achieved by treating all conduction band electrons as a single effective band screening the Coulomb potential. We describe the corresponding self-energies in this scheme for a multi-subband system. In order to apply the formalism to heterostructures we discuss the screening and plasmon dispersion in both 2D and 3D systems. Results are shown for a four well quantum cascade laser with different doping concentration where comparisons to experimental findings can be made.
1. Introduction
Since the quantum cascade laser (QCL) was introduced more than 20 years ago [1] it has continuously been improved and redesigned to operate from the mid-infrared all the way down to the Terahertz (THz) range. Compact laser sources at these wavelengths are valuable for spectroscopic applications [2] but a major problem is that THz QCLs do not operate at room temperature. This can be overcome via difference frequency generation which recently has been demonstrated at powers in the milli-watt range [3]. Direct THz-QCLs still generate a lot of interest in the research community due to the promise of higher wall-plug efficiency and the prospects of miniaturization of cryo-coolers.
The main temperature degrading mechanism of the THz QCLs is currently not fully understood and is still debated by the community [4]. This is a challenge to theory and there is a great need of realistic modeling tools that are able to treat all important quantum effects on the same footing. A summary of different methods for simulating these structures is found in [5]. Monte Carlo simulations have shown that electron-electron interaction, beyond the meanfield or Hartree approximation can influence the dynamics of THz QCLs [6, 7, 8].
In this work we include and study the effects of a simple electron-electron scattering via the Single Plasmon Pole Approximation (SPPA) [9, 10]. In this approximation we capture both the static limit as well as dynamic effects. This gives an energy dependent (non-local in time) interaction beyond the Hartree-Fock approximation. This has been studied in a similar model with promising results [11], and with this work we want to adapt the idea into our model described in Ref. [12]. In other methods based on Non-Equilibrium Green’s Functions (NEGF)
Content from this work may be used under the terms of theCreative Commons Attribution 3.0 licence. Any further distribution of this work must maintain attribution to the author(s) and the title of the work, journal citation and DOI.
and applied to QCLs, electron-electron scattering has previously been implemented in a low order GW0 approximation employing a purely static screening model [13].
To simulate the periodic structure of the QCL, we use a product space of plane waves and confined states. The Green’s function evaluation provides us with the energy resolution of the states, labeled by state and kindex, at the cost of inverting the self-energy matrices at each k
and energy grid point. A number of elastic scattering processes as well as longitudinal optical phonon scattering is treated in this formalism at a high computational cost. Adding a many-body term fully dependent on the polarization would increase the complexity by one order, a formidable task in this model, leading us to consider simpler schemes as done in this work.
This paper is organized as follows: first the theory of the SPPA is discussed and we show how it is implemented in the context of our formalism. Then the dispersion of the plasmons is discussed as well as the exchange shift. In the last part a test structure is used to evaluate the effect of the inclusion of the new scattering mechanism. Finally, we present the conclusions of our study.
2. Theory
In THz quantum cascade simulations, the relevant sources of scattering, beside electrons, are interface roughness, impurities from donor atoms, acoustic and optical phonons as well as alloy composition. All these effects have already been implemented and details can be found in Ref. [12].
The model discussed here employs a non-equilibrium Green’s function formalism where the system observables are extracted from the retarded and lesser parts of the Green’s function in the formalism of [14, 15]. These are solved using self-energies for the part of the Hamiltonian that is non-diagonal in kand solved through the Dyson equation and the Keldysh relation.
In this section we will describe how we formulate the self-energy expressions for the screened interaction in the single plasmon pole approximation (SPPA). First we will discuss how the conduction band is treated as an effective band in order to apply the named approximation. Then we will describe how we formulate and also evaluate the Coulomb matrix elements. After this we acquire the lesser and retarded part of the screened interaction before moving on to the actual construction of the self-energies. This is done in close correspondence to the treatment of phonons in Ref. [16] in order to keep the length of this section reasonable. To this treatment we will here add the necessary exchange part. Before we move on to the next section where we test the model, we will also describe how the plasmon dispersion is treated.
2.1. Screening from one effective band
In frequency space the retarded screened potential is given by its own Dyson equation, given here as a matrix equation:
W(q, E) =V(q) +V(q)P(q, E)W(q, E) (1)
⇐⇒W(q, E) = [1−V(q)P(q, E)]−1
| {z }
(q,E)−1
V(q). (2)
where the V(q) is the bare interaction as a function of the momentum wave vector, described in more detail below, andP(q, E) is the polarization as a function of momentum and energyE. If we now assume an isotropic screening medium and that the dielectric function (q, E) is not level dependent, we can write the approximated retarded screened potential as
Wijklret(q, E) =Vijkl(q)
whereVijkl(q) now holds the matrix structure. We consider the dielectric function(q, E) given by the Lindhard formula [17] which is retarded due to poles in the lower half of the complex plane. While we assume an effective band for the screening, all other physical mechanisms are treated with full state dependence.
In this work we will assume a plasmon distribution in equilibrium with respect to the electron temperature. This approximation will ensure that energy is not dissipated from the distribution of non-equilibrium electrons. In addition, this assumption will allow us to link the lesser part of the screened interaction to the retarded through the fluctuation dissipation theorem [15] as
W<(q, E) = if(E)A(q, E) = if(E)−2={Wret}
(4)
wheref(E) is the (bosonic) plasmonic distribution function andA(q, E) is the spectral function, which can be written in terms of the retarded Green’s function leading to the rightmost expression. The electron temperature will be represented as the expectation value hEki for the effective conduction band. This is with respect to the discrete energy for each stateαas the single particle energies areEα+Ek. We calculatehEkiself-consistently in the model. The lesser and retarded part are all that is needed to formulate the self-energy which will be described in detail below.
2.2. Coulomb matrix elements
The Coulomb matrix elements are given on the quasi-2D form following [17]
Vijkl(q) =
e2
2A0r
Fijkl(q)
q (5)
with r being the dielectric constant and A is the system area while the other constants have their usual meaning. The relative constant r is the equilibrium value for the main material system with no dopant atoms present. To this we will add the non-equilibrium contribution as shown in Eq. (3), making up the total dielectric constant. Theform factors are expressed as
Fijkl(q) =
Z
dz
Z
dz0ϕ∗i(z)ϕj(z)e−q|z−z
0|
ϕ∗k(z0)ϕl(z0). (6)
where the integral is taken along the growth direction, which defines the quantization direction of the quasi-2D system and ϕi(z) are the quantized states in the z-direction used as a basis for the simulation. The numerical integration is greatly simplified by expressing the wave functions as a truncated Fourier series [18]. All form factors are then easily calculated and are thus available at a reasonable computational cost for all q. These form factors will also be close to exact as the number of Fourier components needed for the well behaved wave functions of the heterostructures is limited.
2.3. Lesser and retarded expressions for the screened interaction
We define the SPPA following [17] as
1
(q, E) ≈1 +
Epl2(q) (E+iδ)2−E2
ef f
(7)
where the effective plasmon pole is chosen to ensure that the approximation is correct both in the long wavelength and the static limit, as thoroughly discussed in [17], and given in the two cases of screening dimensions as
2D: Eef f2 (q) =Epl2(q)(1 + q
κ) +ν
2
q (8)
and
3D: Eef f2 (q) =Epl2(1 + q
2
κ2) +ν 2
q (9)
where the plasma frequency is defined as
2D: Epl(q) =
s
~2e2n2D 2r0m
q
3D: Epl =
s
~2e2n3D
r0m
wheren2D andn3D are, respectively, the effective 2D and 3D carrier densities. mis the effective mass of the electron, νq2 is a term proportional to q4 which should take into account the pair continuum [17] and κis the inverse of the static screening length given in the two cases as
2D: κ= me
2
2π0r~2fk=0
3D: κ=
s
e2n3D
0rkBT
.
In 3D we use the Debye limit of screening and for the 2D case the screening becomes a function of the occupation probability fk atk= 0 for the effective conduction band.
Using the SPPA and the Dirac identity we find for the retarded part of the screened interaction
Wret(q, E) =V(q)−iV(q)π 2
E2
pl
~Eq
[δ(E−Eq)−δ(E+Eq)]. (10)
This can be linked to the lesser propagator using the fluctuation-dissipation theorem as discussed above and it is found to be
W<(q, E) = if(E)−2={Wret}
=−iπV(q)E
2
pl
~Eq
[f(Eq)δ(E−Eq) + (f(Eq) + 1)δ(E+Eq)]. (11)
These are the standard non-interacting bosonic propagators, which are the same that we have used previously for the optical phonons in our model. Following the same treatment applied to phonons one can formulate expressions for the retarded and lesser self-energies. However the static term in the retarded interaction has to be taken into account. This is the exchange shift and it is crucial to preserve the limits of the SPPA, static and long wavelength cases.
According to standard Feynmann rules we express the diagram for the screened interaction self-energy in the GW approximation [19] as
Σαα0(k, t, t0) = i~ X
ββ0 X
k0
Gββ0(k0, t, t0)Wαββ0α0(k−k0, t, t0), (12)
where the times are now on the Keldysh contour. Using the Langreth rules [20] we can transform them to the real time axis. Schematically we have for products structured as above the following rules:
Σ<=G<W< (13)
where the time arguments are implicit and are ordered as in the product in Eq. (12). At this point we make a rather drastic approximation and express the screened interaction in the SPPA. The static term in the retarded screened interaction is present in the first and third term. In the first it gives rise to the exchange described below, however in the third, it does not contribute as the retarded Green’s function, considered as a function of energy, only has poles in the lower imaginary half plane. Closing the contour in the upper plane prevents contributions from this term.
We can now proceed and formulate the self-energies for the screened interaction, and the treatment is analogous to that presented in Ref. [16] for optical phonons, with the addition of the exchange term treated below. Here we make the crucial assumption that the self-energies are functions of energy only, in contrast with the more computationally intensive approach of Ref. [11] that uses full energy andk-dependent terms. Here the fullk-dependence is replaced by an average contribution, by evaluating the scattering matrix elements for a set of typical values forEk and Ek0, as explained in detail in [12]. This brings the scattering matrix elements out of
the integral over Ek0 and we write the lesser and retarded self-energy as
Σ<αα0(E) = X
ββ0 Z dθ
2πX
sppa−
αα0ββ0(θ)fBose(Eef f(θ))
Z ∞
0
dEk0G<
ββ0(k0, E−Eef f(θ))
+X
ββ0 Z dθ
2πX
sppa+
αα0ββ0(θ)(fBose(Eef f(θ)) + 1)
Z ∞
0
dEk0G<
ββ0(k0, E+Eef f(θ)) (15)
and
Σretαα0(E) = X
ββ0 Z dθ
2πX
sppa−
αα0ββ0(θ)(fBose(Eef f(θ)) + 1)
Z ∞
0
dEk0Gretββ0(k0, E−Eef f(θ))
+X
ββ0 Z
dθ
2πX
sppa+
αα0ββ0(θ)fBose(Eef f(θ))
Z ∞
0
dEk0Gretββ0(k0, E+Eef f(θ))
+1 2 X ββ0 Z dθ
2πX
sppa−
αα0ββ0(θ) Z ∞
0
dEk0G<
ββ0(k0, E−Eef f(θ))
−1 2
X
ββ0 Z dθ
2πX
sppa+
αα0ββ0(θ) Z ∞
0
dEk0G<
ββ0(k0, E+Eef f(θ))
+ i
Z dE00
2π P
1 E00 h X ββ0 Z dθ
2πX
sppa−
αα0ββ0(θ) Z ∞
0
dEk0G<
ββ0(k0, E−Eef f(θ)−E00)
−X
ββ0
Xααsppa0ββ+0(θ) Z ∞
0
dEk0G<
ββ0(k0, E+Eef f(θ)−E00) i
(16)
where the last term contains an principal value integral. As this term involves yet another integral in energy space, it is of higher numerical complexity than the other terms and currently neglected to expedite the numerical calculations. The factorfBose(Eef f) = 1/(exp(Eef f/kBT)− 1) is again the Bose distribution where the electron temperature enters. In each term there is an average over all possible scattering angles. The scattering matrix elements are given as
Xααsppa0ββ0(θ) =
1 2π
me2
20r~2
Fαα0ββ0(θ)
q(θ)
Epl(q(θ)) 2Eef f(q(θ))
(17)
and the plus and minus variants used above comes from the choice of typical values for the evaluation. In our k-independent approximation we put
Xααsppa0,ββ±0 =Xααsppa0,ββ0(Etyp, Etyp+|∆E∓Eeff|) (18)
with ∆E takes the level difference properly into account for all combinations of indices. Etypis a representative value chosen to give a similar scattering rate compared to the case of thermalised subbands at the given lattice temperature.
2.4. Exchange shift
As the Hartree-Fock self-energies are local in time they depend only on the difference in coordinates, and the exchange term is normally evaluated directly from the diagrammatic rules to be
Σxαα0(k, t1, t2) =~ X
ββ0 X
q
Vαββ0α0(|q|)δ(t1, t2)iGββ0(k−q, t1, t2) (19)
which simplifies if only the difference in time matters and we find
Σxαα0(k, E) =− X
ββ0 X
q Z
dτeiE/~τV
αββ0α0(|q|)δ(τ) Z
dE0
2πie
−iE0/~τG<
ββ0(k−q, E0)
=−X
ββ0 X
q
Vαββ0α0(|q|) Z dE0
2πiG <
ββ0(k−q, E0)
=−X
ββ0 X
k0
Vαββ0α0(|k−k0|)ρββ0(k0)
≈ −X
ββ0
¯
Vαββ0α0(Ek, Ek0) X
k0
ρββ0(k0)
=−X
ββ0
¯
Vαββ0α0(Ek, Ek0)A
2ρββ¯ 0 (20)
where we moved the Coulomb matrix elements out of the sum over k in order to do the sum and reach the final 2D sheet densities ¯ρββ0. The factor of 1/2 appears as we do not sum over
spin for the exchange self-energy. The ¯V(Ek, Ek0) is now an angle averaged quantity over the
possible angles between k andk0, where we again use typical values forEk and Ek0.
3. Results
Our model, without electron-electron scattering has been previously tested successfully on superlattices and QCL heterostructures [12, 21, 22]. The case considered here is a QCL design from 2009 [23]. The periodic structure is displayed in Fig. 1 together with the probability density for the subbands relevant for transport. These type of four-well THz QCL structures have previously been troublesome to simulate, see for example [24], due to a pre-peak feature which is not recovered experimentally, at least not to the same extent as in the simulations. In theory, a lot more weight is put on the pre-peak at the cost of a lower main peak, compared to the opposite situation in experiments.
0 20 40 60 80 100 z [nm]
-50 0 50 100 150
Energy [meV]
(a)
0 20 40 60 80 100
z [nm]
[image:9.595.127.466.112.314.2]1 2 3 4 5 6 (b)
Figure 1. Band diagram of a four-well QCL from Ref. [23]. Here the conduction band edge is
shown as solid black lines spanning a periodic sequence of quantum wells typical for the QCL. The barrier material is Al0.15Ga0.85As while the wells are pure GaAs. In the widest well dopant
atoms are placed in order to n-dope the structure, giving rise to impurity scattering, whereas interface roughness scattering originates from imperfect material interfaces. Probability densities are shown for the most relevant states. This design employs resonant tunneling injection from 4 to 5, building up inversion between 5 and 2. The lower laser state 2 is efficiently depopulated via resonant tunneling out to 3 via 1, combined with phonon extraction to the starting point; state 4, shifted by one period. In (a) the alignment at design bias is shown, at a bias of 54 mV per period. In (b) the alignment at the parasitic resonance at 34 mV is shown, giving rise to the pre-peak in Fig. 2.
there is clearly an issue with vanishing carrier sheet density. In such a situation the physical picture of a continuous spectra of modes of collective oscillations is questionable as a valid representation of the actual physics.
The results of adding the new self-energy to the model is displayed for both sample A and B in Fig. 2. As a reference we show currents calculated without the SPPA self-energy for both 100 and 200 K lattice temperature. For high temperature the current increases almost linearly up to design bias, around 54 mV as depicted in Fig. 1(a), however for low temperature the current enters a region of Negative Differential Resistance (NDR) after∼38 mV for both samples. After entering this region it is no longer possible to converge the simulations; that is why the black line abruptly stops. The lack of convergence is attributed to artificially low lifetimes of the states due to the lack of important scattering mechanisms. In order to reach convergence in the self-consistent process, the energy resolution would have to be increased significantly. This is currently being investigated but the higher numerical complexity prevents us from showing any results here.
The pre-peak feature occurs at a low bias, before there is sufficient gain to start laser operation and it indicates that some important scattering is missing in the model as this is not the behavior seen in experiments. For sample A, a threshold current of 175 A/cm2 is observed for 10 K heatsink temperature and this gradually increases to 430 A/cm2 for the maximum operating temperature. The structure should thus be able to reach design bias also for low temperature. The NDR in both samples occurs close to the bias matching a potential drop of the energy of one optical phonon, which is about 36 meV for AlGaAs/GaAs systems. This strongly favors the
0 100 200 300 400 500
0 10 20 30 40 50 60
current density [A/cm
2 ]
bias per period [mV]
sample A
TL=100K, ref TL=200K, ref Te=<Ek> Te=TL
2D screening Te
TL
0 200 400 600 800 1000
0 10 20 30 40 50 60
current density [A/cm
2 ]
bias per period [mV]
sample B
ref TL=100K
ref TL=200K
Te=<Ek>
Te=TL
2D screening
[image:10.595.161.434.111.495.2]TL Te
Figure 2. Current simulations for sample A and B in the respective plots. Reference simulations are shown as black (dot-dashed) and red (long-dashed) lines for 100 K and 200 K lattice temperature, respectively. Simulations with the SPPA self-energy at 100 K, are shown as blue and magenta lines for 3D screening using Eq. (9) and orange (square-dotted) lines for 2D screening using Eq. (8). Simulations without the exchange shift is indicated by short-dashed lines.
parasitic current channel shown in Fig. 1(b).
Sample ρ2D JNDR(10 K) Jmax(∼150 K)
Exp. A(EV1157) 3.7×10
10 cm−2 225 A cm−2 430 A cm−2
B(N907) 1.1×1011 cm−2 810 A cm−2 920 A cm−2
Theory A 3.7×10
10 cm−2 465 A cm−2 460 A cm−2
[image:11.595.121.474.113.181.2]B 1.1×1011 cm−2 710 A cm−2 800 A cm−2
Table 1. Experimental results from Ref. [23] compared to simulations. Here we list, from
left to right, sample name, sheet density, current at the NDR feature where lasing stops at low temperature and lastly the maximum current at the temperature, observed in experiments, where the laser ceases to operate.
gas, which is respected by the 3D but not the 2D screening model. This, together with the observation that the 2D screening model gives an unrealistic current contribution, is the reason for focusing the rest of our discussion on the 3D screening model.
A few different cases are displayed in Fig. 2 for the simulations with the SPPA self-energy with 3D screening atTL= 100 K. Qualitatively we observe better agreement as the simulations are similar to the reference case at 200 K, which is expected. The quantative agreement is shown in Table 1. Here we use a lattice temperature 30 K higher than theheatsink temperature reported in the experiment. No laser field is included, only off-state simulations are shown. The agreement is reasonable except for the JNDR(10K) for sample A. For sample B the agreement
appears to be better but as we consider off-state current and on-state current probably is higher, this might be too large as well. The experimental decrease in current with lattice temperature is thus not seen in the simulations. The way we interpret this is that the possibility of exchanging plasmons with the environment opens up new transport channels for the electrons, and that this effect actually is larger than the hypothesized effect of increased dephasing which would decrease the tunneling currents, such as the parasitic resonance at the NDR peak. This effect plays a larger role at low temperature where phonon scattering is weak.
In Fig. 2 different limits of plasmon-phonon coupling are shown, indicated byTL and Te. In case of a strong coupling of the plasmon and phonon baths the plasmons would be quickly cooled by the phonons. This is shown as blue lines where the electron temperature has been set equal to the lattice temperature TL. The opposite would be a weak coupling, and here the plasmons are only coupled indirectly through the mean electron temperature calculated asTe=hEki/kB with respect to the bottom of each subband. This is shown as magenta lines in Fig. 2. Due to the occupation factors in Eqs. (15-16) a higher electron temperature increases the strength of the SPPA self-energy. The impact of switching the exchange self-energy off is shown by the dashed line of the respective color.
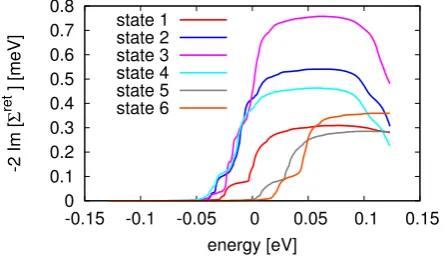
In Fig. 3 the imaginary part of the retarded self-energy is plotted as a function of energy. This is directly related to the linewidths of the single particle states. One finds that the effect of this self-energy on the linewidth is below one meV, for all the states.
4. Conclusions
The screened electron-electron interaction has been included in a crude GW approximation via the SPPA, including dynamical screening. This leads to increased scattering in our model and a behavior that better represents the data from experimental studies, showing that these scattering mechanisms are indeed an important source of inelastic scattering when the other mechanisms of this type, such as acoustic phonon scattering, are weak.
Exchange effects are shown to play a minor role only at higher doping concentrations, while the choice of coupling of the plasmon and phonon baths has a larger impact. We observe that a 3D screening model gives reasonable results due to the finite value of the plasmon energy in
0 0.1 0.2 0.3 0.4 0.5 0.6 0.7 0.8
-0.15 -0.1 -0.05 0 0.05 0.1 0.15
-2 Im [
Σ
ret
] [meV]
energy [eV] state 1
[image:12.595.185.409.121.249.2]state 2 state 3 state 4 state 5 state 6
Figure 3. Here the imaginary parts of the diagonal elements of the retarded SPPA self-energy
is shown for simulations at design bias. The state indexing follows the one in Fig. 1. Compared to other scattering mechanisms, the SPPA gives a small contribution to the linewidth: about 7% of the total at this bias. The lattice temperature is 100 K.
the low q limit, and we conclude that it also preserves the long wavelength limit. In contrast, the 2D screening model largely overestimates current and does not respect the long wavelength limit.
Acknowledgments
Financial support from the COST Action MP1204 in order to execute Short Term Scientific missions is thankfully acknowledged, as is support from the Swedish Research Council (VR).
References
[1] Faist J, Capasso F, Sivco D L, Sirtori C, Hutchinson A L and Cho A Y 1994Science 264553–556 [2] Williams B S 2007Nat. Photonics 1517
[3] Belkin M A and Capasso F 2015Phys. Scripta 90118002
[4] Khanal S, Zhao L, Reno J L and Kumar S 2014J. Opt.16094001 [5] Jirauschek C and Kubis T 2014Appl. Phys. Rev.1011307
[6] Callebaut H, Kumar S, Williams B S, Hu Q and Reno J L 2004Appl. Phys. Lett.84645 [7] Manenti M, Compagnone F, Di Carlo A and Lugli P 2003J. Comput. Electron.2433–437 [8] Jirauschek C and Lugli P 2008phys. stat. sol. (c)5221–224
[9] Lundqvist B 1967Phys. Kondens. Mater.6193–205
[10] Ando T, Fowler A B and Stern F 1982Rev. Mod. Phys.54437–672 [11] Schmielau T and Pereira M 2009Appl. Phys. Lett.95231111
[12] Wacker A, Lindskog M and Winge D 2013Sel. Top. in Quantum Electron., IEEE Journal of 191200611 [13] Kubis T, Yeh C, Vogl P, Benz A, Fasching G and Deutsch C 2009Phys. Rev. B 79195323
[14] Keldysh L V 1965Sov. Phys. JETP 201018 [Zh. Eksp. Theor. Fiz.47, 1515 (1964)] [15] Kadanoff L P and Baym G 1962Quantum Statistical Mechanics (New York: Benjamin) [16] Wacker A 2002Phys. Rep.3571
[17] Haug H and Koch S 2004 Quantum theory of the optical and electronic properties of semiconductors
(Singapore: World Scientific)
[18] Bonno O, Thobel J and Dessenne F 2005J. Appl. Phys.97043702 [19] Hedin L 1965Phys. Rev.139A796
[20] Langreth D C 1976Linear and Nonlinear Electron Transport in Solids ed Devreese J T and van Doren V E (New York: Plenum Press)
[21] Francki´e M, Winge D O, Wolf J, Liverini V, Dupont E, Trinit´e V, Faist J and Wacker A 2015Opt. Express 235201–5212
[22] Winge D O, Lindskog M and Wacker A 2014Opt. Express 2218389–18400
[23] Amanti M I, Scalari G, Terazzi R, Fischer M, Beck M, Faist J, Rudra A, Gallo P and Kapon E 2009
New J. Phys.11125022
![Figure 1. Band diagram of a four-well QCL from Ref. [23]. Here the conduction band edge isshown as solid black lines spanning a periodic sequence of quantum wells typical for the QCL.The barrier material is Al0.15Ga0.85As while the wells are pure GaAs](https://thumb-us.123doks.com/thumbv2/123dok_us/722757.576413/9.595.127.466.112.314/conduction-spanning-periodic-sequence-quantum-typical-barrier-material.webp)

![Table 1.Experimental results from Ref. [23] compared to simulations.Here we list, fromleft to right, sample name, sheet density, current at the NDR feature where lasing stops atlow temperature and lastly the maximum current at the temperature, observed in experiments,where the laser ceases to operate.](https://thumb-us.123doks.com/thumbv2/123dok_us/722757.576413/11.595.121.474.113.181/experimental-compared-simulations-fromleft-temperature-temperature-observed-experiments.webp)