Complex magnetic ordering in the oxide selenide
Sr2Fe3Se2O3
CASSIDY, Simon J., ORLANDI, Fabio, MANUEL, Pascal, HADERMANN,
Joke, SCRIMSHIRE, Alex, BINGHAM, Paul
<http://orcid.org/0000-0001-6017-0798> and CLARKE, Simon J.
Available from Sheffield Hallam University Research Archive (SHURA) at:
http://shura.shu.ac.uk/22028/
This document is the author deposited version. You are advised to consult the
publisher's version if you wish to cite from it.
Published version
CASSIDY, Simon J., ORLANDI, Fabio, MANUEL, Pascal, HADERMANN, Joke,
SCRIMSHIRE, Alex, BINGHAM, Paul and CLARKE, Simon J. (2018). Complex
magnetic ordering in the oxide selenide Sr2Fe3Se2O3. Inorganic Chemistry, 57 (16),
10312-10322.
Copyright and re-use policy
See
http://shura.shu.ac.uk/information.html
Sheffield Hallam University Research Archive
1
Complex magnetic ordering in the oxide
selenide Sr
2
Fe
3
Se
2
O
3
Simon J Cassidy,
1Fabio Orlandi,
2Pascal Manuel,
2Joke Hadermann,
3Alex
Scrimshire,
4Paul A Bingham
4and Simon J Clarke
1*1
Department of Chemistry, University of Oxford, Inorganic Chemistry Laboratory, South Parks Road, Oxford, OX1 3QR, UK. 2ISIS Facility, STFC Rutherford Appleton Laboratory, Harwell Oxford, Didcot
OX11 0QX, United Kingdom. 3Electron Microscopy for Materials Science (EMAT), University of Antwerp, Groenenborgerlaan 171, B-2020 Antwerp, Belgium., 4 Materials and Engineering Research
Institute, Faculty of Arts, Computing, Engineering and Sciences, Sheffield Hallam University, City Campus, Howard Street, Sheffield, S1 1WB,UK.
*Corresponding author
2
Abstract
Sr2Fe3Se2O3 is a localised-moment iron oxide selenide in which two unusual coordinations for Fe2+
ions form two sublattices in a 2:1 ratio. In the paramagnetic region at room temperature the compound adopts the crystal structure first reported for Sr2Co3S2O3, crystallising in space group
Pbam with a = 7.8121 Å, b = 10.2375 Å, c =3.9939 Å and Z = 2. The sublattice occupied by two thirds of the iron ions (Fe2 site) is formed by a network of distorted mer-[FeSe3O3] octahedra linked via
shared Se2 edges and O vertices forming layers, which connect to other layers by shared Se vertices.
As shown by magnetometry, neutron powder diffraction and Mössbauer spectroscopy measurements, these moments undergo long range magnetic ordering below TN1 = 118 K, initially
adopting a magnetic structure with a propagation vector (½–δ, 0, ½) (0 ≤ ≤ 0.1) which is incommensurate with the nuclear structure and described in the Pbam1’(a01/2)000s magnetic superspace group, until at 92 K (TINC) there is a first order lock-in transition to a structure in which
these Fe2 moments form a magnetic structure with a propagation vector (½ , 0, ½) which may be modelled using a 2a × b × 2c expansion of the nuclear cell in space group 36.178 Bab21m (BNS
notation). Below TN2 = 52 K the remaining third of the Fe2+ moments (Fe1 site) which are in a
compressed trans-[FeSe4O2] octahedral environment undergo long range ordering, as is evident
3
Introduction
Multi-anion compounds adopt a diverse range of structures and have received recent attention in several contexts. Oxide sulfides and oxide selenides enable band gap tuning for semiconductors and transparent conductors1,2,3 and are of interest as potential thermoelectric materials.4 Superconductors based on iron arsenides5 and selenides6 also often contain oxide, or hydroxide7 slabs separating the iron arsenide or selenide layers. In oxide chalcogenides ordering of the oxide and heavier chalcogenide (S2–, Se2– or Te2–) anions is the norm as a result of their differing sizes and chemistry.8 Layered crystal structures often result, in which cations of main group and transition metals are separated according to their oxo- and chalcophilicity. Often, transition metal cations in oxide chalcogenides have coordination environments that contain both anions, e.g. in structures such as that of La2Fe2Se2O39 which has layers composed of face-sharing trans-FeSe4O2 octahedra
separated by PbO-type LaO layers. Sometimes the resulting structures are less obviously layered, but maintain some low-dimensional feature of the magnetic exchange interactions which results in unusual phenomena such as in SrFe2Se2O, which contains FeSe2O2 tetrahedra that link to form what
has been described as a spin-ladder with multiple competing exchange interactions.10 Some multi-anion coordination environments are inherently polarised such as those in CaFeSeO11,12,13 and CaFeSO14 which contain all-vertex-linked FeSe2O2 and S-vertex-linked FeS3O tetrahedra respectively,
and which crystallise in different structures, both with non-centrosymmetric space groups (CaFeSeO also has a centrosymmetric polymorph).11 The oxide selenide Sr2Fe3Se2O3 has recently been reported
by Lai et al.,15along with the sulfide analogues for both Fe15 and Co,16 in work which has been carried out independently of our own.In Sr2Fe3Se2O3 and Sr2Fe3S2O315 a new coordination environment for
Fe2+ is described and there are a succession of magnetic phase transitions on cooling to a state in which all the Fe2+ ions are participating in magnetic long range order. Here we use neutron powder diffraction (NPD) and Mössbauer spectroscopy to probe the magnetic ordering as a function of temperature and correlate the behaviour with the detailed analysis of magnetometry and Mössbauer data made by Lai et al.15
Experimental
Synthesis.
Polycrystalline samples of Sr2Fe3Se2O3 were synthesised from stoichiometric amounts of SrO, FeSe,
Fe2O3 (Alfa Aesar 99.998 %) and Fe (Alfa Aesar 99.998 %). The SrO was prepared by thermal
decomposition of SrCO3 (Alfa Aesar 99.997 %) under dynamic vacuum for 16 hours at 800 °C
4
were ground together inside an argon-filled dry glovebox (Glovebox Technology Ltd, UK) using an agate pestle and mortar. The ground powder was pressed into a pellet, placed inside an alumina crucible, and sealed inside an evacuated silica ampoule. Various heating protocols were then investigated as described in the results section.
Diffraction Measurements.
Laboratory X-ray powder diffraction (XRPD) measurements to monitor phase purity and the course of the reactions were performed on a Panalytical Empyrean diffractometer using CuKradiation. High resolution XRPD measurements for structure solution and analysis were performed on beamline I1117 at the Diamond Light Source, Ltd, UK, and additional measurements were made on beamline ID22 at the European Synchrotron Radiation Facility (ESRF), France. NPD measurements were performed from 10 – 300 K on the WISH instrument18 at the ISIS Pulsed Neutron and Muon Facility, UK with the samples contained in indium-sealed thin-walled vanadium cylinders. Structure solution and Rietveld refinements were performed using the TOPAS Academic software.19 Electron diffraction measurements at EMAT, Antwerp, were acquired with a Philips CM20 transmission electron microscope operated at 200 kV with the sample prepared by grinding the crushed powder in ethanol and depositing a few drops of the suspension on holey carbon TEM grids.
Magnetometry.
All measurements used a Quantum Design MPMS-XL SQUID magnetometer. The susceptibility was determined by measuring the magnetisation as a function of temperature on warming from 2 to 300 K after cooling both in a zero applied field: zero-cooled (ZFC) and in the measuring field: field-cooled (FC) of 50 mT. Magnetisation isotherms (–5 ≤ 0H/T ≤ +5) at several temperatures were each
measured after cooling the sample from 200 K (i.e. well above the highest magnetic ordering transition) to the measurement temperature in a +5 T field and then measuring the magnetisation while sweeping the field in steps down to –5 T and back to +5T. Successive isotherms were collected from highest to lowest temperature. Between the measurement of successive isotherms, the field was changed to 0T and the sample warmed to 200 K, then the field was changed to +5 T prior to cooling. This was in an attempt to remove any influence of the previous measurement on the next. Samples were sequestered from air in gelatin capsules.
Mössbauer Spectroscopy.
57
5
57
Co(Rh) was kept at room temperature. A Mössbauer thickness of 120 was achieved by homogenously mixing 25 mg of Sr2Fe3Se2O3 with graphite to fully pack a cylindrical cavity (1.77 cm2
cross-section, 0.1 cm thick) in an acrylic disc, which was sealed air-tight. Spectra were analysed using the Recoil software package21 to deconvolve the data into separate iron environments. Extracted chemical shift values are quoted relative to a thin α-Fe foil calibration.
Results and Discussion
Synthesis.
A preliminary synthesis using only SrO and FeSe in equimolar quantities was found to produce the reported phase with a large proportion of SrSe impurity. The synthesis was then modified by the inclusion of Fe2O3 and Fe to target (FeO)x(SrSe)y compositions with x > y to minimise impurities and
infer the composition. Sample purity and Bragg peak asymmetry were found to vary greatly with the synthesis temperature, even with the correct compositional ratio of elements. Common impurities included SrSe, Fe3O4, SrFe2Se2O, and FeO. Repeated annealing at 760 °C or below yielded a
composition with higher levels of FeO or Fe3O4 impurity (~2-5 % by mass), whereas repeated
annealing above 760 °C yielded a product with higher levels of SrFe2Se2O impurity (3-8 % by mass).
The highest purity samples were produced by placing the sealed crucible into a preheated furnace at 900 °C and leaving it to dwell for only 80 minutes before quenching in ice water. This is similar to the bulk synthesis reported by Lai et al., although their reaction was of a longer duration. This method produced samples with ~1.1 % SrSe, 1.6 % SrFe2Se2O, and 0.3 % FeO by mass (sample A). The
product was a grey powder and the room temperature resistivity of a cold-pressed pellet of sample
A was measured as 0.4 Mcm, suggesting insulating behaviour. A second sample made by repeated annealing at 740°C in the intentionally slightly SrSe-rich stoichiometric ratio of 7Sr:10Fe:7Se:10O has also been used in this work (sample B), which contained only 0.9% SrFe2Se2O and 1.2% FeO as well
as a 5.6% SrSe impurity, which was readily treated as a second phase in the Rietveld refinement.
Structure solution.
The laboratory XRPD pattern of Sr2Fe3Se2O3 was initially indexed on an orthorhombic unit cell with
6
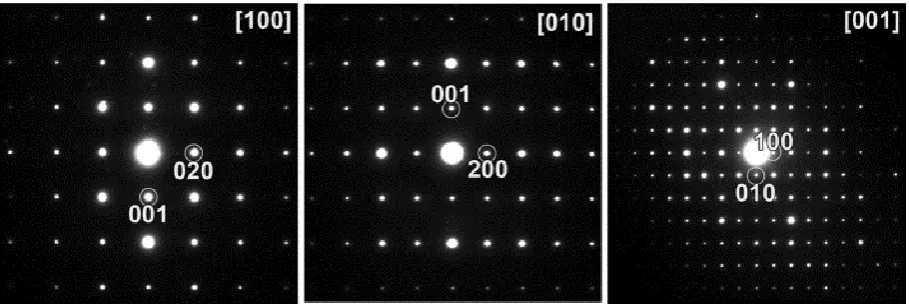
[image:7.595.73.528.161.314.2]Academic,21 with Pbam symmetry imposed, using high resolution PXRD data collected with the I11 instrument. The algorithm was successful in identifying the locations of all ions in the unit cell, allowing the identity of the ions on each site to be subsequently deduced by comparison of their inter-ionic distances with those in relevant binary compounds.
Figure 1. Electron diffractograms of Sr2Fe3Se2O3 along the major zone axes.
The structural model obtained from charge-flipping was confirmed and refined using Rietveld analysis. At this stage, the model was trialled in space group Pba2; the other candidate space group that accounted for the systematic absences in the electron diffraction experiment. In reducing the symmetry from Pbam to Pba2, site positions are allowed to refine freely along the z axis – a consequence of the lack of the centre of inversion. No significant improvement to the fit or change in the atomic positions was observed on allowing this reduction of symmetry and so centrosymmetric Pbam was chosen as the space group. During the course of our work we became aware of the discovery of the isostructural compound Sr2Co3S2O316 and the report of Sr2Fe3Ch2O3 (Ch
7
Figure 2 Rietveld refinement against the PXRD pattern (I11) of Sr2Fe3Se2O3 sample B taken at room
temperature (note that this sample was intentionally prepared with a slight excess of SrSe in the reaction mixture, hence the presence of significant amounts of this phase in the sample).
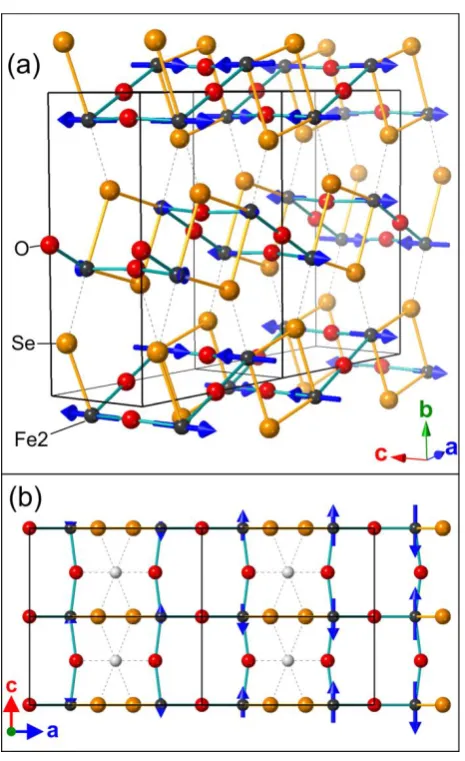
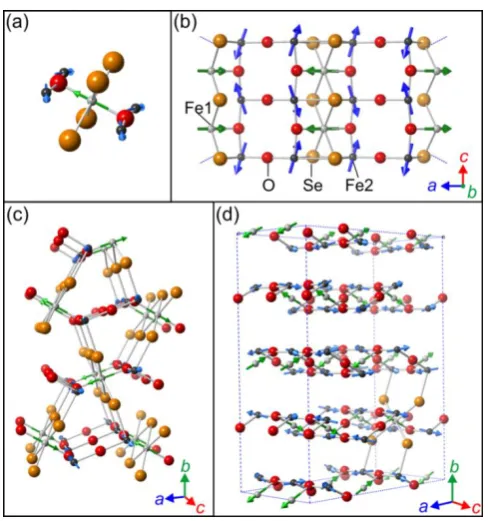
The Sr2Fe3Se2O3 structure is shown in Figure 3. For further discussion of the structure the reader is
also referred to the works of Lai et al.15,16The key features of the structure are as follows: there are
two iron coordination environments shown in Figure 3(a): Fe1 has a compressed trans-FeSe4O2
octahedral environment with a multiplicity of 2 in the unit cell, while Fe2 has a distorted mer -FeSe3O3 octahedral environment with a multiplicity of 4 in the unit cell. The two environments have
complex interconnectivity shown in Figure 3(b): each trans-FeSe4O2 octahedron (Fe1) shares four
faces (necessarily Se2O1) with mer-FeSe3O3 octahedra (Fe2), and is linked to two other trans-FeSe4O2
(Fe1) octahedra through Se2 edges to form chains of the trans-FeSe4O2 (Fe1) polyhedra extending
along the c axis. Mer-FeSe3O3 octahedra (Fe2) connect to each other via Se2 edges which are the
same as those shared to form the chains of trans-FeSe4O2 (Fe1) octahedra extending along c (Figure
3(b). The mer-FeSe3O3 (Fe2) octahedra are further linked along the c direction though trans O
vertexes to two other mer-FeSe3O3 octahedra (Fe2). Lai et al.15,16 describe this motif (Figure 3(b))
extending along the c axis as a necklace ladder. The remaining O vertexes of the mer-FeSe3O3 (Fe2)
octahedra join these necklace ladders along the a direction and the resulting double chains of O-vertex-linked mer-FeSe3O3 (Fe2) octahedra which extend along c are described as a 2-leg rectangular
ladder.16 These connected ladders form a layer as shown by the solid bonds in Figure 3(c) that Lai et al. describe as a hybrid spin ladder.15,16 These hybrid ladders are joined together along the b axis by sharing of the remaining Se vertexes of the mer-FeSe3O3 (Fe2) octahedra as indicated by the dotted
bonds in Figure 3(c).
8
such as Sr2Fe2Se2OF2,22 Na2Fe2Se2O,23 and the phase of BaFe2Se2O synthesised at high pressure,24 in
which the polyhedra share faces producing layers containing Fe2O sheets, an arrangement also
found in chalcogenide and pnictide analogues with these structure types containing other transition metals25,26,27,28 and in the structurally related oxide sulfide Ca2Fe2.6S2O3.29 Both polymorphs of
La2FeSe2O2 also display this coordination environment for Fe2+ ions with linking via shared selenide
edges,30 and this coordination environment and mode of connection is also found in La5V3O7S6.31 As
discussed by Lai et al. in the original report of Sr2Co3S2O316 the mer-[MX3O3] octahedral environment
(M = transition metal; X = non-oxide ion) is rare, although it has been reported for TiS3O3 octahedra
[image:9.595.182.415.262.412.2]in La6Ti2S8O5.32
Figure 3. (a) the local coordination enviroments of the two iron sites; (b)connectivity of the Fe1 and Fe2 octahedra, described by Lai et al. as the necklace ladder; (c) Structure of Sr2Fe3Se2O3 showing
the Fe2 bonding network. Solid bonds show linkages of Fe2 in the necklace ladder and 2-leg ladder that together form a layer described as a hybrid spin ladder,15,16 which joins to adjacent ladders
through selenide vertexes (dashed bonds).
Magnetometry.
Our magnetic susceptibility measurements show transitions consistent with those observed using magnetometry and heat capacity measurements by Lai et al.15 In what follows we adopt their notation. The transitions are shown in Figure 4(b) at ~125 K (TN1), 50 K (TN2) and 40 K (T′). TN1
coincides approximately with the Verwey transition of Fe3O4, and while only 0.05 % of this phase
(below the detection limit of bulk diffraction measurements) would be required to produce such a transition in the magnetisation, the heat capacity measurements of Lai et al.15show that this feature is associated with the bulk of the sample. Figure 4(a) shows a change in the shape of the hysteresis loops, obtained after field-cooling from room temperature at 5 T, on passing through the 50 K(TN2)
9
[image:10.595.74.511.189.407.2]curve of the magnetisation isotherm at 2 K obtained after zero-field-cooling in the report of Lai et al.15 In our field-cooled (5 T) isotherm at 2 K a higher-field feature is evident above 2 T which was also observed in the hysteresis loop of Lai et al.15 The behaviour suggests that there may be a field-dependence to the magnetic ordering which would require neutron diffraction investigations beyond the scope of those performed here.
Figure 4 (a) Magnetisation isotherms measured by cooling sample B from 200 K in a +5T field to the measurement temperature and sweeping the field to –5 T and back to +5T. (b) Zero-field-cooled and field-cooled temperature dependence of the magnetic susceptibility of sample B measured in a 1000
Oe field.
Neutron Powder Diffraction.
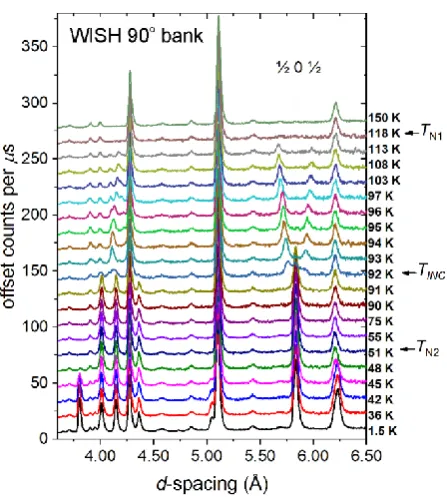
Variable temperature NPD measurements (Figure 5) were carried out on both sample A and sample
B on warming. Sample A was measured in narrow temperature steps from 1.5 K to 150 K, while diffraction patterns with better statistics were collected on sample B at 20, 55, 97, and 135 K corresponding to key ordered states. Rietveld refinements against data from both samples produced identical models for the magnetic ordering. On cooling we observe magnetic ordering transitions as follows. Below 118 K (equated with TN1) magnetic Bragg peaks begin to appear. On cooling further
these peaks shift remarkably in d-spacing until 92 K is reached (Figure 5). We identify this temperature as a fourth magnetic transition for this compound which is not evident in the magnetic susceptibility measurements. We give this the symbol TINC because it is associated with the transition
10
temperature is lowered, as can be seen in the change in intensity of the peak at 3.8 Å between 48 and 42 K in Figure 5..
[image:11.595.188.412.196.445.2]Analysis of the commensurate reflections was performed using the ISODISTORT software,33 coupled with Rietveld refinement in Topas Academic v6.19 Rietveld refinement of the incommensurate magnetic structure was performed using FullProf.34
Figure 5. Evolution with temperature of the neutron powder diffraction patterns of Sr2Fe3Se2O3
sample A measured as a function of temperature. Data from the detector bank with a mean 2 of 90°are shown.
Magnetic scattering in all diffraction patterns above TN2 = 51 K could be accounted for solely by
ordering on one of the Fe sites. In principle the magnetic contribution to the Bragg scattering alone does not allow us to distinguish whether the Fe1 or the Fe2 site is responsible. However the Fe2:Fe1 ratio of 2:1 enabled us to deduce, from the size of the ordered moment, that the Fe2 site (the
mer-FeSe3O3 site which accounts for two thirds of the iron sites) must be the one ordered in this regime
(with an ordered moment of 3.04(1) B at 55 K) otherwise the less numerous Fe1 sites would each
carry an ordered moment of 4.75(2) µB at 55 K, which exceeds the maximum saturated value
expected for Fe2+. This result is consistent with the Mössbauer data (see below). We firstly consider the magnetic structure that pertains between TN2 (51 K) and TINC (92 K). This can be accounted for
11
expanded unit cell gave a good fit to the data with a combination of mU2(ξ1,0) modes (following the
notation35,36 of Miller and Love used in ISODISTORT). This may be described in the magnetic space group Bab21m (36.178) (BNS notation).37 The ordering scheme is as shown in Figure 7, in which the
moments are directed along the c axis with antiferromagnetic coupling (J1). In the direction of the a
axis, the moments are antiferromagnetically aligned along the vertex-sharing 180° Fe(2)–O–Fe(2) pathways (J2), and ferromagnetically aligned along the 99° Fe(2)–Se–Fe(2) pathways (J3) resulting
from edge sharing. These three J1 couplings in the ac plane occur in the hybrid spin ladders described
by Lai et al.15 It is these intra-ladder interactions that appear to dominate the magnetic ordering scheme between TN2 and TINC. The alignment of spins by the inter-ladder couplings (J4-J7) exhibits an
inherent frustration: according to the refined magnetic structure, for half the Fe2 ions J4 is
ferromagnetic but J5, J6 and J7 are antiferromagnetic and for the other half of the Fe2 ions J4 is
antiferromagnetic but J5, J6 and J7 are ferromagnetic. The ordering is summarised in the schematic in
Figure 7(d).
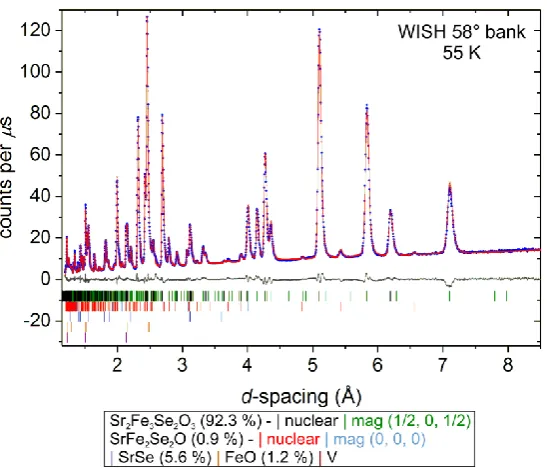
Figure 6. Rietveld refinement against NPD data collected with sample B at 55 K (i.e. between TN2 and
TINC with commensurate antiferromagnetic ordering on the Fe2 sites). Data from the detector bank
with a mean 2 of 58°are shown.
We note that the resulting magnetic space group is polar, indicating that the magnetic transition at
TINC breaks the spatial inversion symmetry. Indeed, the magnetic order, which transforms as the
mU2(ξ1,0) irreducible representation, couples a displacive distortion with the Γ4–(σ) symmetry
[image:12.595.167.441.342.577.2]12
[image:13.595.74.524.121.457.2]net dipolar moment in the structure and it is probably the origin of the frustration release in the inter-ladder couplings (J4–J7 in Figure 7).
Figure 7 (a) Magnetic ordering scheme of the Fe2 sites between 51 (TN2) and 92 K (TINC) consisting of
moments pointed along the c axis. Sr and Fe1 sites are not shown. (b) Arrangement of the Fe2 magnetic moments in the hybrid spin ladder. (c) Local environment of an Fe2 ion with J-couplings to
seven other Fe2 ions that are mediated by a single anion: three of which are intra-ladder and four are inter-ladder (d) schematic diagram of the magnetic ordering and couplings with colours indicating the relationships between neighbouring spins. The magnetic moments in the diagram are directed in the plane along the c axis and are coupled antiferromagnetically (J1) down that axis on all
Fe2 sites. The unit cell shown is that of the magnetic cell, doubled along the a and c axes relative to the nuclear cell.
On warming through TINC the magnetic Bragg peaks on a propagation vector (½, 0, ½) develop
13
before long range order is lost at TN1. Our model for the incommensurate magnetic structure is still
described by spins directed along the c axis, with antiferromagnetic alignment (J1). Magnetic
couplings in the a axis still have net antiferromagnetic alignment along the 180° oxide linkages (J2)
and net ferromagnetic alignment along the 99° selenide linkages (J3) however, there is a modulation
in the size of the ordered moment along a as shown in Figure 8. The occurrence of this incommensurate magnetic structure is presumably a response to the inherent frustration of the interlayer interactions (J4-J7) in the commensurate structure below TINC, shown by the dotted lines in
[image:14.595.180.413.317.698.2]Figure 7(c): the modulation in each layer is out of phase with that in the adjacent layer, such that when the moment is at a maximum in one layer it is at a minimum in the layer below. Numerous systems are known where frustration of magnetic interactions results in the adoption of a modulated magnetic structure.38,39,40,41 Attempts to model the magnetic scattering using a cycloidal magnetic structure produced poor fits (see Figure S8).
Figure 8 (a) Magnetic ordering scheme of the Fe2 sites between 120 (TN1) and 92 K (TINC) consisting
14
nuclear cell. Fe1 sites are not shown in (a) and Sr sites are not shown in (a) or (b). See caption to Figure 7 for the convention on coloring of bonds.
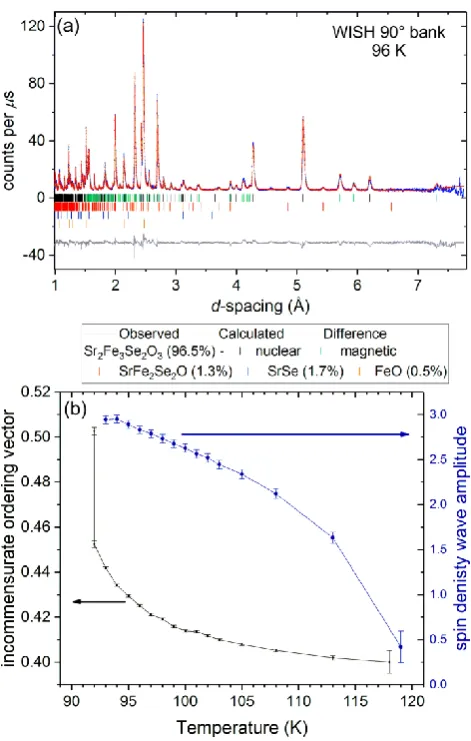
Rietveld refinement against the neutron diffraction pattern at 96 K is shown in Figure 9(a). The incommensurate magnetic structure is described within the Pbam1’(a0½)000s superspace group corresponding to the action of the mA3 irreducible representation of the parent space group and can be described as a spin density wave with amplitude ~3.0 µB at 95 K. The transition at TINC is a
lock-in on cooling from the incommensurate propagation vector to the commensurate (½ 0 ½) value with a locking of the origin (corresponding to a locking of the phase of the sine wave) along the propagation vector direction to the value 1/8+n/2, where n is an integer number, resulting in the
Bab21m magnetic space group. There appears to be no discernable signature of this transition in the
[image:15.595.181.417.329.700.2]susceptibility measurements.
Figure 9. Rietveld refinement against WISH NPD data (data bank with a mean 2 of 90°) of sample A
15
the Fe2 sites and of the variable component a of the propagation vector (a, 0, ½) against temperature.
A second set of magnetic reflections appears below TN2 (51 K), which index on a propagation vector
k = (½, ½, 0). These arise from the long range ordering of the moments on the Fe1 sites combined with the existing magnetic ordering of the Fe2 sites, this gives an overall magnetic unit cell of 2a × 2b × 2c relative to the structural cell. ISODISTORT was used to test ordering schemes for the Fe1 moments that might contribute to the additional reflections observed below TN2, with k point S (k=½,
½, 0), for which it was found the majority of the new magnetic scattering could be accounted for by a combination of mS3+S4+(ε1,ε2) modes, however it was not possible to fit the new magnetic
intensities (Figure 10) which occur below TN2 using solely a combination of the Fe1 magnetic
ordering modes without serious discrepancies. Allowing the already-ordered Fe2 moments to reorient so that they would contribute to the intensity of these new magnetic Bragg peaks that emerge below TN2 gave a much improved fit, with better visual agreement and a lowered Rwp from
7.8 to 4.6 %. In the overall fit the Fe1 moments lie along the Fe1–O bonds in the ab plane, which was also the conclusion of Lai et al.15 from fitting of their Mössbauer data, and this and their ferromagnetic alignment via sharing of Se2 edges is consistent with the orientation of moments in
the magnetic structure of Sr2Fe2S2OF2.42 The Fe2 moments that were already ordered above TN2
remain principally directed along the c axis with the mU2 ordering scheme, however to fully account for the magnetic intensities below TN2 they acquire a canting in the ab plane described by a
combination of mS3+S4+ modes. A comparison of the fit with and without this Fe2 site canting is given in the supporting information (Figure S3). This rearrangement of the spins becomes established at 40 K and may be associated with the T’ transition in heat capacity measurements of Lai et al.15 The canting puts the Fe2 moments in a plane with their nearest Fe1–O bond and the corresponding Fe1 moment, with antiferromagnetic alignment between each of the Fe1 moments and the Fe2 moments canting as shown in Figure 11(a). The ordering scheme thus derived is purely antiferromagnetic, and can be described in the Iab magnetic space group in a 2anucl × 2bnucl × 2cnucl
16
To explain the canting of the Fe2 sublattice with the mS3+S4+(ε1,ε2) modes it is necessary to take
into consideration a nuclear distortion with the right symmetry to allow a trilinear invariant in the free energy, coupling the two magnetic distortions. To conserve the translational symmetry of the parent structure, the nuclear distortion needs to have a propagation vector q=(0 ½ ½), the T point of the first Brillouin zone, and to transform as the T2 irreducible representation with order parameter direction P(δ1,δ2). This allows us to derive a trilinear invariant 𝑎𝜉1(𝜀1𝛿1+ 𝜀2𝛿2) + 𝑏𝜉1(𝜀1𝛿2− 𝜀2𝛿1)
describing the coupling, mediated by the T2(δ1,δ2), between the magnetic mU2(ξ1,0) and
mS3+S4+(ε1,ε2) distortions. Any monoclinic nuclear distortion was outside the resolution of the WISH
diffractometer, and we did not observe any superstructure reflections consistent with q= (0 ½ ½). We used the X-ray diffractometer ID22 at the ESRF to investigate whether the magnetic ordering at
TN2 gives rise to a small monoclinic distortion of the nuclear cell or the presence of 0 ½ ½ peaks, that
might be associated with the T’ transition in the heat capacity data of Lai et al.15 Our measurement at 5K showed no apparent symmetry lowering distortion (Figure S4), but a careful observation of the diffraction pattern indicated the presence of a very weak reflection, not present at ambient temperatures, that could be indexed as the 0 5/2 ½ reflection (Figure S5). Even if this reflection is statistically significant, its spurious nature cannot be excluded, but its position and the propagation vector are consistent with the symmetry analysis. A refinement with the distorted monoclinic symmetry Im is not possible due to the weak character of the distortion (i.e. the low intensity of the proposed 0 5/2 ½ reflection) and the high number of free parameters. Even considering this extra nuclear distortion, on the ground state magnetic space group, the weak ferromagnetic moment is still not allowed from the resulting symmetry. Note that we needed to use an attenuated beam on ID22 to avoid sample heating when performing this experiment: with the full intensity beam sample heating was evident as had been observed and described in measurements down to 75 K by Lai et al.
17
Figure 10. Rietveld refinement against NPD data collected with sample B at 20 K (below TN2 with
both Fe sublattices ordered). Data from the detector bank with a mean 2 of 58°are shown.
Figure 11. Magnetic structure of Sr2Fe3Se2O3 observed between 1.5 and 50 K (TN2). (a) the local
environment of the Fe1 moment relative to the nearest neighbour Fe2 sites. (b) Arrangment of Fe1 and Fe2 moments in the spin hybrid ladders (compare with Figure 7(b)). (c) Arrangment of moments
between ladders. (d) magnetic unit cell below TN2, which is a 2a × 2b × 2c expansion relative to the
[image:18.595.177.422.354.615.2]18
Figure 12.Evolution of (a) the total ordered moments on the two Fe sites and (b) the evolution of the components of the Fe2 moments showing the change in orientation that coincides with the
onset of long range ordering of the Fe1 moments at TN2. The kink in the magnitude of the Fe2
19
Table 1 Structural and magnetic information from Rietveld refinement of Sr2Fe3Se2O3. Further details
are given in the supporting information. Sample Sr2Fe3Se2O3 sample B
Instrument I11 WISH
T (K) 298 135 55 20
Nuclear symmetry Pbam (55) Pbam (55) Pbam (55) Pbam (55)
a (Å) 7.8121(2) 7.8003(2) 7.7963(2) 7.7945(2)
b (Å) 10.23747(9) 10.2112(3) 10.2008(3) 10.1979(3)
c (Å) 3.99388(5) 3.99121(9) 3.98951(9) 3.9893(1)
V (Å3) 319.413(7) 317.97(1) 317.18(1) 317.10(1) Density (g cm–3) 5.70486(9) 5.7308(2) 5.7452(2) 5.7465(3)
Rwp(%) 5.22 4.10 4.55 4.61
χ2 1.56 1.06 1.17 1.21
Sr–O × 2 × 1 × 1 × 1 Sr–Se × 2 × 2 2.6465(4) 2.765(3) 2.870(4) 2.930(3) 3.1253(7) 3.1406(7) 2.617(2) 2.787(4) 2.876(4) 2.904(4) 3.109(3) 3.137(2) 2.597(2) 2.785(4) 2.885(3) 2.918(4) 3.113(2) 3.146(2) 2.609(2) 2.784(4) 2.874(5) 2.915(4) 3.117(3) 3.155(3) Fe1–O × 2
Fe1–Se × 4
2.029(4) 2.7225(4) 2.011(3) 2.738(2) 1.982(3) 2.738(2) 1.992(4) 2.708(2) Fe2–O × 2
× 1
Fe2–Se × 1 × 1 × 1 2.0059(3) 2.0878(9) 2.7659(10) 2.8740(11) 2.9017(11) 2.0084(4) 2.082(2) 2.714(3) 2.905(3) 2.918(3) 2.0076(3) 2.103(1) 2.721(3) 2.889(3) 2.894(2) 2.0078(4) 2.092(2) 2.754(3) 2.870(3) 2.880(3) Regime Paramagnetic Paramagnetic Fe2 ordered Fe1 and Fe2
ordered Basis expansion of
nuclear cell
- - [2,0,0], [0,1,0],
[0,0,2]
[2,0,0], [0,2,0], [0,0,2]
origin - - (-1/4,0,1/2) (0,0,0)
Magnetic symmetry (BNS)
- - Bab21m(36.178)* Iab (9.40)*
K vector - - [½, 0, ½] [½, 0, ½] , [½,½, 0] Fe1 |spin| along a,
b, c (µB)
- - - 3.10(2), 1.34(7), 0
Fe1 total spin (µB) - - - 3.38(3)
Fe2 |spin| along a,
b, c (µB)
- - 0, 0, 3.01(1) 0.69(2), 0.59(5), 3.18(1)
Fe2 total spin (µB) - - 3.01(1) 3.31(1)
20
Mössbauer Spectroscopy.
The temperature dependence of the Mössbauer spectra has been described and interpreted by Lai
et al.15Here we show the evolution of the spectra in the region from just above T
N1 to just below TINC
spanning the region where the magnetic ordering of the Fe2 moments is incommensurate and the Fe1 moments do not participate in long range order. The data and fits in Figure 13 show the onset of magnetic order between 125 K and 110 K and the evolution to 80 K, below TINC. At 125 K (Figure 13)
in the paramagnetic region, the data are modelled by two doublets. The more numerous Fe2 moments produce a doublet with a chemical shift (relative to a thin Fe foil) of = 1.001(2) mm s–1 and with a quadrupole splitting of EQ = 1.897(8) mm s–1. The remaining doublet is ascribed to the
Fe1 moments ( = 0.963(4) mm s–1; EQ = 1.46(1) mm s–1). As magnetic ordering occurs, the majority
signal due to the Fe2 sites is described by a sextet confirming that it is the Fe2 moments that are participating in long range magnetic order below TN1 (see the potential ambiguity described above in
the analysis of the NPD data). At 80 K (Figure 13), below TINC, the signal due to these Fe2 moments is
described by a highly asymmetric sextet arising from the local magnetic field, Bhf, due to the
magnetic ordering and the quadrupole splitting due to the asymmetric coordination environment.43 The minority Fe1 signal persists as a quadrupole doublet. In the region between TN1 and TINC, where
the NPD data show incommensurate magnetic ordering of the Fe2 moments, the Fe2 sextet in the Mössbauer spectrum exhibits very broad lines. The data in this region (110 K and 97 K in Figure 13) were modelled using a quadrupole splitting similar to that used in the paramagnetic region above
TN1 and in the commensurately ordered region below TINC, and a single value for the local magnetic
21
Figure 13. Mössbauer spectra measured through the transitions TN1and TINC. Isomer shift relative to
room temperature thin α-Fe foil. Fitting parameters are given in Table 2.
125 K
110 K
97 K
22
Table 2. Summary of Mössbauer parameters of fit components, relative to room temperature α-Fe. Temp
(K)
Site δ (mm s–1)
ΔEQ
(mm s–1)
η Bhf
(T)
HWHM (mm s-1)
Area (%)
Reduced Chi2
125 Fe1 0.96 1.46 0.15 37 0.784
Fe2 1.00 1.88 0.14 63
110 Fe1 0.97 1.52 0.17 37 1.350
Fe2 1.06 1.83* 0.7* 4.16 0.36 63
97 Fe1 0.98 1.45 0.14 34 2.190
Fe2 1.00 1.83* 0.7* 8.49 0.35 66
80 Fe1 0.98 1.47 0.15 34 0.840
Fe2 1.03 1.71 0.7 11.11 0.15 66 ± 1 ± 0.02 ± 0.02 ± 0.5 ± 0.01 ± 1 *Quadrupole splitting, ΔEQ, and asymmetry, , fixed in the incommensurate region.
Figure 14. (a)The evolution of the mean hyperfine field, Bhf, for the Fe2 sites on cooling through TN1
and TINC. (b) The evolution of the linewidths (expressed as half-width at half-maximum (HWHM)) for
the Fe1 and Fe2 signals on cooling through TN1 and TINC. The broader widths in the region of the
[image:23.595.207.387.352.670.2]23
Conclusions
Sr2Fe3Se2O3 with two unusual and highly anisotropic environments for Fe2+ ions shows a complex
succession of magnetic ordering transitions. Neutron powder diffraction measurements unveil the origin of the complexity in the magnetic susceptibility and Mössbauer spectra previously described15 and reveal an additional region of magnetic behaviour where the onset of long range magnetic ordering on one of the Fe sublattices (Fe2) on cooling results first of all in an incommensurate region of long range order, presumably driven by frustration of some of the weaker exchange interactions. The lowest temperature magnetic structure is dictated by the interactions between the two sublattices of long-range-ordered Fe moments. Given the complexity of the magnetic structures found for compounds composed of these highly anisotropic transition metal coordination environments26,42 there is scope for tuning the details of the exchange interactions by chemical substitution on the transition metal, chalcogenide and electropositive metal sites.
Associated Content.
Supporting Information
The Supporting Information (.pdf) is available free of charge on the ACS Publications website at DOI:XXXXX.: further Rietveld refinements and diffractograms, tables of refinement results and further discussion of the magnetic models.
Author Information.
SJC (Cassidy) prepared the samples and performed the diffraction and magnetometry measurements. FO, PM and SJC (Cassidy) measured and interpreted the NPD data. JH performed and interpreted the electron diffraction measurements. AS and PAB performed and interpreted the Mössbauer spectroscopy measurements. SJC (Cassidy and Clarke) conceived the project and wrote the paper with input from all co-authors. The authors declare no competing financial interest.
Corresponding Author.
24
Acknowledgements.
25
References
(1) Hiramatsu, H.; Kamihara, Y.; Yanagi, H.; Ueda, K.; Kamiya, T.; Hirano, M.; Hosono, H. Layered mixed-anion compounds: Epitaxial growth, active function exploration, and device application. J. Eur. Ceram. Soc.2009, 29, 245–253.
(2) Ueda, K.; Inoue, S.; Hirose, S.; Kawazoe, H.; Hosono, H. Transparent p -type semiconductor: LaCuOS layered oxysulfide. Appl. Phys. Lett.2000, 77, 2701–2703.
(3) Scanlon, D. O.; Watson, G. W. (Cu2S2)(Sr3Sc2O5)-A layered, direct band gap, p-type transparent
conducting oxychalcogenide: A theoretical analysis. Chem. Mater.2009, 21, 5435–5442.
(4) Zhao, L. D.; Berardan, D.; Pei, Y. L.; Byl, C.; Pinsard-Gaudart, L.; Dragoe, N. Bi1−xSrxCuSeO
oxyselenides as promising thermoelectric materials. Appl. Phys. Lett.2010, 97, 092118.
(5) Kamihara ,Y.; Watanabe, T.; Hirano, M.; Hosono H. Iron-Based Layered Superconductor La[O1–
xFx]FeAs (x = 0.05−0.12) with Tc = 26 K. 2008, 130, 3296–3297.
(6) Hsu, F.-C.; Luo, J.-Y.; Yeh, K.-W.; Chen, T.-K.; Huang, T.-W.; Wu, P. M.; Lee, Y.-C.; Huang, Y.-L.; Chu, Y.-Y.; Yan, D.-C.; Wu, M.-K. Superconductivity in the PbO-type structure -FeSe. Proc. Natl. Acad. Sci.2008, 105, 14262–14264.
(7) Sun, H.; Woodruff, D. N.; Cassidy, S. J.; Allcroft, G. M.; Sedlmaier, S. J.; Thompson, A. L.; Bingham, P. A.; Forder, S. D.; Cartenet, S.; Mary, N.; Ramos, S.; Foronda, F. R.; Williams, B. H.; Li, X.; Blundell, S. J.; Clarke, S. J. Soft chemical control of superconductivity in lithium iron selenide hydroxides Li1–xFex(OH)Fe1–ySe. Inorg. Chem.2015, 54, 1958–1964.
(8) Clarke, S. J.; Adamson, P.; Herkelrath, S. J. C.; Rutt, O. J.; Parker, D. R.; Pitcher, M. J.; Smura, C. F. Structures, Physical Properties, and Chemistry of Layered Oxychalcogenides and Oxypnictides. Inorg. Chem.2008, 47, 8473–8486.
(9) Mayer, J. M.; Schneemeyer, L. F.; Siegrist, T.; Waszczak, J. V.; Van Dover, B. New Layered Iron-Lanthanum-Oxide-Sulfide and -Selenide Phases: Fe2La2O3E2(E = S, Se). Angew. Chemie Int. Ed.
English1992, 31, 1645–1647.
26
(11) Cassidy, S. J.; Batuk, M.; Batuk, D.; Hadermann, J.; Woodruff, D. N.; Thompson, A. L.; Clarke, S. J. Complex Microstructure and Magnetism in Polymorphic CaFeSeO. Inorg. Chem. 2016, 55, 10714–10726.
(12) Han, F.; Wang, D.; Malliakas, C. D.; Sturza, M.; Chung, D. Y.; Wan, X.; Kanatzidis, M. G. (CaO)(FeSe): A Layered Wide-Gap Oxychalcogenide Semiconductor. Chem. Mater.2015, 27, 5695–5701.
(13) Lai, K. T.; Komarek, A. C.; Fernández-Díaz, M. T.; Chang, P. S.; Huh, S.; Rosner, H.; Kuo, C. Y.; Hu, Z.; Pi, T. W.; Adler, P.; Ksenofontov, V.; Tjeng, L. H.; Valldor, M. Canted Antiferromagnetism on Rectangular Layers of Fe2+ in Polymorphic CaFeSeO. Inorg. Chem.
2017, 56, 4271–4279.
(14) Delacotte, C.; Pérez, O.; Pautrat, A.; Berthebaud, D.; Hébert, S.; Suard, E.; Pelloquin, D.; Maignan, A. Magnetodielectric Effect in Crystals of the Noncentrosymmetric CaOFeS at Low Temperature. Inorg. Chem.2015, 54, 6560–6565.
(15) Lai, K. T.; Adler, P.; Prots, Y.; Hu, Z.; Kuo, C.-Y.; Pi, T.-W.; Valldor, M. Successive Phase Transitions in Fe2+ Ladder Compounds Sr2Fe3Ch2O3 (Ch = S, Se). Inorg. Chem.2017, 56, 12606–
12614.
(16) Lai, K. T.; Valldor, M. Coexistence of spin ordering on ladders and spin dimer formation in a new-structure-type compound Sr2Co3S2O3. Sci. Rep.2017, 7, 43767.
(17) Thompson, S. P.; Parker, J. E.; Potter, J.; Hill, T. P.; Birt, A.; Cobb, T. M.; Yuan, F.; Tang, C. C. Beamline I11 at Diamond: A new instrument for high resolution powder diffraction. Rev. Sci. Instrum.2009, 80, 075107.
(18) Chapon, L. C.; Manuel, P.; Radaelli, P. G.; Benson, C.; Perrott, L.; Ansell, S.; Rhodes, N. J.; Raspino, D.; Duxbury, D.; Spill, E.; Norris, J. WISH: The New Powder and Single Crystal Magnetic Diffractometer on the Second Target Station. Neutron News2011, 22, 22–25.
(19) Coelho, A. A. TOPAS Academic Version 5, Coelho Software, Brisbane, Australia. 2012.
(20) Kovats, T. A.; Walker, J. C. Mössbauer absorption in Fe57 in metallic iron from the Curie point
to the - Transition. Phys. Rev.1969, 181, 610–618.
27
(22) Kabbour, H.; Janod, E.; Corraze, B.; Danot, M.; Lee, C.; Whangbo, M.-H.; Cario, L. Structure and Magnetic Properties of Oxychalcogenides A2F2Fe2OQ2 (A = Sr, Ba; Q = S, Se) with Fe2O
Square Planar Layers Representing an Antiferromagnetic Checkerboard Spin Lattice. J. Am. Chem. Soc.2008, 130, 8261–8270.
(23) He, J. B.; Wang, D. M.; Shi, H. L.; Yang, H. X.; Li, J. Q.; Chen, G. F. Synthesis, structure, and magnetic properties of the layered iron oxychalcogenide Na2Fe2Se2O. Phys. Rev. B2011, 84,
205212.
(24) Takeiri, F.; Matsumoto, Y.; Yamamoto, T.; Hayashi, N.; Li, Z.; Tohyama, T.; Tassel, C.; Ritter, C.; Narumi, Y.; Hagiwara, M.; Kageyama, H. High-pressure synthesis of the layered iron oxyselenide BaFe2Se2O with strong magnetic anisotropy. Phys. Rev. B2016, 94, 184426.
(25) Wang, C.; Tan, M. Q.; Feng, C. M.; Ma, Z. F.; Jiang, S.; Xu, Z. A.; Cao, G. H.; Matsubayashi, K.; Uwatoko, Y. La2Co2Se2O3: A quasi-two-dimensional mott insulator with unusual cobalt spin
state and possible orbital ordering. J. Am. Chem. Soc.2010, 132, 7069–7073.
(26) Free, D. G.; Withers, N. D.; Hickey, P. J.; Evans, J. S. O. Synthesis, Structure and Properties of Several New Oxychalcogenide Materials with the General Formula A2O2M2OSe2 ( A = La−Sm,
M = Fe, Mn). Chem. Mater.2011, 23, 1625–1635.
(27) Ni, N.; Climent-Pascual, E.; Jia, S.; Huang, Q.; Cava, R. J. Physical properties and magnetic structure of the layered oxyselenide La2O3Mn2Se2. Phys. Rev. B2010, 82, 214419.
(28) Valldor, M.; Merz, P.; Prots, Y.; Schnelle, W. Bad-Metal-Layered Sulfide Oxide CsV2S2O. Eur. J.
Inorg. Chem.2016, 2016, 23–27.
(29) Zhang, H.; Wu, X.; Li, D.; Jin, S.; Chen, X.; Zhang, T.; Lin, Z.; Shen, S.; Yuan, D.; Chen, X. Ca2O3Fe2.6S2: an antiferromagnetic Mott insulator at proximity to bad metal. J. Phys. Condens.
Matter2016, 28, 145701.
(30) Nitsche, F.; Niklaus, R.; Johrendt, D. New Polymorphs of RE2FeSe2O2 (RE = La, Ce). Zeitschrift
für Anorg. und Allg. Chemie2014, 640, 2897–2902.
(31) Dugué, J.; Tien, V.; Laruelle, P. Structure de l’oxysulfure de lanthane et de vanadium, La5V3O7S6. Acta Crystallogr. Sect. C Cryst. Struct. Commun.1985, 41, 1146–1148. DOI:
28
(33) Campbell, B. J.; Stokes, H. T.; Tanner, D. E.; Hatch, D. M. ISODISPLACE : a web-based tool for exploring structural distortions. J. Appl. Crystallogr.2006, 39, 607–614.
(34) Rodríguez-Carvajal, J. Recent advances in magnetic structure determination by neutron powder diffraction. Phys. B Phys. Condens. Matter1993, 192, 55–69.
(35) Miller, S. C.; Love, W. F. Tables of irreducible representations of space groups and co-representations of magnetic space groups; Pruett Press: Boulder Colo., 1967.
(36) Cracknell, A. P.; Davies, B. L.; Miller, S. C.; Love, W. F. Kronecker product tables, Vol. 1, General introduction and tables of irreducible representations of space groups.; IFI/Plenum: New York, 1979.
(37) Magnetic Group Tables; Litvin, D. B., Ed.; International Union of Crystallography: Chester, England, 2013.
(38) Yamaguchi, H.; Miyagai, H.; Yoshida, M.; Takigawa, M.; Iwase, K.; Ono, T.; Kase, N.; Araki, K.; Kittaka, S.; Sakakibara, T.; Shimokawa, T.; Okubo, T.; Okunishi, K.; Matsuo, A.; Hosokoshi, Y. Field-induced incommensurate phase in the strong-rung spin ladder with ferromagnetic legs.
Phys. Rev. B2014, 89, 220402.
(39) Hsieh, D.; Qian, D.; Berger, R. F.; Cava, R. J.; Lynn, J. W.; Huang, Q.; Hasan, M. Z. Unconventional spin order in the triangular lattice system NaCrO2: A neutron scattering
study. Phys. B Condens. Matter2008, 403, 1341–1343.
(40) Fang, C.; Hu, J. An effective model of magnetoelectricity in multiferroics RMn2O5. Europhys.
Lett.2008, 82, 57005.
(41) Keller, L.; Doennl, A.; Kitazawa, H.; van den Brandt, B. Geometrical frustration and incommensurate magnetic ordering in CePdAl: a low-temperature neutron-diffraction study.
Appl. Phys. A Mater. Sci. Process.2002, 74, s686–s688.
(42) Zhao, L. L.; Wu, S.; Wang, J. K.; Hodges, J. P.; Broholm, C.; Morosan, E. Quasi-two-dimensional noncollinear magnetism in the Mott insulator Sr2F2Fe2OS2. Phys. Rev. B2013, 87, 020406.
29
For Table of Contents Only
Sr2Fe2Se2O3 displays complex magnetic ordering over two Fe2+ sublattices which is probed using