Post-Occupancy Evaluation and IEQ Measurements from
64 Office Buildings: Critical Factors and Thresholds for
User Satisfaction on Thermal Quality
PARK, Jihyun, LOFTNESS, Vivian and AZIZ, Azizan
Available from Sheffield Hallam University Research Archive (SHURA) at:
http://shura.shu.ac.uk/24086/
This document is the author deposited version. You are advised to consult the
publisher's version if you wish to cite from it.
Published version
PARK, Jihyun, LOFTNESS, Vivian and AZIZ, Azizan (2018). Post-Occupancy
Evaluation and IEQ Measurements from 64 Office Buildings: Critical Factors and
Thresholds for User Satisfaction on Thermal Quality. Buildings, 8 (11), p. 156.
Copyright and re-use policy
See
http://shura.shu.ac.uk/information.html
buildings
Article
Post-Occupancy Evaluation and IEQ Measurements
from 64 Office Buildings: Critical Factors and
Thresholds for User Satisfaction on Thermal Quality
Jihyun Park1,*, Vivian Loftness2and Azizan Aziz1
1 Center for Building Performance and Diagnostics, Carnegie Mellon University, Pittsburgh, PA 15213, USA; azizan@cmu.edu
2 School of Architecture, Carnegie Mellon University, Pittsburgh, PA 15213, USA; loftness@cmu.edu * Correspondence: jihp@cmu.edu
Received: 22 July 2018; Accepted: 5 November 2018; Published: 12 November 2018
Abstract: The indoor environmental quality (IEQ) of buildings can have a strong influence on occupants’ comfort, productivity, and health. Post-occupancy evaluation (POE) is necessary in assessing the IEQ of the built environment, and it typically relies on the subjective surveys of thermal quality, air quality, visual quality, and acoustic quality. In this research, we expanded POE to include both objective IEQ measurements and the technical attributes of building systems (TABS) that may affect indoor environment and user satisfaction. The suite of three tools, including user satisfaction survey, workstation IEQ measurements, and TABS in the National Environmental Assessment Toolkit (NEAT) has been deployed in 1601 workstations in 64 office buildings, generating a rich database for statistical evaluation of possible correlations between the physical attributes of workstations, environmental conditions, and user satisfaction. Multivariate regression and multiple correlation coefficient statistical analysis revealed the relationship between measured and perceived IEQ indices, interdependencies between IEQ indices, and other satisfaction variables of significance. The results showed that overall, 55% of occupants responded as “satisfied” or “neutral”, and 45% reported being “dissatisfied” in their thermal quality. Given the dataset, air temperature in work area, size of thermal zone, window quality, level of temperature control, and radiant temperature asymmetry with façade are the critical factors for thermal quality satisfaction in the field. As a result, the outcome of this research contributes to identifying correlations between occupant satisfaction, measured data, and technical attributes of building systems. The presented integrated IEQ assessment method can further afford robust predictions of building performance against metrics and guidelines for IEQ standards to capture revised IEQ thresholds that impact building occupants’ satisfaction.
Keywords: post occupancy evaluation; indoor environmental quality; user satisfaction; thermal quality; IEQ field measurements; office buildings
1. Introduction
People spend 90% of their time indoors [1]. Numerous studies have indicated that indoor environmental quality (IEQ) in the workplace is critical for occupants’ health and productivity [2–9]. Post-occupancy evaluation (POE) has been utilized to evaluate building performance in a systemic way to improve indoor environmental quality and user satisfaction on thermal, air, visual, and acoustic conditions [10,11]. Many researchers have revealed that subjective POE surveys should be complemented by objective measurements, to judge both subjective and objective conditions [12–17]. In particular, to assess the objective thermal environmental quality, air temperatures at 10 cm, 60 cm, and 110 cm from the floor, radiant temperature differences between walls, radiant temperature
Buildings2018,8, 156 2 of 24
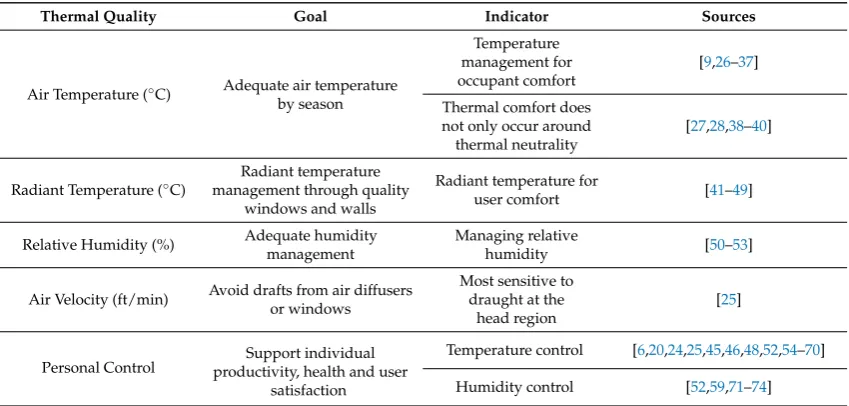
[image:3.595.86.511.361.564.2]differences between the ceiling and the floor, air speed, and relative humidity should be considered in the field POE [9,18–20]. Many studies showed the importance of thermal conditions and identified indicators, as seen in Table1. In a 2010 meta-analysis study concerning human comfort and indoor environmental quality, performed between 1977 and 2009, Wargocki et al., identified that thermal quality ranks as the highest contributing factor for overall satisfaction with IEQ, among other factors such as air, visual, and acoustic qualities [5]. In a 2004 meta-analysis of 100 US office buildings, Moschandreas and Sofuoglu found that temperature is the most crucial factor of occupant comfort [21], and the mean radiant temperature is an important factor for human discomfort, especially in buildings that have poor envelopes [22]. In a 2006 thermal comfort study in Turkey, Atmaca et al. found that although the indoor temperature was under the comfort level (27.1◦C, 50% RH), the high radiant temperature caused increased occupant thermal comfort [23]. In addition, several studies showed that temperature control can increase user satisfaction and productivity. In a 2003 building case study of an office building in Helsinki, Korhonen et al. identified a 24% improvement in self-reported work efficiency during summer, when individuals could control their temperature [24]. In a 2002 field intervention study at a call center in Finland, Niemala et al. identified a 7% improvement in productivity for call center employees (defined as the number of telephone communications divided by the active work time) by the installation of extra cooling capacity, supporting the need for individual temperature control [25].
Table 1.Indices of thermal quality assessment and indicators.
Thermal Quality Goal Indicator Sources
Air Temperature (◦C) Adequate air temperature by season
Temperature management for occupant comfort
[9,26–37]
Thermal comfort does not only occur around thermal neutrality
[27,28,38–40]
Radiant Temperature (◦C) management through qualityRadiant temperature
windows and walls
Radiant temperature for
user comfort [41–49]
Relative Humidity (%) Adequate humidity management
Managing relative
humidity [50–53]
Air Velocity (ft/min) Avoid drafts from air diffusers or windows
Most sensitive to draught at the
head region
[25]
Personal Control productivity, health and userSupport individual satisfaction
Temperature control [6,20,24,25,45,46,48,52,54–70]
Humidity control [52,59,71–74]
2. Method
Buildings2018,8, 156 3 of 24
• Type of organization: federal offices (n = 33), private sector financial, sales, and marketing companies (n= 31)
• Size of office: small- and medium-sized office (less than 500 m2)
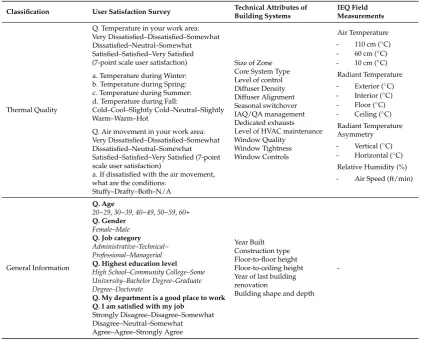
Three different kinds of data were collected to construct a database: occupant satisfaction surveys, technical attributes of building systems, and workstation IEQ measurements. Each workstation had a unique space ID, which was linked exclusively to thermal, air, visual, acoustic, and spatial quality survey data. In total, 29 user satisfaction variables, 110 building systems variables, and 15 IEQ field measurements variables were combined in MySQL. Each workstation had a unique space ID, which is linked exclusively to thermal, air, visual, acoustic, and spatial quality survey data. Table1presents variables which were included in the database. In this paper, we focused on the thermal quality evaluation. The variables that assigned to a single workstation for thermal quality assessment are in Table2.
Buildings 2018, 8, x FOR PEER REVIEW 3 of 26
• Size of office: small- and medium-sized office (less than 500 m2)
Three different kinds of data were collected to construct a database: occupant satisfaction surveys, technical attributes of building systems, and workstation IEQ measurements. Each workstation had a unique space ID, which was linked exclusively to thermal, air, visual, acoustic, and spatial quality survey data. In total, 29 user satisfaction variables, 110 building systems variables, and 15 IEQ field measurements variables were combined in MySQL. Each workstation had a unique space ID, which is linked exclusively to thermal, air, visual, acoustic, and spatial quality survey data. Table 1 presents variables which were included in the database. In this paper, we focused on the thermal quality evaluation. The variables that assigned to a single workstation for thermal quality assessment are in Table 2.
Figure 1. Carnegie Mellon University’s (CMU’s) 3 datasets: Building systems survey, indoor environmental quality (IEQ) field measurements, and user satisfaction survey.
2.1. User Satisfaction Survey
The intention of the survey questionnaire was to understand how occupants experience their present work environments. Occupant surveys are widely used to assess the reactions and responses of occupants to their indoor environments; such surveys are a powerful tool in research [19,77,78]. The occupant was asked to complete a “user satisfaction questionnaire” related to today’s specific
environmental conditions, as compared to annual satisfaction questionnaires during the time when
the workstation’s IEQ measurements were recorded.
The Cost-effective Open-Plan Environment (COPE) questionnaire was developed by the National Research Council Canada (NRCC) to support their ongoing research about measured environmental performance and simultaneous levels of user satisfaction in various open-plan office environments [14]. A few questions have been added by CBPD at CMU as a result of recommendations from the General Services Administration (GSA) field study: seasonal temperature satisfaction (3a–3d), odor (2a), cleanliness (4a), and the reason of air movement dissatisfaction (14) [79,80]. The questionnaires were also deployed in closed offices because the overall IEQ evaluation framework and measurement protocols were the same in both conditions. The analyses were performed separately.
Figure 1. Carnegie Mellon University’s (CMU’s) 3 datasets: Building systems survey, indoor environmental quality (IEQ) field measurements, and user satisfaction survey.
2.1. User Satisfaction Survey
The intention of the survey questionnaire was to understand how occupants experience their present work environments. Occupant surveys are widely used to assess the reactions and responses of occupants to their indoor environments; such surveys are a powerful tool in research [19,77,78]. The occupant was asked to complete a “user satisfaction questionnaire” related to today’s specific environmental conditions, as compared to annual satisfaction questionnaires during the time when the workstation’s IEQ measurements were recorded.
Buildings2018,8, 156 4 of 24
cleanliness (4a), and the reason of air movement dissatisfaction (14) [79,80]. The questionnaires were also deployed in closed offices because the overall IEQ evaluation framework and measurement protocols were the same in both conditions. The analyses were performed separately.
[image:5.595.87.509.199.540.2]This survey was distributed via paper or iPad to selected employees in the workgroup being studied. About 30% of the occupants were recruited in the survey, and AppendixAshows the two pages of user satisfaction survey questionnaires.
Table 2.Illustration of variables assigned to a single workstation (Thermal quality).
Classification User Satisfaction Survey Technical Attributes of
Building Systems
IEQ Field Measurements
Thermal Quality
Q. Temperature in your work area: Very Dissatisfied–Dissatisfied–Somewhat Dissatisfied–Neutral–Somewhat Satisfied–Satisfied–Very Satisfied (7-point scale user satisfaction) a. Temperature during Winter: b. Temperature during Spring: c. Temperature during Summer: d. Temperature during Fall:
Cold–Cool–Slightly Cold–Neutral–Slightly Warm–Warm–Hot
Q. Air movement in your work area: Very Dissatisfied–Dissatisfied–Somewhat Dissatisfied–Neutral–Somewhat Satisfied–Satisfied–Very Satisfied (7-point scale user satisfaction)
a. If dissatisfied with the air movement, what are the conditions:
Stuffy–Drafty–Both–N/A
Size of Zone Core System Type Level of control Diffuser Density Diffuser Alignment Seasonal switchover IAQ/QA management Dedicated exhausts Level of HVAC maintenance Window Quality
Window Tightness Window Controls
Air Temperature - 110 cm (◦C) - 60 cm (◦C) - 10 cm (◦C)
Radiant Temperature - Exterior (◦C) - Interior (◦C) - Floor (◦C) - Ceiling (◦C)
Radiant Temperature Asymmetry - Vertical (◦C) - Horizontal (◦C)
Relative Humidity (%) - Air Speed (ft/min)
General Information
Q. Age
20~29,30~39,40~49,50~59,60+
Q. Gender
Female–Male
Q. Job category
Administrative–Technical– Professional–Managerial
Q. Highest education level
High School–Community College–Some University–Bachelor Degree–Graduate Degree–Doctorate
Q. My department is a good place to work Q. I am satisfied with my job
Strongly Disagree–Disagree–Somewhat Disagree–Neutral–Somewhat Agree–Agree–Strongly Agree
Year Built Construction type Floor-to-floor height Floor-to-ceiling height Year of last building renovation
Building shape and depth
-2.2. IEQ Field Measurements
First launched in 2000, Carnegie Mellon’s portable suite of instruments on the NEAT (National Environmental Assessment Toolkit) cart has evolved over the years (Figure2), and it has continued to become more compact and robust as affordable sensor technology advances, and as field research reveals the attributes that truly need to be measured [18]. This cart was developed to ensure a simultaneous qualitative assessment of the thermal, visual, acoustic, and air environments. Positioned in place of the occupant’s chair at each sampled workstation, the cart collects temperature data at 10 cm, 60 cm, and 110 cm from the floor, the Relative Humidity (RH), Carbon dioxide (CO2) and
Carbon monoxide (CO) concentrations, particulates (PM 2.5 and PM 10), and Total Volatile Organic Compounds (TVOC) at 110 cm, which is defined as the “breathing zone” [81]. Hand-held instruments measure the horizontal and vertical radiant temperature differences, and air velocity. A data logger connected to a tablet personal computer (PC) recorded data from the instruments for analysis [18].
Buildings2018,8, 156 5 of 24
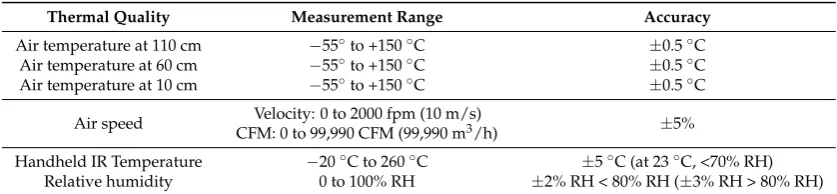
open and closed, perimeter and core workstations. Since sampling may occur during cooling, heating, and swing seasons, the size of the multiple building database was critical for cross-sectional analyses against codes and standards. Code analyses were based on ASHRAE-55 [82] and Environmental Protection Agency (EPA) guidelines for thermal quality assessment [83]. The specifications of the measurement instrument used in this study are in Table3.
Buildings 2018, 8, x FOR PEER REVIEW 5 of 26
First launched in 2000, Carnegie Mellon’s portable suite of instruments on the NEAT (National Environmental Assessment Toolkit) cart has evolved over the years (Figure 2), and it has continued to become more compact and robust as affordable sensor technology advances, and as field research reveals the attributes that truly need to be measured [18]. This cart was developed to ensure a simultaneous qualitative assessment of the thermal, visual, acoustic, and air environments.
Positioned in place of the occupant’s chair at each sampled workstation, the cart collects temperature
data at 10 cm, 60 cm, and 110 cm from the floor, the Relative Humidity (RH), Carbon dioxide (CO2) and Carbon monoxide (CO) concentrations, particulates (PM 2.5 and PM 10), and Total Volatile Organic Compounds (TVOC) at 110 cm, which is defined as the “breathing zone” [81]. Hand-held instruments measure the horizontal and vertical radiant temperature differences, and air velocity. A data logger connected to a tablet personal computer (PC) recorded data from the instruments for analysis [18].
While the physical measurements were recorded, the occupant was asked to sit nearby and to complete the questionnaire (within 15 min), to correlate their satisfaction with the conditions at the time of measurement. The sampling rates of the spot measurements were typically 30% of the total number of office workstations on each floor, or at least 15 workstations if the workgroup is small, with a mix of open and closed, perimeter and core workstations. Since sampling may occur during cooling, heating, and swing seasons, the size of the multiple building database was critical for cross-sectional analyses against codes and standards. Code analyses were based on ASHRAE-55 [82] and Environmental Protection Agency (EPA) guidelines for thermal quality assessment [83]. The specifications of the measurement instrument used in this study are in Table 3.
[image:6.595.119.484.170.363.2]Figure 2. Image of five generations of the Enviro cart, Measure IEQ, with CMU’s National Environmental Assessment Toolkit™.
Table 3. Specifications of the thermal quality measurement instrumentation used in this study.
Thermal Quality Measurement Range Accuracy
Air temperature at 110 cm −55° to +150 °C ±0.5 °C Air temperature at 60 cm −55° to +150 °C ±0.5 °C Air temperature at 10 cm −55° to +150 °C ±0.5 °C
Air speed Velocity: 0 to 2000 fpm (10 m/s)
CFM: 0 to 99,990 CFM (99,990 m3/h) ±5%
Handheld IR Temperature −20 °C to 260 °C ±5 °C (at 23 °C, <70% RH) Relative humidity 0 to 100% RH ±2% RH < 80% RH (±3% RH > 80% RH)
2.3. Technical Attributes of Building Systems
[image:6.595.88.507.421.518.2]The CBPD team developed expert walkthrough worksheets to ensure that comparable data is recorded for the attributes of building systems that affect thermal and air quality (mechanical,
Figure 2. Image of five generations of the Enviro cart, Measure IEQ, with CMU’s National Environmental Assessment Toolkit™.
Table 3.Specifications of the thermal quality measurement instrumentation used in this study.
Thermal Quality Measurement Range Accuracy
Air temperature at 110 cm −55◦to +150◦C ±0.5◦C Air temperature at 60 cm −55◦to +150◦C ±0.5◦C Air temperature at 10 cm −55◦to +150◦C ±0.5◦C
Air speed Velocity: 0 to 2000 fpm (10 m/s)
CFM: 0 to 99,990 CFM (99,990 m3/h) ±5%
Handheld IR Temperature −20◦C to 260◦C ±5◦C (at 23◦C, <70% RH) Relative humidity 0 to 100% RH ±2% RH < 80% RH (±3% RH > 80% RH)
2.3. Technical Attributes of Building Systems
The CBPD team developed expert walkthrough worksheets to ensure that comparable data is recorded for the attributes of building systems that affect thermal and air quality (mechanical, enclosure, interior), lighting and visual quality (enclosure, lighting and interior), acoustic quality (mechanical, enclosure, interior) and spatial/ergonomic quality (individual and collaborative interior conditions as well as amenities). AppendixB shows the technical attributes of building systems questionnaires for thermal quality evaluation.
2.4. Statistical Analysis
Buildings2018,8, 156 6 of 24
• Season (i.e., heating, cooling, and swing season): Depending on the season, buildings run different Heating, Ventilation, and Air Conditioning (HVAC) systems (heating or cooling) and people wear different types of clothing. According to Fanger’s comfort equation, clothing is a critical factor in thermal comfort [84,85]. It is expected that the season needs to be considered to assess perceived thermal satisfaction.
• Gender: There is a significant difference between men and women in thermal dissatisfaction. This difference between the genders may be due to clothing insulation and metabolic differences, so that gender was considered in the data analysis [8,86–88].
• Perimeter vs. Core workstations: Occupants working in perimeter offices have shown higher user satisfaction than those working in the core. The location of the workstation needs to be considered for perceived user satisfaction. Since the environmental variables such as view, thermal control, and air movement, and so on, are quite different between perimeter and core workstations, it is expected that the location of the workstations needs to be considered for perceived user satisfaction [75,78,89].
• Open-plan and closed offices: It has been shown that open-plan office occupants are more satisfied with their environments than closed-office occupants [14]. It is expected that occupant satisfaction may be related to privacy and control issues in the office, so the office types were considered in the analysis [12].
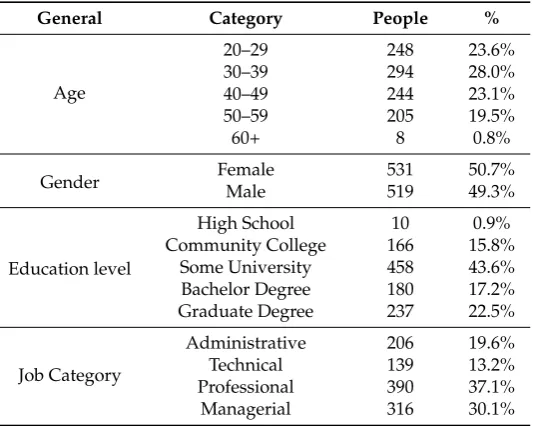
[image:7.595.166.433.410.623.2]Table4show the demographics of participant. Since demographic questions were not mandatory and because some of the organizations did not want to be included in the questionnaire, the total number (n= 1050) was less than other COPE answers.
Table 4.Participant demographics.
General Category People %
Age
20–29 248 23.6%
30–39 294 28.0%
40–49 244 23.1%
50–59 205 19.5%
60+ 8 0.8%
Gender FemaleMale 531519 50.7%49.3%
Education level
High School 10 0.9%
Community College 166 15.8% Some University 458 43.6% Bachelor Degree 180 17.2% Graduate Degree 237 22.5%
Job Category
Administrative 206 19.6%
Technical 139 13.2%
Professional 390 37.1%
Managerial 316 30.1%
Buildings2018,8, 156 7 of 24
[image:8.595.90.509.144.378.2]expression equations. In each model, outliers on the variables used in that phase only were excluded. Therefore, the number of cases in the analyses were slightly different from model to model.
Table 5.Objectives of five models and each diagram.
Model Objective Model Diagram Statistical Method
MODEL 1
Correlation between user satisfaction and workstation
IEQ measurements
Buildings 2018, 8, x FOR PEER REVIEW 7 of 26
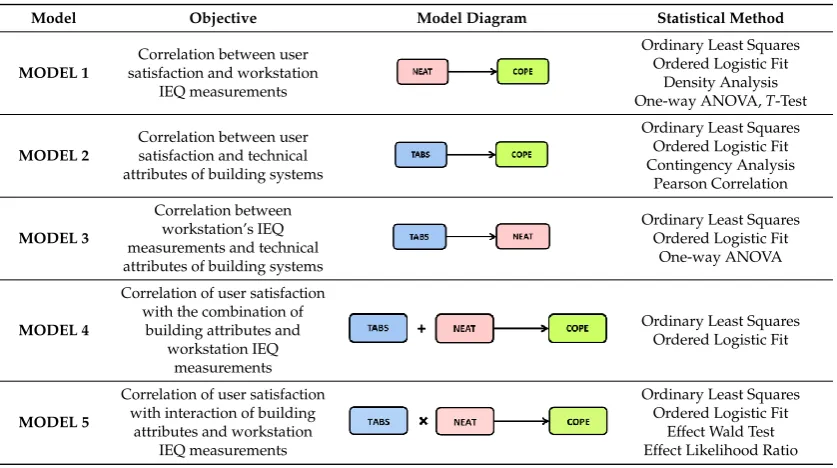
In this research, five models were developed as shown in Table 5. Using five models, we could confirm and re-check the results. A range of statistical methods and data mining algorithms were utilized to test the research hypotheses formalized in the POE field studies. The adopted tools includes descriptive statistics, two-sample t-tests, analysis of variance, and Baron and Kenny’s
mediated regression analysis methods [90]. Bivariate analysis was applied using the chi-squared test for contingency tables. A t-test was used with a 95% confidence interval for the mean by gender, the location of the workstation (perimeter vs core), and office type (open-plan vs closed) that were approximately normally distributed. Density analysis were used to define the thresholds by a 7-scale user satisfaction level. Finally, multiple logistic regression was used to identify significant predictors of user satisfaction. Differences among the 7-scale user satisfaction levels were calculated by prediction expression equations. In each model, outliers on the variables used in that phase only were excluded. Therefore, the number of cases in the analyses were slightly different from model to model.
Table 5. Objectives of five models and each diagram.
Model Objective Model Diagram Statistical Method
MODEL 1
Correlation between user satisfaction and workstation
IEQ measurements
Ordinary Least Squares Ordered Logistic Fit
Density Analysis One-way ANOVA, T-Test
MODEL 2
Correlation between user satisfaction and technical attributes of building
systems
Ordinary Least Squares Ordered Logistic Fit Contingency Analysis Pearson Correlation MODEL 3 Correlation between workstation’s IEQ
measurements and technical attributes of building
systems
Ordinary Least Squares Ordered Logistic Fit
One-way ANOVA
MODEL 4
Correlation of user satisfaction with the combination of building attributes and workstation
IEQ measurements
Ordinary Least Squares Ordered Logistic Fit
MODEL 5
Correlation of user satisfaction with interaction
of building attributes and workstation IEQ
measurements
Ordinary Least Squares Ordered Logistic Fit
Effect Wald Test Effect Likelihood Ratio
2.4.1. Model 1
The purpose of Model 1 is to assess the correlation between the perceived user satisfaction and the physical IEQ measurements, and to identify which IEQ measurements have a direct impact on
office worker’s perceived satisfaction on thermal quality. To identify the critical variables, ordinary least squares, which covers a wide spectrum of standard models, including regression, Analysis of variance (ANOVA) and analysis of covariance, and Pearson’s chi-squared test, were utilized in 10 measured IEQ variables against selected user satisfaction questions. If the differences among user satisfaction levels were statistically significant (p < 0.05), we conducted density analyses and visualized the thresholds based on the 7-scale user satisfaction level.
2.4.2. Model 2
Model 2 was utilized to define the correlation between perceived user satisfaction and the technical attributes of the building systems, as well as to identify which attributes of building systems
Ordinary Least Squares Ordered Logistic Fit
Density Analysis One-way ANOVA,T-Test
MODEL 2
Correlation between user satisfaction and technical attributes of building systems
Buildings 2018, 8, x FOR PEER REVIEW 7 of 26
In this research, five models were developed as shown in Table 5. Using five models, we could confirm and re-check the results. A range of statistical methods and data mining algorithms were utilized to test the research hypotheses formalized in the POE field studies. The adopted tools includes descriptive statistics, two-sample t-tests, analysis of variance, and Baron and Kenny’s
mediated regression analysis methods [90]. Bivariate analysis was applied using the chi-squared test for contingency tables. A t-test was used with a 95% confidence interval for the mean by gender, the location of the workstation (perimeter vs core), and office type (open-plan vs closed) that were approximately normally distributed. Density analysis were used to define the thresholds by a 7-scale user satisfaction level. Finally, multiple logistic regression was used to identify significant predictors of user satisfaction. Differences among the 7-scale user satisfaction levels were calculated by prediction expression equations. In each model, outliers on the variables used in that phase only were excluded. Therefore, the number of cases in the analyses were slightly different from model to model.
Table 5. Objectives of five models and each diagram.
Model Objective Model Diagram Statistical Method
MODEL 1
Correlation between user satisfaction and workstation
IEQ measurements
Ordinary Least Squares Ordered Logistic Fit
Density Analysis One-way ANOVA, T-Test
MODEL 2
Correlation between user satisfaction and technical attributes of building
systems
Ordinary Least Squares Ordered Logistic Fit Contingency Analysis Pearson Correlation MODEL 3 Correlation between workstation’s IEQ
measurements and technical attributes of building
systems
Ordinary Least Squares Ordered Logistic Fit
One-way ANOVA
MODEL 4
Correlation of user satisfaction with the combination of building attributes and workstation
IEQ measurements
Ordinary Least Squares Ordered Logistic Fit
MODEL 5
Correlation of user satisfaction with interaction
of building attributes and workstation IEQ
measurements
Ordinary Least Squares Ordered Logistic Fit
Effect Wald Test Effect Likelihood Ratio
2.4.1. Model 1
The purpose of Model 1 is to assess the correlation between the perceived user satisfaction and the physical IEQ measurements, and to identify which IEQ measurements have a direct impact on
office worker’s perceived satisfaction on thermal quality. To identify the critical variables, ordinary least squares, which covers a wide spectrum of standard models, including regression, Analysis of variance (ANOVA) and analysis of covariance, and Pearson’s chi-squared test, were utilized in 10 measured IEQ variables against selected user satisfaction questions. If the differences among user satisfaction levels were statistically significant (p < 0.05), we conducted density analyses and visualized the thresholds based on the 7-scale user satisfaction level.
2.4.2. Model 2
Model 2 was utilized to define the correlation between perceived user satisfaction and the technical attributes of the building systems, as well as to identify which attributes of building systems
Ordinary Least Squares Ordered Logistic Fit Contingency Analysis
Pearson Correlation
MODEL 3
Correlation between workstation’s IEQ measurements and technical attributes of building systems
Buildings 2018, 8, x FOR PEER REVIEW 7 of 26
In this research, five models were developed as shown in Table 5. Using five models, we could confirm and re-check the results. A range of statistical methods and data mining algorithms were utilized to test the research hypotheses formalized in the POE field studies. The adopted tools includes descriptive statistics, two-sample t-tests, analysis of variance, and Baron and Kenny’s
mediated regression analysis methods [90]. Bivariate analysis was applied using the chi-squared test for contingency tables. A t-test was used with a 95% confidence interval for the mean by gender, the location of the workstation (perimeter vs core), and office type (open-plan vs closed) that were approximately normally distributed. Density analysis were used to define the thresholds by a 7-scale user satisfaction level. Finally, multiple logistic regression was used to identify significant predictors of user satisfaction. Differences among the 7-scale user satisfaction levels were calculated by prediction expression equations. In each model, outliers on the variables used in that phase only were excluded. Therefore, the number of cases in the analyses were slightly different from model to model.
Table 5. Objectives of five models and each diagram.
Model Objective Model Diagram Statistical Method
MODEL 1
Correlation between user satisfaction and workstation
IEQ measurements
Ordinary Least Squares Ordered Logistic Fit
Density Analysis One-way ANOVA, T-Test
MODEL 2
Correlation between user satisfaction and technical attributes of building
systems
Ordinary Least Squares Ordered Logistic Fit Contingency Analysis Pearson Correlation MODEL 3 Correlation between workstation’s IEQ
measurements and technical attributes of building
systems
Ordinary Least Squares Ordered Logistic Fit
One-way ANOVA
MODEL 4
Correlation of user satisfaction with the combination of building attributes and workstation
IEQ measurements
Ordinary Least Squares Ordered Logistic Fit
MODEL 5
Correlation of user satisfaction with interaction
of building attributes and workstation IEQ
measurements
Ordinary Least Squares Ordered Logistic Fit
Effect Wald Test Effect Likelihood Ratio
2.4.1. Model 1
The purpose of Model 1 is to assess the correlation between the perceived user satisfaction and the physical IEQ measurements, and to identify which IEQ measurements have a direct impact on
office worker’s perceived satisfaction on thermal quality. To identify the critical variables, ordinary least squares, which covers a wide spectrum of standard models, including regression, Analysis of variance (ANOVA) and analysis of covariance, and Pearson’s chi-squared test, were utilized in 10 measured IEQ variables against selected user satisfaction questions. If the differences among user satisfaction levels were statistically significant (p < 0.05), we conducted density analyses and visualized the thresholds based on the 7-scale user satisfaction level.
2.4.2. Model 2
Model 2 was utilized to define the correlation between perceived user satisfaction and the technical attributes of the building systems, as well as to identify which attributes of building systems
Ordinary Least Squares Ordered Logistic Fit
One-way ANOVA
MODEL 4
Correlation of user satisfaction with the combination of
building attributes and workstation IEQ
measurements
Buildings 2018, 8, x FOR PEER REVIEW 7 of 26
In this research, five models were developed as shown in Table 5. Using five models, we could confirm and re-check the results. A range of statistical methods and data mining algorithms were utilized to test the research hypotheses formalized in the POE field studies. The adopted tools includes descriptive statistics, two-sample t-tests, analysis of variance, and Baron and Kenny’s
mediated regression analysis methods [90]. Bivariate analysis was applied using the chi-squared test for contingency tables. A t-test was used with a 95% confidence interval for the mean by gender, the location of the workstation (perimeter vs core), and office type (open-plan vs closed) that were approximately normally distributed. Density analysis were used to define the thresholds by a 7-scale user satisfaction level. Finally, multiple logistic regression was used to identify significant predictors of user satisfaction. Differences among the 7-scale user satisfaction levels were calculated by prediction expression equations. In each model, outliers on the variables used in that phase only were excluded. Therefore, the number of cases in the analyses were slightly different from model to model.
Table 5. Objectives of five models and each diagram.
Model Objective Model Diagram Statistical Method
MODEL 1
Correlation between user satisfaction and workstation
IEQ measurements
Ordinary Least Squares Ordered Logistic Fit
Density Analysis One-way ANOVA, T-Test
MODEL 2
Correlation between user satisfaction and technical attributes of building
systems
Ordinary Least Squares Ordered Logistic Fit Contingency Analysis Pearson Correlation MODEL 3 Correlation between workstation’s IEQ
measurements and technical attributes of building
systems
Ordinary Least Squares Ordered Logistic Fit
One-way ANOVA
MODEL 4
Correlation of user satisfaction with the combination of building attributes and workstation
IEQ measurements
Ordinary Least Squares Ordered Logistic Fit
MODEL 5
Correlation of user satisfaction with interaction
of building attributes and workstation IEQ
measurements
Ordinary Least Squares Ordered Logistic Fit
Effect Wald Test Effect Likelihood Ratio
2.4.1. Model 1
The purpose of Model 1 is to assess the correlation between the perceived user satisfaction and the physical IEQ measurements, and to identify which IEQ measurements have a direct impact on
office worker’s perceived satisfaction on thermal quality. To identify the critical variables, ordinary least squares, which covers a wide spectrum of standard models, including regression, Analysis of variance (ANOVA) and analysis of covariance, and Pearson’s chi-squared test, were utilized in 10 measured IEQ variables against selected user satisfaction questions. If the differences among user satisfaction levels were statistically significant (p < 0.05), we conducted density analyses and visualized the thresholds based on the 7-scale user satisfaction level.
2.4.2. Model 2
Model 2 was utilized to define the correlation between perceived user satisfaction and the technical attributes of the building systems, as well as to identify which attributes of building systems
Ordinary Least Squares Ordered Logistic Fit
MODEL 5
Correlation of user satisfaction with interaction of building
attributes and workstation IEQ measurements
Buildings 2018, 8, x FOR PEER REVIEW 7 of 26
In this research, five models were developed as shown in Table 5. Using five models, we could confirm and re-check the results. A range of statistical methods and data mining algorithms were utilized to test the research hypotheses formalized in the POE field studies. The adopted tools includes descriptive statistics, two-sample t-tests, analysis of variance, and Baron and Kenny’s
mediated regression analysis methods [90]. Bivariate analysis was applied using the chi-squared test for contingency tables. A t-test was used with a 95% confidence interval for the mean by gender, the location of the workstation (perimeter vs core), and office type (open-plan vs closed) that were approximately normally distributed. Density analysis were used to define the thresholds by a 7-scale user satisfaction level. Finally, multiple logistic regression was used to identify significant predictors of user satisfaction. Differences among the 7-scale user satisfaction levels were calculated by prediction expression equations. In each model, outliers on the variables used in that phase only were excluded. Therefore, the number of cases in the analyses were slightly different from model to model.
Table 5. Objectives of five models and each diagram.
Model Objective Model Diagram Statistical Method
MODEL 1
Correlation between user satisfaction and workstation
IEQ measurements
Ordinary Least Squares Ordered Logistic Fit
Density Analysis One-way ANOVA, T-Test
MODEL 2
Correlation between user satisfaction and technical attributes of building
systems
Ordinary Least Squares Ordered Logistic Fit Contingency Analysis Pearson Correlation MODEL 3 Correlation between workstation’s IEQ
measurements and technical attributes of building
systems
Ordinary Least Squares Ordered Logistic Fit
One-way ANOVA
MODEL 4
Correlation of user satisfaction with the combination of building attributes and workstation
IEQ measurements
Ordinary Least Squares Ordered Logistic Fit
MODEL 5
Correlation of user satisfaction with interaction
of building attributes and workstation IEQ
measurements
Ordinary Least Squares Ordered Logistic Fit
Effect Wald Test Effect Likelihood Ratio
2.4.1. Model 1
The purpose of Model 1 is to assess the correlation between the perceived user satisfaction and the physical IEQ measurements, and to identify which IEQ measurements have a direct impact on
office worker’s perceived satisfaction on thermal quality. To identify the critical variables, ordinary least squares, which covers a wide spectrum of standard models, including regression, Analysis of variance (ANOVA) and analysis of covariance, and Pearson’s chi-squared test, were utilized in 10 measured IEQ variables against selected user satisfaction questions. If the differences among user satisfaction levels were statistically significant (p < 0.05), we conducted density analyses and visualized the thresholds based on the 7-scale user satisfaction level.
2.4.2. Model 2
Model 2 was utilized to define the correlation between perceived user satisfaction and the technical attributes of the building systems, as well as to identify which attributes of building systems
Ordinary Least Squares Ordered Logistic Fit
Effect Wald Test Effect Likelihood Ratio
2.4.1. Model 1
The purpose of Model 1 is to assess the correlation between the perceived user satisfaction and the physical IEQ measurements, and to identify which IEQ measurements have a direct impact on office worker’s perceived satisfaction on thermal quality. To identify the critical variables, ordinary least squares, which covers a wide spectrum of standard models, including regression, Analysis of variance (ANOVA) and analysis of covariance, and Pearson’s chi-squared test, were utilized in 10 measured IEQ variables against selected user satisfaction questions. If the differences among user satisfaction levels were statistically significant (p< 0.05), we conducted density analyses and visualized the thresholds based on the 7-scale user satisfaction level.
2.4.2. Model 2
Model 2 was utilized to define the correlation between perceived user satisfaction and the technical attributes of the building systems, as well as to identify which attributes of building systems predicted perceived satisfaction. The ordinary least squares and Pearson’s chi-squared test methods were conducted to identify critical physical building characters that were related to perceived user satisfaction. Among variables in TABS, the indices that were not binomial characters were converted to factor variables.
2.4.3. Model 3
Model 3 was used to define correlations between IEQ measurements and building attributes, and identify which building attributes predict IEQ. The correlation analysis was conducted for TABS variables and NEAT measurements of IEQ. An ordinary least squares and ordered logistic fit were conducted to identify critical physical building characters which were related to IEQ measurements.
2.4.4. Model 4
Buildings2018,8, 156 8 of 24
perimeter versus core workstation location, open-plan versus closed-office types, and season were also tested with those variables for correlation with user satisfaction. In this model, the correlation between a total of twenty variables (10 physical attributes investigated in the TABS record and 10 sets of workstation IEQ measurements assessed by a NEAT instrument) and two user satisfaction responses investigated in the COPE questionnaires (i.e., air temperature in the work area and air movement in the work area) were analyzed using ordinary least squares and ordered logistic fit. The mediation effects were also tested in this stage, followed by Baron and Kenny’s regression analysis methods [90].
2.4.5. Model 5
The goal of Model 5 was to identify which combination of technical attributes of building systems and workstation’s IEQ measurements affected user satisfaction, as well as defining how much % was affected. Initially, all variables (10 technical attributes of building systems and 10 IEQ measurements) were tested against user satisfaction using ordinary least squares and ordered logistic fit. However, because of the multicollinearity and omitted values in the process, we developed ‘Model 5’, which included critical variables selected from models 1 to 4. To quantify the correlation of each variable and to predict the effectiveness, an ordered logistic fit and generalized linear model tests were performed, accompanied with a maximum likelihood estimation and the Wald test.
3. Results
Given the NEAT database of 1197 workstations in 64 buildings, overall, 55% of occupants responded as ‘satisfied’ or ‘neutral’, and 45% of occupants reported as ‘dissatisfied’ with their thermal conditions. The average temperature satisfaction was 3.5, which fell between ‘somewhat dissatisfied’ and ‘neutral’ with their temperature satisfaction on a 7-point scale (very dissatisfied, dissatisfied, somewhat dissatisfied, neutral, somewhat satisfied, satisfied, and very satisfied) survey.
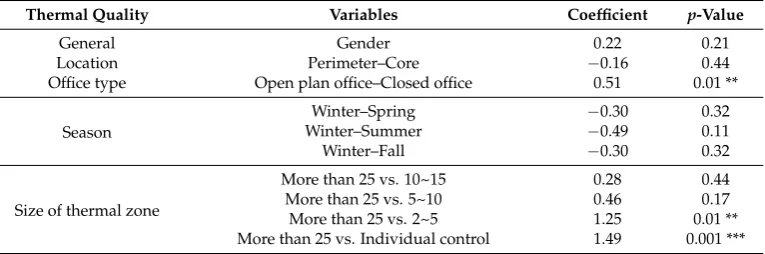
The combination of technical attributes of the building systems and workstation IEQ measurements that had significant correlation with user satisfaction are as follows (Table6).
• Occupants in closed offices showed higher satisfaction than occupants in an open-plan office location (p= 0.01).
• A smaller “size of zone” could increase user satisfaction (p= 0.01).
• Individual control of the thermostat could increase user satisfaction (p= 0.001).
• Better “window quality (enclosure)” could increase user satisfaction (p= 0.03).
[image:9.595.108.491.602.729.2]• The air temperature at 60 cm from the floor and radiant temperature asymmetry between the exterior and interior walls significantly affected user satisfaction (p< 0.05).
Table 6.Correlation of user satisfaction with a combination of technical attributes of building systems and workstation thermal quality measurements: Thermal quality.
Thermal Quality Variables Coefficient p-Value
General Gender 0.22 0.21
Location Perimeter–Core −0.16 0.44
Office type Open plan office–Closed office 0.51 0.01 **
Season
Winter–Spring −0.30 0.32
Winter–Summer −0.49 0.11
Winter–Fall −0.30 0.32
Size of thermal zone
Buildings2018,8, 156 9 of 24
Table 6.Cont.
Thermal Quality Variables Coefficient p-Value
Main System
Constant volume 0.75 0.16
Variable air volume/terminal reheat −0.37 0.66 Separate thermal and ventilation −0.95 0.57
Level of Control Locked vs. Locked but visible thermostatLocked vs. Controllable thermostat −2.130.12 0.05 *0.93
Window Quality Leaky, single pane vs. Moderate tight, two panes 1.09 0.05 * Leaky, single pane vs. Tight, three panes 1.49 0.03 *
NEAT Measurements
Air temperature at 110 cm 0.10 0.05 * Air temperature at 60 cm 0.11 0.05 * Air temperature at 10 cm 0.03 0.85
Relative humidity −0.05 0.16 Radiant temperature of interior wall −0.03 0.52 Radiant temperature of ceiling 0.05 0.41 Radiant temperature of floor 0.01 0.10 Radiant temperature of exterior wall −0.03 0.44 Horizontal radiant temperature asymmetry −0.13 0.05 *
Vertical radiant temperature asymmetry −0.10 0.07 Notes: *p≤0.05, **p≤0.01, ***p≤0.001.
3.1. Air Temperature
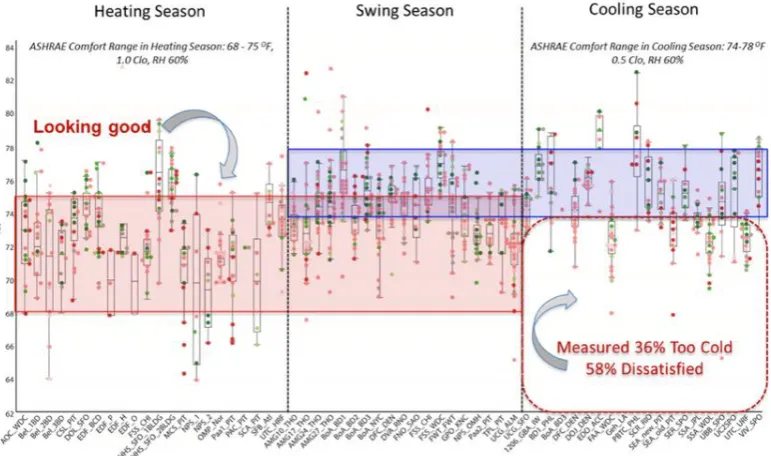
[image:10.595.107.493.416.644.2]CMU’s analysis of the NEAT database revealed that during the heating and swing seasons, 85% of the measured temperatures were within the ASHRAE 55 thermal comfort range, which is between 20◦C and 25.6◦C. However, during the cooling season, 36% of measured temperatures were below the comfort range, and resulted in 58% dissatisfaction in the user thermal survey (FigureBuildings 2018, 8, x FOR PEER REVIEW 3). 10 of 26
Figure 3. Air temperature at 60 cm from the floor (n = 1282).
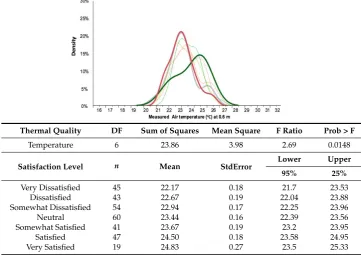
To identify the thresholds of the satisfaction with the temperature in the summer, density analyses were conducted, as shown in Table 7. The red curve shows the range of temperatures from the dissatisfied group, and the green curve is the satisfied group. The majority of the temperatures for the dissatisfied workstations were around 22.7 °C, and the satisfied group’s temperatures were
around 24.8 °C. The difference was statistically significant (p < 0.05). The result showed that warmer temperatures are considered in cooling season by looking at measured field temperatures in workstations correlated with user satisfaction level.
Table 7. Analysis of variance of air temperature at 60 cm from the floor by user satisfaction, cooling season (n = 309).
Thermal Quality DF Sum of Squares Mean Square F Ratio Prob > F
Temperature 6 23.86 3.98 2.69 0.0148
Satisfaction Level n Mean StdError Lower Upper 95% 25%
Very Dissatisfied 45 22.17 0.18 21.7 23.53 Dissatisfied 43 22.67 0.19 22.04 23.88 Somewhat Dissatisfied 54 22.94 0.17 22.25 23.96 Neutral 60 23.44 0.16 22.39 23.56 Somewhat Satisfied 41 23.67 0.19 23.2 23.95 Satisfied 47 24.50 0.18 23.58 24.95 Very Satisfied 19 24.83 0.27 23.5 25.33
Figure 3.Air temperature at 60 cm from the floor (n= 1282).
Buildings2018,8, 156 10 of 24
Table 7.Analysis of variance of air temperature at 60 cm from the floor by user satisfaction, cooling season (n= 309).
Buildings 2018, 8, x FOR PEER REVIEW 10 of 26
Figure 3. Air temperature at 60 cm from the floor (n = 1282).
To identify the thresholds of the satisfaction with the temperature in the summer, density analyses were conducted, as shown in Table 7. The red curve shows the range of temperatures from the dissatisfied group, and the green curve is the satisfied group. The majority of the temperatures for the dissatisfied workstations were around 22.7 °C, and the satisfied group’s temperatures were
around 24.8 °C. The difference was statistically significant (p < 0.05). The result showed that warmer temperatures are considered in cooling season by looking at measured field temperatures in workstations correlated with user satisfaction level.
Table 7. Analysis of variance of air temperature at 60 cm from the floor by user satisfaction, cooling season (n = 309).
Thermal Quality DF Sum of Squares Mean Square F Ratio Prob > F
Temperature 6 23.86 3.98 2.69 0.0148
Satisfaction Level n Mean StdError Lower Upper 95% 25%
Very Dissatisfied 45 22.17 0.18 21.7 23.53 Dissatisfied 43 22.67 0.19 22.04 23.88 Somewhat Dissatisfied 54 22.94 0.17 22.25 23.96 Neutral 60 23.44 0.16 22.39 23.56 Somewhat Satisfied 41 23.67 0.19 23.2 23.95 Satisfied 47 24.50 0.18 23.58 24.95 Very Satisfied 19 24.83 0.27 23.5 25.33
Thermal Quality DF Sum of Squares Mean Square F Ratio Prob > F
Temperature 6 23.86 3.98 2.69 0.0148
Satisfaction Level n Mean StdError Lower Upper
95% 25%
Very Dissatisfied 45 22.17 0.18 21.7 23.53
Dissatisfied 43 22.67 0.19 22.04 23.88
Somewhat Dissatisfied 54 22.94 0.17 22.25 23.96
Neutral 60 23.44 0.16 22.39 23.56
Somewhat Satisfied 41 23.67 0.19 23.2 23.95
Satisfied 47 24.50 0.18 23.58 24.95
Very Satisfied 19 24.83 0.27 23.5 25.33
t-test (95% confident interval,p< 0.05), statistically significant. Mean of temperature at satisfaction range: 24.8◦C, Mean of temperature at dissatisfaction range: 22.7◦C.
3.2. Size of Themral Zone
Figure4shows the distribution in the size of the zone for 1155 workstations in 64 buildings, divided between the perimeter and core office locations. A total of 13% of offices had one thermostat shared by more than 25 people, 32% of the offices were controlled by 10–15 persons per thermostat (n= 419), 36% of workstations had 5–10 people per thermostat (n= 373), and 19% had less than five people (individual control 5%,n= 58; and 2–5 people 14%,n= 158).
Buildings 2018, 8, x FOR PEER REVIEW 11 of 26
t-test (95% confident interval, p < 0.05), statistically significant. Mean of temperature at satisfaction range: 24.8 °C, Mean of temperature at dissatisfaction range: 22.7 °C.
3.2. Size of Themral Zone
[image:11.595.121.476.506.637.2]Figure 4 shows the distribution in the size of the zone for 1155 workstations in 64 buildings, divided between the perimeter and core office locations. A total of 13% of offices had one thermostat shared by more than 25 people, 32% of the offices were controlled by 10–15 persons per thermostat (n = 419), 36% of workstations had 5–10 people per thermostat (n = 373), and 19% had less than five people (individual control 5%, n = 58; and 2–5 people 14%, n = 158).
Figure 4. Distribution in Size of thermal zone for 1155 questionnaire respondents in 64 buildings.
The results showed that temperature satisfaction increased as the thermal zone decreased by size, as fewer people shared a single thermostat in both heating and cooling seasons (Figure 5). Table 8 shows the variables used in the size of thermal zone and satisfaction analysis in both Cooling and heating seasons. The relationship between size of thermal zone and user satisfaction levels are highly correlated as examined in Table 9. On average, 80% of occupants were satisfied with an individual thermal zone, while only 20% of occupants were satisfied when 15–25 people shared one thermostat (n = 737, b = 44, p < 0.001).
Figure 4.Distribution in Size of thermal zone for 1155 questionnaire respondents in 64 buildings.
Buildings2018,8, 156 11 of 24
Buildings 2018, 8, x FOR PEER REVIEW 11 of 26
t-test (95% confident interval, p < 0.05), statistically significant. Mean of temperature at satisfaction range: 24.8 °C, Mean of temperature at dissatisfaction range: 22.7 °C.
3.2. Size of Themral Zone
Figure 4 shows the distribution in the size of the zone for 1155 workstations in 64 buildings, divided between the perimeter and core office locations. A total of 13% of offices had one thermostat shared by more than 25 people, 32% of the offices were controlled by 10–15 persons per thermostat (n = 419), 36% of workstations had 5–10 people per thermostat (n = 373), and 19% had less than five people (individual control 5%, n = 58; and 2–5 people 14%, n = 158).
Figure 4. Distribution in Size of thermal zone for 1155 questionnaire respondents in 64 buildings.
[image:12.595.122.476.88.364.2]The results showed that temperature satisfaction increased as the thermal zone decreased by size, as fewer people shared a single thermostat in both heating and cooling seasons (Figure 5). Table 8 shows the variables used in the size of thermal zone and satisfaction analysis in both Cooling and heating seasons. The relationship between size of thermal zone and user satisfaction levels are highly correlated as examined in Table 9. On average, 80% of occupants were satisfied with an individual thermal zone, while only 20% of occupants were satisfied when 15–25 people shared one thermostat (n = 737, b = 44, p < 0.001).
[image:12.595.100.499.410.514.2]Figure 5.User satisfactions on air temperature by the size of zone (heating and cooling season,n= 737).
Table 8.Descriptive statistics for user satisfaction on air temperature by the size of the zone.
Season Size ofZone n Very
Dissatisfied Dissatisfied
Somewhat
Dissatisfied Neutral
Somewhat
Satisfied Satisfied Very Satisfied
Heating (n= 420)
15~25 68 5.88% 10.29% 48.53% 14.71% 8.82% 8.82% 2.94% 10~15 75 5.33% 13.33% 26.67% 21.33% 14.67% 13.33% 5.33% 5~10 198 6.57% 10.61% 25.25% 15.66% 21.72% 16.16% 4.04% 2~5 70 2.86% 12.86% 22.86% 15.71% 25.71% 17.14% 2.86% Individual 9 0% 11.11% 11.11% 0% 11.11% 11.11% 55.56%
Cooling (n= 317)
15~25 45 20% 15.56% 28.89% 15.56% 11.11% 8.89% 0% 10~15 147 19.05% 12.24% 17.01% 28.57% 9.52% 12.24% 1.36%
[image:12.595.116.478.546.618.2]5~10 68 5.88% 19.12% 20.59% 14.71% 19.12% 17.65% 2.94% 2~5 39 7.69% 10.26% 7.69% 12.82% 17.95% 23.08% 20.51% Individual 18 5.56% 5.56% 11.11% 0% 11.11% 27.78% 38.89%
Table 9.Contingency analysis of user satisfaction on air temperature by size of zone by Season.
Season n Test Statistics Chi-Square Prob > ChiSq
Heating Season 420 Likelihood Ratio 50.304 0.0013 **
- - Pearson 43.420 0.0089 **
Cooling Season 317 Likelihood Ratio 67.022 <0.0001 ***
- - Pearson 77.380 <0.0001 ***
Notes: *p≤0.05, **p≤0.01, ***p≤0.001.
Buildings2018,8, 156 12 of 24
Buildings 2018, 8, x FOR PEER REVIEW 12 of 26
Figure 5. User satisfactions on air temperature by the size of zone (heating and cooling season, n = 737).
Table 8. Descriptive statistics for user satisfaction on air temperature by the size of the zone.
Season Size of Zone n
Very
Dissatisfied Dissatisfied
Somewhat
Dissatisfied Neutral
Somewhat
Satisfied Satisfied
Very Satisfied
Heating (n = 420)
15~25 68 5.88% 10.29% 48.53% 14.71% 8.82% 8.82% 2.94% 10~15 75 5.33% 13.33% 26.67% 21.33% 14.67% 13.33% 5.33% 5~10 198 6.57% 10.61% 25.25% 15.66% 21.72% 16.16% 4.04% 2~5 70 2.86% 12.86% 22.86% 15.71% 25.71% 17.14% 2.86% Individual 9 0% 11.11% 11.11% 0% 11.11% 11.11% 55.56%
Cooling (n = 317)
15~25 45 20% 15.56% 28.89% 15.56% 11.11% 8.89% 0% 10~15 147 19.05% 12.24% 17.01% 28.57% 9.52% 12.24% 1.36%
5~10 68 5.88% 19.12% 20.59% 14.71% 19.12% 17.65% 2.94% 2~5 39 7.69% 10.26% 7.69% 12.82% 17.95% 23.08% 20.51% Individual 18 5.56% 5.56% 11.11% 0% 11.11% 27.78% 38.89%
Table 9. Contingency analysis of user satisfaction on air temperature by size of zone by Season.
Season n Test Statistics Chi-Square Prob > ChiSq
Heating Season 420 Likelihood Ratio 50.304 0.0013 ** - - Pearson 43.420 0.0089 ** Cooling Season 317 Likelihood Ratio 67.022 <0.0001 ***
- - Pearson 77.380 <0.0001 *** Notes: * p ≤ 0.05, ** p ≤ 0.01, *** p ≤ 0.001.
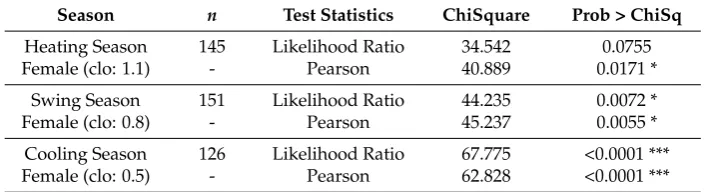
The disparity was especially significant for females during the cooling season, with the highest thermal dissatisfaction in large zone areas (with colder temperatures and seasonal clothing) as shown in Figure 6. The clo values, the thermal insulation of clothing, are considered as a value of 1.1 in heating season, 0.8 in swing season and 0.5 in cooling season. There is a significant correlation
between size of thermal zone and female occupants’ satisfaction level regardless of the seasons (Table
[image:13.595.99.497.87.300.2]10). Thermal satisfaction on females can be affected by their clothing because clo value in females is 0.5 whereas males is value of 0.7 [76]. During the cooling season, when 15–25 people shared one thermostat, only 7% of female occupants were satisfied with the air temperature, while the workstations with individual thermostat showed 64% satisfaction (n = 422, b = 22, p < 0.001).
[image:13.595.121.475.345.441.2]Figure 6.Figure 6. User satisfactions on air temperature for female occupants by size of zone by season (clo). User satisfactions on air temperature for female occupants by size of zone by season (clo). Table 10.Contingency Analysis of User Satisfaction on Temperature by Size of Zone, Female.
Season n Test Statistics ChiSquare Prob > ChiSq
Heating Season 145 Likelihood Ratio 34.542 0.0755
Female (clo: 1.1) - Pearson 40.889 0.0171 *
Swing Season 151 Likelihood Ratio 44.235 0.0072 *
Female (clo: 0.8) - Pearson 45.237 0.0055 *
Cooling Season 126 Likelihood Ratio 67.775 <0.0001 *** Female (clo: 0.5) - Pearson 62.828 <0.0001 ***
Notes: *p≤0.05, **p≤0.01, ***p≤0.001.
Looking at the cooling season data more closely revealed that when the size of the thermal zone was less than five controls and two to five people per thermostat, over 90% of the measured temperatures were within the ASHRAE comfort range, as highlighted in Figure7. However, when the size of zone was over 10, or 10–25 people/thermostat, about 80% of workstations were deemed as “too cold” at an average temperature of 21.7◦C. Summer data can be statistically addressed by redirecting the size of thermal zone to less than five, and by raising air temperature. At present, there are no code mandates limiting the size of thermal zones, with value engineering often reducing the number of engineered zones before construction even begins. The results revealed that 80% satisfaction might only be achievable with ‘micro-zoning (the size of zone is less than 5)’, providing a level of temperature control at every workstation.
3.3. Level of Temperature Control
Buildings2018,8, 156 13 of 24
Buildings 2018, 8, x FOR PEER REVIEW 13 of 26
Table 10. Contingency Analysis of User Satisfaction on Temperature by Size of Zone, Female.
Season n Test Statistics ChiSquare Prob > ChiSq
Heating Season 145 Likelihood Ratio 34.542 0.0755 Female (clo: 1.1) - Pearson 40.889 0.0171 *
Swing Season 151 Likelihood Ratio 44.235 0.0072 * Female (clo: 0.8) - Pearson 45.237 0.0055 * Cooling Season 126 Likelihood Ratio 67.775 <0.0001 *** Female (clo: 0.5) - Pearson 62.828 <0.0001 ***
Notes: * p ≤ 0.05, ** p ≤ 0.01, *** p ≤ 0.001.
Looking at the cooling season data more closely revealed that when the size of the thermal zone was less than five controls and two to five people per thermostat, over 90% of the measured temperatures were within the ASHRAE comfort range, as highlighted in Figure 7. However, when the size of zone was over 10, or 10–25 people/thermostat, about 80% of workstations were deemed as
“too cold” at an average temperature of 21.7 °C. Summer data can be statistically addressed by
redirecting the size of thermal zone to less than five, and by raising air temperature. At present, there are no code mandates limiting the size of thermal zones, with value engineering often reducing the number of engineered zones before construction even begins. The results revealed that 80%
[image:14.595.84.511.87.337.2]satisfaction might only be achievable with ‘micro-zoning (the size of zone is less than 5)’, providing a level of temperature control at every workstation.
Figure 7. Air temperature of 60 cm from the floor by size of zone, and temperature satisfaction colored by seven scales.
3.3. Level of Temperature Control
The level of user control can predict user satisfaction on temperature. In this paper, the level of control was surveyed in three categories: hidden thermostat, visible but locked thermostat, and controllable thermostat. A total of 65% had hidden thermostats in the office among 1004 respondents, a majority of workstations, and only 18% of occupants could control their thermal environment, as summarized in Table 11.
[image:14.595.82.513.411.482.2]Figure 7.Air temperature of 60 cm from the floor by size of zone, and temperature satisfaction colored by seven scales.
Table 11.Distribution in level of control for questionnaire respondents in 64 buildings (divided between open and closed office locations).
Level of Thermal Control (n= 1004)
Type Hidden Thermostat Locked But Visible Thermostat Controllable Thermostat
N, Ratio (%) n= 656 (65%) n= 170 (17%) n= 178 (18%)
Office type 484 open offices 172 closed offices
110 open offices 60 closed offices
60 open offices 118 closed offices
[image:14.595.87.509.625.703.2]Table12shows the variables and summery statistics for user satisfaction on air temperature by the level of control. The level of thermostat control is significantly related to occupant satisfaction in both open-plan offices and closed offices (Table13). The result showed that occupants with access to controllable thermostats had higher satisfaction (62%), while locked but visible thermostats yielded worse satisfaction (22%) than hidden thermostats (36%). Locked but visible thermostats were worse than hidden thermostats in both open-plan (n= 654, b = 64,p< 0.01) and closed offices (n= 350, b = 64, p< 0.05) (Figure8).
Table 12.Descriptive statistics for user satisfaction on air temperature by the level of control.
Office Type
Thermal
Control n
Very
Dissatisfied Dissatisfied
Somewhat
Dissatisfied Neutral
Somewhat
Satisfied Satisfied Very Satisfied
Open-plan (n= 654)
Hidden 440 6.4% 15.5% 23.2% 19.5% 15.5% 15.0% 5.0%
Locked 74 16.2% 13.5% 32.4% 10.8% 16.2% 8.1% 2.7%
Controllable 116 3.4% 6.9% 20.7% 3.4% 19.0% 37.9% 8.6% Closed
(n= 350)
Hidden 208 7.7% 7.7% 31.7% 17.3% 12.5% 16.3% 6.7%
Locked 88 9.1% 27.3% 40.9% 6.8% 6.8% 6.8% 2.3%
Buildings2018,8, 156 14 of 24
Table 13.Contingency analysis of user satisfaction on temperature by level of control by office type (open-plan vs. closed office).
Level of Control n Test Statistics Chi Square Prob > ChiSq
Open-plan Office 654 Likelihood Ratio 47.242 0.0002 **
- - Pearson 42.202 0.0010 **
Closed Office 350 Likelihood Ratio 32.951 0.0169 *
- - Pearson 33.022 0.0166 *
Notes: *p≤0.05, **p≤0.01, ***p≤0.001.
Buildings 2018, 8, x FOR PEER REVIEW 15 of 26
Figure 8. User satisfaction on air temperature by the level of control (Open and Closed Offices).
3.4. Radiant Temperature Asymmetry with Façade
Large differences in the thermal radiation of the surfaces surrounding an occupant may cause local discomfort. The ASHRAE Standard 55 sets limits on the allowable temperature differences between various surfaces [82]. Ensuring that the temperature asymmetry between exterior and interior walls is less than 3.9 °C increased user satisfaction by 0.73 points in perimeter offices (n = 692, b = 64, p < 0.001). There was a significant correlation between radiant temperature asymmetry between the exterior and interior walls, and user satisfaction in perimeter offices (p < 0.0001), but the relationship was not relevant in core offices (p = 0.08). There is a significant correlation between radiant temperature asymmetry between exterior and interior walls, and user satisfaction in perimeter offices (p < 0.0001). The mean radiant temperature asymmetry between exterior and interior walls in perimeter offices was only 1.7 °C, which was far below ASHRAE’s temperature of
10 °C [76].
To identify the thresholds of satisfaction, density analyses were conducted (Table 14). The majority of the temperature differences for the dissatisfied group were greater than 2.2 °C, and the
satisfied group’s temperatures were less than 1.0 °C. The difference was statistically significant (95% confident interval, p < 0.05). Based on this analysis, there was a possibility that people were less satisfied when the radiant asymmetry between exterior and interior walls was greater than 2.2 °C.
Figure 8.User satisfaction on air temperature by the level of control (Open and Closed Offices).
3.4. Radiant Temperature Asymmetry with Façade
Large differences in the thermal radiation of the surfaces surrounding an occupant may cause local discomfort. The ASHRAE Standard 55 sets limits on the allowable temperature differences between various surfaces [82]. Ensuring that the temperature asymmetry between exterior and interior walls is less than 3.9◦C increased user satisfaction by 0.73 points in perimeter offices (n= 692, b = 64, p< 0.001). There was a significant correlation between radiant temperature asymmetry between the exterior and interior walls, and user satisfaction in perimeter offices (p< 0.0001), but the relationship was not relevant in core offices (p= 0.08). There is a significant correlation between radiant temperature asymmetry between exterior and interior walls, and user satisfaction in perimeter offices (p< 0.0001). The mean radiant temperature asymmetry between exterior and interior walls in perimeter offices was only 1.7◦C, which was far below ASHRAE’s temperature of 10◦C [76].
[image:15.595.104.492.209.516.2]